| Dynamical solid-liquid transition through oscillatory shear† | |
| Éric Brillaux,∗a and Francesco Turcib | |
| Starting from an ideal crystalline state, we numerically study a nonequilibrium dynamical order-disorder transition promoted by the application of a periodic shearing protocol at low temperatures in model systems in two and three dimensions. We observe a continuous (2D) and discontinuous (3D) dynamical transition from an ordered to a disordered steady state. Through the analysis of large-scale simulations, we show that the amorphization mechanism around the discontinuous transition is reminiscent of spinodal decomposition. |
1 Introduction
It may be surprising, but crystalline solids can always flow. This happens not only in defective, i.e. finite temperature, solids via the motion of dislocations 1, 2, but also in perfect crystals, where a finite load induces distortions to relax the stresses 3, 4. However, the solid’s viscosity diverges as the applied deformation vanishes 5, which is consistent with our everyday experience.
Hence ,ideal crystals can undergo relaxation and observable flow if we are patient enough: yet, it is not clear how ordered solids enter the flowing state and how this process depends on the specific symmetries and composition of the crystal. Theoretical approaches based on nucleation theory 5, 6 provide a promising route to account for the emergence of flow. Such approaches are however valid at vanishingly small stresses (or strains): a different scenario is expected for finite, large loads.
In an inspiring work by Sausset et al. 5 it was conjectured that (in analogy with ferromagnetic systems 7) the application of oscillatory shear to crystalline solids would reveal a nonequilibrium, dynamical phase transition between a non-flowing regime (elastic, reversible and ordered) and a flowing regime (plastic, irreversible and amorphous) triggered by nucleation at a particular shear amplitude or frequency.
Here we precisely tackle such conjecture, and study a reversible-irreversible dynamical phase transition in several models under oscillatory shear. Depending on the dimensionality of the model and the nature of the ordered state, different order-disorder and reversible-irreversible transitions are observed as a function of the external driving amplitude. The dynamical transition that we observe is distinct from previous disorder-disorder transitions 8 and shear-melting studies 9. In particular, the transition we are ineterested in is an intrinsically nonequilibrium transition between different periodically driven steady states, as opposed to shear-melting transitions, where crystalline solids are linearly strained until their mechanical failure 9, 10.
In our analysis, we focus on the generic phenomenology of the transition, exploring how it depends on the dimensionality and the composition of the ordered phase. The transition is explored as a function of the amplitude of the periodic shear and the temperature of a stochastic thermostat coupled to the system. Given the generality of our investigation, we do not explore the effects of the particular orientation of the ordered state with respect to the shear direction or of the particular implementation of the thermostat. These details are known to affect the mechanical response of crystals 10, but do not influence the general features of the transition that we discuss.
In our analysis we find that in two dimensions, for one-component systems whose ordered state is hexagonal, a continuous transition takes place. In three dimensions, a discontinuous transition from a flowing to a non-flowing steady state is observed, with a particular scaling for the relaxation time to steady state and the distribution of the amorphous region. suggesting the that an instability analogous to spindoal decomposition dominates the amorphization instead of nucleation only.
The article is organised as follows: we first introduce the three studied models (2D single component Lennard Jones (LJ) system, 3D single component LJ and 3D two-component LJ), and specify the preparation and external driving protocols; we then sequentially discuss the phenomenology of the dynamical in transition for the three models, as identified by their specific order parameters; we finally focus on the 3D two-component LJ case, as it shows the clearest evidence for a dynamical transition driven by a spinodal instability; we summarise and discuss the implications of our observations in the conclusions.
2 Models and methods
We perform nonequilibrium molecular dynamics simulations of particle systems in two (2D) and three dimensions (3D) with Lennard Jones interactions. Each system is prepared in an ordered state at different temperatures and deformed according to a sinusoidal uniaxial shearing protocol of period and maximal strain amplitude . In two dimensions, we consider the LJ hexagonal lattice at fixed reduced density , which is approximately larger than the solid density at the triple point 11. In three dimensions, we consider two initial solid states: Firstly, the face centered cubic (fcc) LJ crystal, which is the stable phase for this model, at reduced density , with melting temperature 12; Secondly, the crystal structure corresponding to the low energy crystalline state of a popular LJ nonadditive binary mixture of large (A) and small (B) particles 13, prepared at pressure with estimated melting temperature 14.
We study the amorphization of ordered phases in two (2D) and three (3D) dimensions through oscillatory shear. For the sake of simplicity, we focus on systems with spherically symmetric interactions which are initially prepared in their respective thermodynamically stable ordered phases.
The preparation protocol of the several systems is detailed in the following sub-sections.
2.1 Two dimensional single component case
We consider a single component system of particles interacting via the Lennard-Jones potential
| (1) |
The parameters and provide the units for energy and length scales, the particle mass is set to unity as well as the Boltzmann constant , defining a set of reduced units. The potential is truncated and shifted at the conventional cutoff distance to speed-up the calculations.
For sufficiently high densities and low temperatures, the system attains an ordered hexagonal phase 15. This is a phase with only quasi-long range order, i.e. where spatial correlations decay slowly (algebraically as opposed to exponentially). We directly arrange the particles on an hexagonal lattice at number density , randomly initialize the velocities and equilibrate the ordered phase in the isothermal-isochoric (NVT) ensemble employing a deterministic Nose-Hoover thermostat with damping time reduced time units in a range of temperatures . We consider systems of sizes particles.
In order to characterise the degree of local order, we measure the global hexagonal order parameter , with
| (2) |
where is the list of the neighbours of particle , is the orientation of a vector connecting the centres of particle and the neighbour with respect to the a reference axis, and is the imaginary unit.
2.2 Three dimensions
For the three-dimensional case we consider two different ordered states: a single-component LJ crystal and two-component LJ crystal.
2.2.1 Single-component case
We employ precisely the same interaction potential as in Eq. 1 which in 3D leads to the formation of a genuine crystalline face-centered-cubic (fcc) solid phase at sufficiently high densities and low temperature 16. Here we report results for a particular reduced density and a range of temperatures . Notice that so-called quasi-universality in the Lennard-Jones systems ensures that these specific choices are not particularly important for the overall phenomenology of the dynamical transition under study 17.
Similar to the 2D case, the system is prepared in an ordered state through equilibration in the NVT ensemble via a Nosé-Hoover thermostat with damping time reduced units. We consider systems of particles.
2.2.2 Two-component case
We also consider a binary crystal with interaction parameters originally fixed by Kob and Andersen to model the behaviour of a metallic glassformer 13. Here we have large (A) and small (B) particles interacting via Lennard-Jones potentials tuned to to favour the A-B interaction, so that , and the cross interaction parameters are , . All quantities are expressed in terms of the large particles size and energy scale and mass . In the 2A:1B composition the system has been shown to grow at zero reduced pressure the crystalline lattice 14. For consistency, we prepare our ordered samples at zero pressure and consider systems of several sizes . To identify the corresponding density, we construct the equation of state following Vinet’s law for Lennard-Jones crystals
| (3) |
where and and are the bulk modulus and density at zero pressure.
As shown in the Supplementary Information† this expression provides a very good fit to the molecular dynamics results. It also allows us to estimate the temperature dependence of the bulk modulus and of the density at zero pressure . A linear fit to low temperatures provides an estimate for the density at zero pressure and temperature in agreement with previous estimates 21.
For the binary crystal , we use ring-statistics 18 and Voronoi-based metrics 19, 20 to measure the number of B particles in the center of a bicapped square antiprism (simply antiprism in the following), which is the distinctive motif of the crystal unit cell and a recurrent local motif (or locally favourite structure) in the melt 22, 23.
2.3 Oscillatory shear protocol
For our nonequilibrium protocol, we shear the several systems according to a sinusoidal deformation as implemented in the molecular dynamics package LAMMPS 24. The deformation is uniaxial along the x direction so that the strain as a function of time oscillates as in
| (4) |
where is the maximum shear amplitude and is the period of the oscillations. The obtained triclinic box is periodic in all dimensions (effectively implementing Lees-Edwards’s boundary conditions).
During the deformation, the temperature of the system is kept constant by a Langevin thermostat whose characteristic damping time is , where is the time step for the integration of the equations of motion, set to . For the different Lennard-Jones models considered here, we keep the period of the oscillations constant to in reduced Lennard Jones units and vary the other physical parameters, such as the amplitude of the oscillations or the temperature.
We typically consider 10 distinct realizations of the dynamics for a given set of parameters, starting from different initial conditions for both the prepared ordered state and the particle velocities, initialized from a pseudo-random sample of the Maxwell-Boltzmann distribution.
3 Results on the order-disorder dynamical transition
We are interested in the transition between two distinct nonequilibrium steady states (NESS): an ordered NESS, where the system remains in the prepared ordered state, and an amorphous (or only semi-crystalline) NESS, attained while the system is continuously subject to oscillatory shear and to modest thermal fluctuations.
We start with the analysis of the 2D LJ system; continue with the 3D LJ single component system and finally focus on the 3D two component (binary) LJ system.
3.1 Single-component 2D Lennard-Jones hexagonal solid
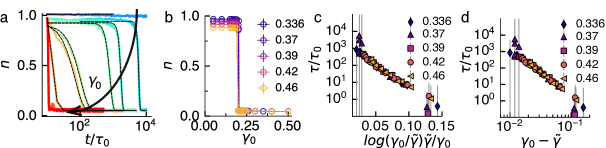
Two-dimensional LJ disks, in absence of external driving, undergo a liquid-hexagonal transition which proceeds via a Kosterlitz-Thouless-Halperin-Nelson-Young mechanism, i.e. through a so-called hexatic phase 25, 15 in a weakly first-order phase transition. The equilibrium ordered phase is known to be characterised by a mosaic of locally ordered (hexagonal) patches and amorphous structures 26. Here we promote the amoprhization of the hexagonal ordered state through sinusoidal shear of variable strain amplitude at several temperatures, . Starting from a thermalised hexagonal state, we monitor the time evolution of the global orientation order parameter for different values of the maximum strain amplitude , see Fig. 1(a). For small values of , the system responds elastically, and at every cycle it reversibly attains the initial ordered state characterised by large values of . However, as we increase the maximum amplitude, we observe that the orientational order parameter gradually relaxes to lower and lower values. We fit the relaxation curves with a stretched exponential , from which we derive the relaxation time , the long and short time value of the order parameter and and the stretching exponent which tends to unity from below as we approach larger strain amplitudes.
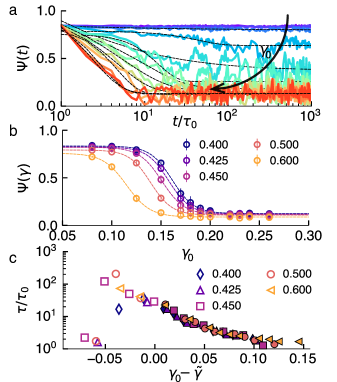
As shown in Fig. 1(b), the transition from an ordered to a disordered steady state occurs over a broad range of strain amplitudes at all the considered temperatures, so that we can successfully fit it with a hyperbolic tangent function , where is the fitting parameter corresponding to the inflection point of the curve. Plotting the resulting relaxation times as a function of the distance from the inflection point we manage to collapse the data from different temperatures on a semilogarithmic plot, Fig. 1(c), suggesting that the temperature dependence is mainly encoded in the crossover value . Only for the collapse fails, but this is because reliable values of the relaxation time cannot be obtained through the stretched exponential fit when the system relaxes on time scales larger than the simulation time scale. For , we observe that in the vicinity of , the relaxation time increases by less than two orders of magnitude with respect to the large regime.
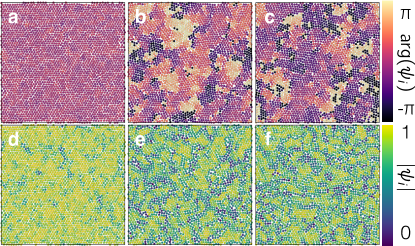
The transition can be analysed in terms of its effect on local orientational order, in terms of the the complex number associated to every particle . The spatial distributions of its modulus and argument allow us to keep track of the formation of boundaries between differently oriented regions.
In Fig. 2 we present configurations color-coded by the values of the argument and the modulus of respectively, for a particular temperature and strain amplitude over several periods of oscillatory shear.
Both the modulus and the argument of identify domains of coherence and local order. However, grain boundaries lacking 6-fold coordination are more immediately identified in the modulus, as low values of typically correspond to four-fold coordinated particles.
The reduction of quasi-long range order over time takes place through the formation of extended defect lines which break the lattice into sub-domains of smaller sizes. This demonstrates that orientational correlations span over smaller scales as the system reaches the disordered steady state. The size of the orientational coherence can be estimated from the decay of the conventional two-point correlation function
| (5) |
where the average here is only performed on all the particles at a given time .
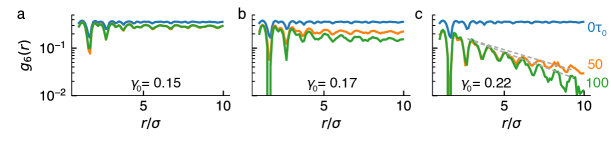
In Figure 3 we plot across the order-disorder crossover at a relatively cold temperature for after 0, 50 and 100 shearing cycles of duration . For correlations are strong well beyond ten particle diameters. In fact, the decay of the correlations can be fitted equally weel by exponential or power law decays, indications that correlations are quasi-long range, as in the hexatic phase of equilibrium disks. However, across the transition, orientational correlations decay more steeply and undergo a time evolution which is more rapid as the strain amplitude increases. At large strain amplitudes, , orientational correlations decay over a length .
Hence, in two dimensions, we observe a dynamical continuous crossover taking place through the formation of large regions of different orientations, which become progressively smaller as the strain amplitude is increased. Notice that at the chosen temperature and densities the quiescent (i.e. not driven) system would simply form an ordered hexagonal phase. The driven system, instead, present a wide spectrum of possible steady states of increasing orientational order as the amplitude of the strain oscillations is reduced.
3.2 Single-component 3D Lennard-Jones crystal
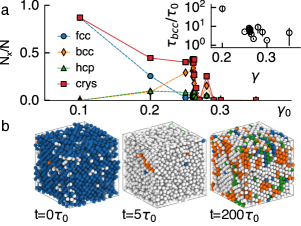
A very different scenario emerges from the three dimensional simulations. We first consider the single-component fcc crystal of LJ particles sheared along the orientation. We follow a protocol analogous to the two-dimensional case, but now we monitor (via Common Neighbour Analysis 18, 27 and Voronoi cell analysis as implemented in VoroTop 20) a variety of multiple crystalline motifs: fcc, hcp, bcc. We prepare an equilibrated fcc crystal at reduced density at temperatures , from around the triple point to well above the melting temperature. While at high temperature bulk melting dominates, interesting transitions emerge at low temperatures. In Fig. 4 we present the case of .
As we increase the shear amplitude the crystalline cells become highly distorted, so that a perfect fcc crystal is transformed into a defective fcc/hcp crystal with bcc inclusions, see Fig. 4(a) and †. However, for (corresponding to the constrained tension ideal strain of the fcc LJ crystal of 28) an abrupt transition to a non-crystalline steady state is observed. Interestingly, the structure of the crystal for is dominated by the bcc order instead of the fcc order. This is somehow surprising: for the quiescent bulk, the free energies of the hcp and fcc structures are close (with the fcc crystal being marginally lower in free energy) while the bcc crystal is unstable 29. However, it has been suggested that precritical nuclei are formed in the bcc arrangement 30: in our case, the oscillatory protocol appears to allow such nuclei to grow and become stable at steady state.
The transformation from fcc to bcc for occurs with very limited amorphization: the rearrangement of the crystalline defects is sufficient to cause the change in crystalline symmetry. However, for larger and in particular for we observe partial re-crystallization of the system: as depicted in Fig.4(b) the initial fcc crystal is initially turned into a largely amorphous packing in a few cycles. However, bcc crystal nucleation and growth occurs in the following cycles so that the system attains a largely re-crystallized NESS. Hence, amorphization and bcc-nucleation are competing processes for . In such a regime, the time to attain an amorphous steady state is longer than the nucleation time for the bcc crystal : this means that the fcc-order to disorder transition is mediated by an intermediate family of nonequilibrium bcc steady states.
3.3 Two-component Lennard-Jones crystal
The results on the single-component Lennard-Jones crystal motivate us to consider a system less prone to re-crystallization. Previous studies on glass-forming systems have shown that a non-additive 2:1 mixture of large and small Lennard-Jones particles is highly stable to crystallization 14, probably due, firstly, to the vicinity of its stoichiometry to the eutectic point of the mixture 31 and secondly to the fact that binary crystals fail differently under shear compared to one-component crystals 32. The mixture crystallizes into the arrangement, whose unit cell is characterized by spindles of small particles surrounded by square rings of large particles, forming a bicapped square antiprism 33. In fact, this is the same symmetry of recurrent geometrical motifs (also called locally favoured structures) in the liquid and supercooled liquid states of the same model, which play an important role in the emergence of slow relaxation within the glassy state 22, 23, 34. It has been shown that the number of particles involved in such motifs can be large in the liquid at low temperature without any sign of spontaneous crystal formation 14. We therefore expect that a large enough deformation of an equilibrated configuration in the crystalline arrangement of the model would lead to a substantial amorphization of the material which would be irreversible, with no secondary nucleation processes.
We monitor for this purpose the specific crystalline order of the binary crystal employing Voronoi face analysis (in which the antiprism can be detected with the [0,2,8] signature) as well as the Topological Cluster Classification method 19. We have seen that in the two-dimensional case the increase of disorder is gradual in time, while in the three-dimensional one-component LJ this is mediated by the nucleation of a bcc phase within the original fcc phase. In the case of the BLJ crystal (for a choice of period in Lennard-Jones time units with respect to the large particles) we directly observe the formation of disordered pockets, without the interference of intermediate crystal formation. The time evolution of the fraction of particles in antiprisms, Fig. 5(a), shows that when the shear amplitude is small (), the system remains ordered for several hundreds of cycles before rapidly and irreversibly falling into the amorphous state.
In Fig. 5(b) we plot the steady state value of the fraction of particles in an antiprism for several values of the temperature. As expected, the transition from a non-flowing to a flowing regime is very sharp with no further crystallisation beyond a characteristic value of . We also emphasize that higher temperatures correspond to slightly smaller steady state populations of antiprisms, both in the non-flowing and in the flowing dynamical phase.
As suggested by Fig. 5(a) the relaxation time at which the irreversible plastic event occurs increases as . In Fig. 5(c) and (d) we show two different scalings of this relaxation times: inspired by the estimate with proposed in 5 for the nucleation of amorphous patches in the limit of small stresses (where is a material specific constant and in the original calculations in three dimensions) we explored a scaling finding that only would account for our data, Fig. 5(c). However, if for the steady states are truly irreversible, then , so we also model the singularity at with a critical power law scaling, obtaining an equally good collapse of the data, see Fig. 5(d), with with .
4 Analogy to spinodal decomposition in the 3D binary LJ crystal
The 3D binary crystal presents a clear transition at a specific value of the strain amplitude and the timescales appear to diverge in a fashion compatible with scale-free, power law scaling. This suggests the possibility that the transition is dominated by a barrier-less process akin to spinodal decomposition, with the timescales for the transition from the reversible solid NESS to the irreversible amorphous NESS being controlled by the coarseing of the amorphous regions.
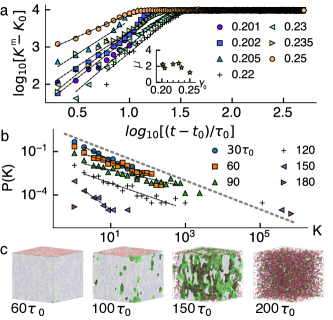
To test this, we further investigate the scaling behaviour measuring the growth of amorphous patches within the crystal in large simulations of up to particles. We identify connected regions without antiprisms and measure the number of particles in each cluster. In Fig. 6 (a) we show how the largest value increase as time evolves for different observing that before reaching a plateau value once the system turns amorphous, with the exponent reaching for the smallest for which we still observe amorphization. If we assume that the cluster length is approximately we have with the dynamical exponent to be compared with and of Model A (e.g. Ising) and model B (e.g. Cahn-Hilliard model for spinodal decomposition) respectively 35. At the same time, the probability distribution of the cluster sizes appears to be inherently scale-free, as shown in Fig. 6 (b) for the case of at , where, for the largest accessible system, we measure until one full relaxation time. The spatial distribution of clusters corresponds to a branched network of amorphous regions across the system, as pictorially illustrated in the snapshots in Fig. 6 (c), where the amorphous domains appear to span across the length of the system. The growth pattern of the amorphous network is reminiscent of coarsening or spinodal decomposition, occurring in other protocols of fast energy injection, such as superheating phenomena 36.
As a second test for a spinodal-like scenario, we consider the seeding of amorphous regions within the solid. In analogy to studies of crystal nucleation in metastable liquids 37, we probe whether the sharp transition in the binary Lennard-Jones mixture follows a nucleation/growth scenario through the seeding of disordered regions within the crystalline state.
We consider a system of particles at low temperature and a strain amplitude of , 10% larger than the estimated critical strain . In such conditions, we know that the relaxation from the crystal to the liquid occurs on timescales of the order of (see Fig. 3(d) in the main text).
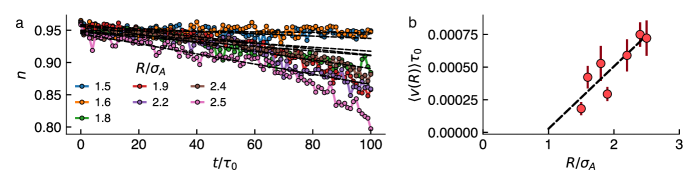
We first prepare a crystalline arrangement of particles through the equilibration procedure described in Sec. 2. We then identify particles outside a given radius from the origin of the reference frame and freeze their positions. For the particles within the radius we reassign their velocities, randomly selected them from a Maxwell-Boltzmann distribution, so that their kinetic temperature is and solve the equation fo motion (with frozen external particles and with no shear) for a time of approximately 100. At such high temperatures the particles can cross each other more easily and the spherical region becomes disordered. Following this route we prepare 10-30 initial configurations from which we start oscillatory shear simulations. We track the number of particles in crystalline motifs and the relative fraction over time and obtain single-run curves as in Fig. 7(a). We define the growth speed
| (6) |
and numerically evaluate it through a linear fit at early times. Averaging over several realizations, we obtain as a function of the radius of the disordered seed, see Fig. 7(b). We observe that we only measure positive growth speeds and that a linear fit through the data points only for . Such a small size for the initial seed can hardly be called a nucleus. See video in the Supplementary Information for an example trajectory.
From the seeded nucleation analysis we infer that amorphous nuclei of very small sizes appear to lead to the irreversible transition from the ordered to the amorphous oscillatory steady state. We interpret this as a further indication in support of a spinodal-like instability scenario.
5 Conclusions
Under the action of an oscillatory external driving, atomistic models of ordered states in two and three dimensions undergo a novel nonequilibrium dynamical transition between a non-flowing, ordered phase and a flowing amorphous phase. This – originally only conjectured – dynamical transition is revealed to have a very rich phenomenology: in 2D, it appears merely as a broad crossover between a disordered state with residual orientational order and an ordered hexagonal phase; in 3D, it corresponds to a sharp transition that can be masked by the nucleation of ordered phases with symmetries different from the ones of the unperturbed solid (i.e. bcc instead of fcc); moreover, with a suitable choice of the ordered phase, as in the case of the binary Lennard-Jones crystal, the 3D transition occurs abruptly in a narrow range of shear amplitudes with a scaling of the time required to relax to the amorphous state which is compatible with power-law, critical scaling.
The sharpest transition is therefore observed in the case of the two-component system with non-additive Lennard-Jones interactions, which prevent recrystallization across the dynamical transition. In the case of this particular system, the numerical results suggest that – even for small systems – one can define a critical strain amplitude at which amorphous pockets are formed and start growing irreversibly, in a process akin to coarsening. The relatively high density of amorphous pockets, their structure and growth are reminiscent of spinodal decomposition as opposed to a nucleation scenario, which is confirmed by the study of the spontaneous growth of very small seeded amorphous regions within the ordered phase. Coarsening of the emergent disordered phase appears to play a role as important as the nucleation-based description described in Ref.5, which dominates the onset of flow in the small strain limit.
The phenomenology presented here can be tested in experiments, for example with colloidal crystals in shear cells, both in two and three dimensions. Further theoretical study will focus on the possible implications of the present dynamical transitions for amorphous solids such as glasses and gels, where critical behaviour is believed to play an important role in the emergence of rigidity 38, 39, 40.
The authors would like to thank T. Speck, J. Lam, C. Valeriani, N. Wilding and R. L. Jack for insightful discussions. This work was carried out using the computational facilities of the Advanced Computing Research Centre, University of Bristol. FT acknowledges the support of the European Research Council under the FP7/ERC Grant agreement n∘617266 NANOPRS.
References
- Seeger 1955 A. Seeger, The London, Edinburgh, and Dublin Philosophical Magazine and Journal of Science, 1955, 46, 1194–1217.
- Rice and Thomson 1974 J. R. Rice and R. Thomson, Philosophical magazine, 1974, 29, 73–97.
- Ruelle 1999 D. Ruelle, Statistical mechanics: Rigorous results, World Scientific, 1999.
- Lebowitz 1968 J. L. Lebowitz, Annual Review of Physical Chemistry, 1968, 19, 389–418.
- Sausset et al. 2010 F. Sausset, G. Biroli and J. Kurchan, Journal of Statistical Physics, 2010, 140, 718–727.
- Nath et al. 2018 P. Nath, S. Ganguly, J. Horbach, P. Sollich, S. Karmakar and S. Sengupta, Proceedings of the National Academy of Sciences, 2018, 115, E4322–E4329.
- Pyragas et al. 2000 K. Pyragas, F. Lange, T. Letz, J. Parisi and A. Kittel, Physical Review E, 2000, 63, 016204.
- Corté et al. 2008 L. Corté, P. M. Chaikin, J. P. Gollub and D. J. Pine, Nat Phys, 2008, 4, 420–424.
- Stevens et al. 1991 M. J. Stevens, M. O. Robbins and J. F. Belak, Physical review letters, 1991, 66, 3004.
- Stevens and Robbins 1993 M. J. Stevens and M. O. Robbins, Physical Review E, 1993, 48, 3778.
- Barker et al. 1981 J. Barker, D. Henderson and F. F. Abraham, Physica A: Statistical Mechanics and its Applications, 1981, 106, 226–238.
- Mastny and de Pablo 2007 E. A. Mastny and J. J. de Pablo, The Journal of chemical physics, 2007, 127, 104504.
- Kob and Andersen 1994 W. Kob and H. C. Andersen, Phys. Rev. Lett., 1994, 73, 1376–1379.
- Crowther et al. 2015 P. Crowther, F. Turci and C. P. Royall, The Journal of Chemical Physics, 2015, 143, 044503.
- Gribova et al. 2011 N. Gribova, A. Arnold, T. Schilling and C. Holm, The Journal of chemical physics, 2011, 135, 054514.
- Mastny and de Pablo 2007 E. A. Mastny and J. J. de Pablo, The Journal of Chemical Physics, 2007, 127, 104504.
- Bacher et al. 2014 A. K. Bacher, T. B. Schrøder and J. C. Dyre, Nature communications, 2014, 5, 5424.
- Stukowski 2012 A. Stukowski, Modelling and Simulation in Materials Science and Engineering, 2012, 20, 045021.
- Malins et al. 2013 A. Malins, S. R. Williams, J. Eggers and C. P. Royall, The Journal of Chemical Physics, 2013, 139, 234506.
- Lazar 2017 E. A. Lazar, Modelling and Simulation in Materials Science and Engineering, 2017, 26, 015011.
- Fernández and Harrowell 2003 J. Fernández and P. Harrowell, Phys. Rev. E, 2003, 67, 011403.
- Coslovich and Pastore 2007 D. Coslovich and G. Pastore, The Journal of chemical physics, 2007, 127, 124504.
- Malins et al. 2013 A. Malins, J. Eggers, H. Tanaka and C. P. Royall, Faraday discussions, 2013, 167, 405–423.
- Plimpton 1995 S. Plimpton, Journal of computational physics, 1995, 117, 1–19.
- Wierschem and Manousakis 2011 K. Wierschem and E. Manousakis, Physical Review B, 2011, 83, 214108.
- Patashinski et al. 2010 A. Z. Patashinski, R. Orlik, A. C. Mitus, B. A. Grzybowski and M. A. Ratner, The Journal of Physical Chemistry C, 2010, 114, 20749–20755.
- Stukowski 2009 A. Stukowski, Modelling and Simulation in Materials Science and Engineering, 2009, 18, 015012.
- Macmillan and Kelly 1972 N. Macmillan and A. Kelly, Proc. R. Soc. Lond. A, 1972, 330, 291–308.
- Travesset 2014 A. Travesset, The Journal of chemical physics, 2014, 141, 164501.
- Rein ten Wolde et al. 1996 P. Rein ten Wolde, M. J. Ruiz-Montero and D. Frenkel, The Journal of chemical physics, 1996, 104, 9932–9947.
- Pedersen et al. 2018 U. R. Pedersen, T. B. Schrøder and J. C. Dyre, Physical review letters, 2018, 120, 165501.
- Horn and Löwen 2014 T. Horn and H. Löwen, The Journal of chemical physics, 2014, 141, 224505.
- Fernández and Harrowell 2003 J. R. Fernández and P. Harrowell, Physical Review E, 2003, 67, 011403.
- Turci et al. 2017 F. Turci, C. P. Royall and T. Speck, Physical Review X, 2017, 7, 031028.
- Hohenberg and Halperin 1977 P. C. Hohenberg and B. I. Halperin, Reviews of Modern Physics, 1977, 49, 435.
- Belonoshko et al. 2007 A. Belonoshko, S. Davis, N. V. Skorodumova, P.-H. Lundow, A. Rosengren and B. Johansson, Physical Review B, 2007, 76, 064121.
- Espinosa et al. 2016 J. R. Espinosa, C. Vega, C. Valeriani and E. Sanz, The Journal of Chemical Physics, 2016, 144, 034501.
- Jaiswal et al. 2016 P. K. Jaiswal, I. Procaccia, C. Rainone and M. Singh, Physical review letters, 2016, 116, 085501.
- Parisi et al. 2017 G. Parisi, I. Procaccia, C. Rainone and M. Singh, Proceedings of the National Academy of Sciences, 2017, 114, 5577–5582.
- Ozawa et al. 2018 M. Ozawa, L. Berthier, G. Biroli, A. Rosso and G. Tarjus, Proceedings of the National Academy of Sciences, 2018, 201806156.