Radial velocity and chemical composition of evolved stars in the open clusters NGC 6940 and Tombaugh 5
Abstract
We present and discuss medium resolution (R 13000), high signal-to-noise (), spectroscopic observations in the field of the open clusters NGC 6940 and Tombaugh 5. Spectra were recorded for seven candidate red giant stars in both clusters. For the latter we present the very first chemical abundance analysis. We derive radial velocities for all the stars in NGC 6940, confirming membership to the cluster for all of them, while on the same ground we exclude two stars in To 5. We perform a chemical abundance analysis of different atomic species, in particular FeI, SiI, CaI, TiI and NiI. The mean metallicity of NGC 6940 is [Fe/H]=+0.090.06 dex, in good agreement with previous works, while for To 5 is [Fe/H]=+0.060.11 dex. Therefore, both clusters exhibit a chemical composition close to the solar value, and do not deviate from the [Fe/H] Galactic radial abundance gradient. With these new values we estimate the fundamental cluster parameters, after having derived clusters’ distances from the Gaia DR2 database. By adopting these distances, we derive updated estimated for the clusters ages: 1.00.1 Gyr of NGC 6940 and 0.250.05 Gyr for Tombaugh 5.
1 Introduction
This paper continues a series started in Carraro et al. 2016 that aims at expanding the current sample of Galactic disk intermediate age and old open clusters for which good metallicity and abundance ratios measurements are available. As for the Open Cluster Chemical Abundances from Spanish Observatories survey (OCCASO) (Casamiquela et al. 2016) we are targeting clusters in the northern hemisphere, which are out of reach of the Gaia-ESO Spectroscopic Public Survey (Gilmore et al. 2012). In Carraro et al. 2016 we presented the first abundance study of NGC 7762, a nearby old open cluster. Here we focus on two open clusters which are located at larger distance from the Sun, toward the anti-centre direction: NGC 6940 and Tombaugh 5 (hereafter To 5).
We aim at finding and characterising open clusters in the Galacto-centric distance range (10-12 kpc) at which the Galactic radial abundance gradient has an abrupt change of slope (Twarog et al 1997, Sales Silva et al. 2015), and keeps flat outwards. In this way, we can expand the sample of fully characterised open clusters observable in the Northern hemisphere and improve the observational constraints of chemical evolution models.
In this work, we present a spectroscopic investigation of the open clusters NGC 6940 and To 5. For the latter no radial velocity and chemical abundance analysis have been performed to date, while for the former abundances were available for a few stars only at the time of the observing proposal preparation.
In addition, a literature scan indicates discrepant values
for To 5 basic parameters (especially distance).
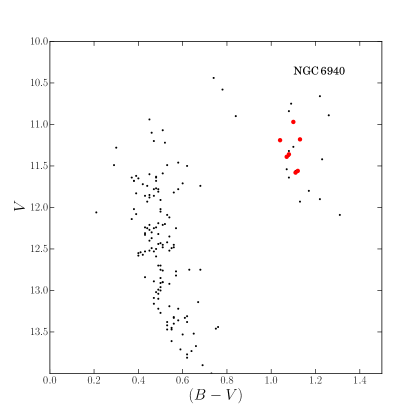
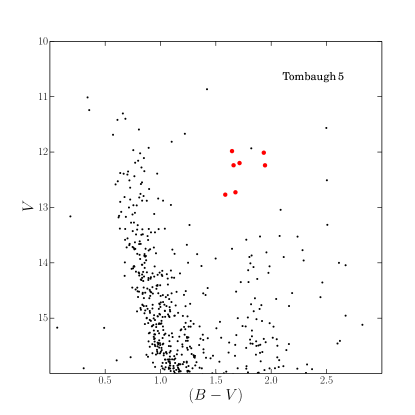
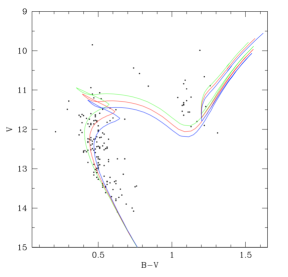
We secured spectra for seven stars in both clusters, close to the expected location of red clump stars. We derived radial velocities and metallicities, as well as abundances ratios of and iron-peak elements. The selected stars are shown in the colour magnitude diagrams (CMD) in Fig.1 (highlighted in red) and their properties are summarised in Tab.1.
The paper is organised as follows: in Sect. 2 we present a brief summary of previous studies on NGC 6940 and To 5, while in Sect.3 we present the observational material and the basic reduction strategy. Sect.4 is devoted to radial velocities measurements, while in Sect.5 we present the estimates of the stellar atmospheric parameters. The abundance analysis is presented in Sect.6 and Sect.7. Moreover, in Sect.8 we derive updated estimates of the clusters’ fundamental parameters. Finally, Sect.9 provides some discussion and summarises our findings.
| ID | RA(J2000.0) | Dec(J2000.0) | V | B-V | J | H | K | (sec) | |
|---|---|---|---|---|---|---|---|---|---|
| NGC 6940 | |||||||||
| 28 | 20:33:25.0 | +28:00:46.9 | 11.56 | +1.12 | 9.565 | 9.049 | 8.929 | 2400 | 68 |
| 60 | 20:33:59.6 | +28:03:01.7 | 11.56 | +1.11 | 9.593 | 9.103 | 8.974 | 2400 | 92 |
| 67 | 20:34:04.1 | +28:16:48.6 | 11.18 | +1.13 | 9.134 | 8.608 | 8.518 | 2000 | 135 |
| 108 | 20:34:25.6 | +28:13:41.5 | 11.19 | +1.04 | 9.275 | 8.857 | 8.696 | 2000 | 110 |
| 130 | 20:34:38.7 | +28:20:22.7 | 11.39 | +1.07 | 9.453 | 8.966 | 8.853 | 2400 | 103 |
| 132 | 20:34:40.1 | +28:26:38.9 | 10.97 | +1.10 | 9.039 | 8.491 | 8.391 | 1800 | 125 |
| 139 | 20:34:47.6 | +28:14:47.3 | 11.38 | +1.08 | 9.464 | 8.942 | 8.804 | 2000 | 94 |
| To 5 | |||||||||
| 0006 | 03:48:17.46 | +59:11:19.68 | 12.198 | 1.714 | 8.888 | 8.222 | 7.960 | 2700 | 118 |
| 5274 | 03:46:55.60 | +58:55:34.79 | 11.982 | 1.646 | 8.993 | 8.360 | 8.171 | 2700 | 139 |
| 5521 | 03:48:47.41 | +59:02:28.18 | 12.238 | 1.660 | 9.231 | 8.483 | 8.279 | 2700 | 165 |
| 7701 | 03:47:30.98 | +59:02:50.89 | 12.011 | 1.933 | 8.531 | 7.797 | 7.581 | 2700 | 111 |
| 7834 | 03:47:49.92 | +58:56:20.84 | 12.769 | 1.585 | 9.624 | 9.015 | 8.782 | 3600 | 105 |
| 8080 | 03:48:29.20 | +59:00:36.68 | 12.726 | 1.677 | 9.628 | 8.969 | 8.752 | 3600 | 86 |
| 8099 | 03:48:32.98 | +59:15:16.63 | 12.239 | 1.944 | 8.651 | 7.936 | 7.699 | 2300 | 76 |
2 Overview of the literature on NGC 6940 and Tombaugh 5
2.1 NGC 6940
NGC 6940 is a rather well-known intermediate-age open cluster (see Tab.2).
The first membership assessment was conducted by Vasilevskis & Rach (1957), who identified 216 possible members using proper motions. Later, Sanders (1972) confirmed the membership of 104 stars, implementing a new procedure based on the maximum likelihood method.
The first extensive photometric study was conducted by Larsson-Leander (1964), who cross-correlated several previous studies and confirmed the estimates by Walker (1958) and Johnson et al. (1961) of the apparent distance modulus ((m-M)V=9.5 mag) and the reddening (E(B-V)=0.26, both of which
were later confirmed by Hartwick & McClure (1972)). Jennens & Helfer (1975) derived the very first age estimate of the cluster assuming previous estimates of distance modulus and reddening, and finding an age of 500 Myr.
The first detailed spectroscopic study was conducted by Geyer & Nelles (1985) who derived radial velocities of 31 member stars, one of which is included in our sample. Geisler (1988) confirmed those estimates and determined a mean radial velocity of the cluster of 5.71.5 km/s. Mermilliod & Mayor (1989) analyzed high-resolution spectra of member stars in different open clusters, among which NGC 6940, confirming the existence in that region of at least six spectroscopic binaries, among which our #130. Later, Mermilliod et al. (2008) analysed 26 possible red giants stars, confirming 21 of them and deriving a mean cluster radial velocity of 7.890.14 km/s.
We used all these works to compare our radial velocity measurements, as reported in Tab.3.
As for spectroscopic metallicity, the first study was conducted by Thogersen et al. (1993), who analyzed medium-resolution spectra of six red clump stars, confirming the previous estimates of the radial velocity and deriving a metallicity of -0.060.13 dex. Among the most recent studies on metallicity of NGC 6940,
Blanco-Cuaresma et al. (2015) and Bcek-Topcu et al. (2016) conducted a very detailed high-resolution spectroscopic study, obtaining values of the metallicity very similar, of respectively +0.040.09 dex (1 star) and +0.040.02 dex (12 stars). Reddy et al. (2016) confirmed their measurements for three stars. We decided to observe NGC 6940 since
at the time of our proposal preparation only Reddy et al.(2016) and
Blanco-Cuaresma et al. (2015) studies were available.
| Cluster | l | b | E(B-V) | m⋆ | |
|---|---|---|---|---|---|
| (∘) | (∘) | (M⊙) | |||
| NGC 6940 | 69.860 | -7.147 | 0.21 | 10.10 | 2.05 |
| To 5 | 143.942 | 3.573 | 0.80 | 13.70 | 3.50 |
2.2 Tombaugh 5
Unlike NGC 6940, To 5 is a poorly known star cluster, and its fundamental parameters are still unsettled.
It was discovered by Tombaugh (1941), who provided the first estimate of the angular diameter of 17 arcmin.
Only photometric analyses are available for it.
There is a general agreement on the cluster age ( 200-250 Myr )
and color excess E(B-V) (0.80 mag, Lata et al.(2004), Maciejewski & Niedzielski (2007), Majaess, Turner & Lane (2008), Zdanavicius et al.(2011)).
On the other hand, distance estimates crowd around two marginally discrepant values.
According to Lata et al.(2004) BV study, the apparent distance modulus is around 13.7 mag (which implies a heliocentric distance of 1.7 kpc). This estimate was later confirmed by Zdanavicius et al.(2011), who re-estimated the basic cluster parameters using photometric data in the Vilnius system.
Maciejewski & Niedzielski (2007) argue that Lata et al.(2004) CMD was highly contaminated by field stars. By selecting the cluster putative members in a statistical way, they obtained an apparent distance modulus of 13.10 mag (which corresponds to a value of d1.3 kpc) using BV photometry as well. This value was later confirmed by Kharchenko et al. (2013) via an
automated fit of 2MASS photometry.
A more careful analysis of the 2MASS CMD from Majaess, Turner & Lane (2008) yields a distance of 1.7 kpc.
No spectroscopic study is available to our knowledge. An estimate of the cluster metallicity, together with the recently released Gaia DR2111This work has made use of data from the European Space Agency (ESA) mission
Gaia (https://www.cosmos.esa.int/gaia), processed by the Gaia
Data Processing and Analysis Consortium (DPAC,
https://www.cosmos.esa.int/web/gaia/dpac/consortium). Funding for the DPAC
has been provided by national institutions, in particular the institutions
participating in the Gaia Multilateral Agreement. (Gaia Collaboration et al. 2016; Gaia Collaboration et al. 2018) astrometric and photometric data, should help to alleviate the aforementioned distance discrepancy.
| ID | |||||||
|---|---|---|---|---|---|---|---|
| (km/s) | (km/s) | (km/s) | (km/s) | (km/s) | (km/s) | (km/s) | |
| 28 | 6.471.90 | - | 3.23.2 | 8.120.28 | - | 7.990.16 | 8.900.08 |
| 60 | 8.411.30 | 292.1 | - | 7.240.28 | - | 7.270.18 | 7.660.08 |
| 67 | 8.380.47 | - | 10.63.5 | 7.670.21 | 7 | 7.690.19 | - |
| 108 | 6.910.21 | - | 3.82.2 | 6.990.19 | - | 6.760.13 | 7.390.09 |
| 130 | 6.491.30 | - | - | 7.330.20 | - | 7.250.18 | - |
| 132 | 8.870.19 | - | - | 7.270.22 | - | 7.170.14 | 7.760.15 |
| 139 | 6.571.20 | - | - | 7.420.26 | 10 | 7.120.16 | 7.530.08 |
3 Observation and Data Reduction
We observed NGC 6940 and To 5 stars with the Main Stellar Spectrograph (MSS)222www.sao.ru/hq/lizm/mss/en/index.html of the 6 meter telescope BTA (Big Telescope Alt-azimuth) at the Special Astrophysical Observatory in Nizhny Arkhyz, Russia. This instrument is installed in the Nasmyth-2 focus of the telescope. It is essentially a long-slit spectrograph, which in its standard mode is equipped with a differential circular polarization analyser, and combined with a double image slicer designed by Chountonov (2004) and a rotating l/4 phase plate, to study mainly stellar magnetic fields. For the purpose of our observations, the instrument was set-up in its basic long slit mode. In this set-up, the MSS instrument allows to cover the wavelength range 58406690Å with a resolution of 13000 .
Observations were carried out on the nights of September 7 and 8, 2017. The nights were clear and stable, with typical seeing in the range 1.53.0 arcsecs.
Beside the spectra of scientific targets, we collected bias and dome flat frames (two sets of 10 images obtained at the beginning and at the end of the night) and a set of ThAr spectra, for wavelength calibration purposes.
Spectra were reduced in a standard way, which consists of the following steps: 1) construction of the master bias and subtraction of it from the scientific and calibration frames, 2) correction of data for stray light, 3) searching for the location of individual slices in 2D images, 4) extraction of 1D spectra, 5) continuum normalisation of the spectra, 6) correction of wavelengths for the Earth’s motion. All these procedures were carried out within ESO-MIDAS package and its Zeeman extension. Spectra were normalized by the continuum level using the task continuum within the IRAF package333IRAF is distributed by the National
Optical Astronomy Observatory, which is operated by the Association of
Universities for Research in Astronomy, Inc., under cooperative agreement
with the National Science Foundation. Wavelength solution was defined using the arc spectrum obtained closest in time to the scientific exposures.
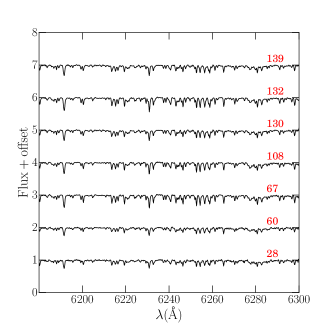
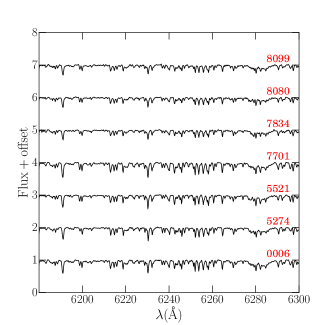
An excerpt of the stars spectra is shown in Fig.2.
4 Radial velocities
Radial velocities were measured using the task fxcor of IRAF, which performs a Fourier cross-correlation between the observed spectra and a synthetic one. We chose a synthetic spectrum of a typical giant star with solar metallicity and more or less the same resolution (Teff=4750 K, log(g)=2.25 dex, =2 km/s and R12000) (Munari et al. 2005). The typical errors given by the task is of the order of 1.0 km/s.
In Tab.3 and 4 the velocity measurements are reported for NGC 6940 and To 5, respectively. In the tables we reported also the values found in literature for a comparison. For all the other stars, our measurements are all in good agreement with the previous studies.
In the case of To 5 stars, there are no previous sprectroscopic studies to compare our measurements with. However, two of them (#5274 and #8099) seem to be field stars. According to Zdanaviius et al.(2011), in the cluster region there are seven possible red giant candidates: five of them are in common with the ones we observed, except for #5274 and #8099. So we decided to exclude them from the chemical abundances analysis.
The mean radial velocities for the two clusters are Vr,NGC6940=8.00.2 km/s, in good agreement with the values found in literature, and Vr,To5=-22.80.4 km/s.
| ID | |
|---|---|
| (km/s) | |
| 0006 | -22.90.7 |
| 5274 | -16.00.7 |
| 5521 | -23.31.3 |
| 7701 | -23.30.6 |
| 7834 | -20.91.1 |
| 8080 | -21.21.8 |
| 8099 | -18.72.5 |
| ID | T(B-V) | T(V-K) | ||||||
| (K) | (K) | (K) | (dex) | (km/s) | (K) | (dex) | (km/s) | |
| NGC 6940 | ||||||||
| 28 | 4996 | 5068 | 5032 | 2.81 | 1.32 | 4980 | 2.91 | 1.32 |
| 60 | 5017 | 5096 | 5057 | 2.83 | 1.31 | 5057 | 2.85 | 1.31 |
| 67 | 4975 | 5034 | 5005 | 2.65 | 1.37 | 5005 | 2.55 | 1.37 |
| 108 | 5171 | 5225 | 5198 | 2.75 | 1.33 | 5100 | 2.70 | 1.33 |
| 130 | 5104 | 5175 | 5140 | 2.80 | 1.32 | 5140 | 2.80 | 1.32 |
| 132 | 5017 | 5127 | 5072 | 2.59 | 1.39 | 5000 | 2.70 | 1.39 |
| 139 | 5082 | 5153 | 5118 | 2.77 | 1.39 | 4980 | 2.95 | 1.39 |
| To 5 | ||||||||
| 0006 | 4979 | 5068 | 5024 | 2.36 | 1.46 | 5024 | 3.00 | 1.46 |
| 5521 | 5095 | 5398 | 5247 | 2.43 | 1.44 | 5150 | 3.40 | 1.44 |
| 7701 | 4558 | 4863 | 4711 | 2.05 | 1.56 | 4710 | 2.10 | 1.56 |
| 7834 | 5266 | 5363 | 5315 | 2.72 | 1.35 | 5215 | 2.80 | 1.35 |
| 8080 | 5058 | 5380 | 5219 | 2.61 | 1.38 | 5220 | 3.40 | 1.38 |
5 Atmospheric parameters
Atmospheric parameters were obtained as follows.
First, Teff,phot estimates were derived from the B-V and V-K colours using the relations by Alonso et al. (1999). In the chemical abundances analysis we used the mean temperature between T(B-V) and T(V-K) as input.
Surface gravities (log(g)) were obtained from the canonical equation:
where Teff,⊙=5777 K, log(g)⊙=4.44 dex, MBC,⊙=4.74.
The bolometric correction (BCV) for each star was derived by adopting the relations
from Alonso et al. (1999).
We adopted initial values for reddening E(B-V) and apparent distance modulus , from WEBDA, and inferred stellar masses (m⋆) from the Padova suite of isochrones (Marigo et al. 2017). The values used for each cluster are reported in Tab. 2.
Micro-turbulent velocity () was obtained from the
relation by Gratton et al. (1996):
= 2.22 - 0.322log(g)
The input metallicity needed to obtain Teff,phot from colors and for the
isochrone fitting was assumed to be solar, which was later confirmed by the spectroscopic analysis (see below). The derived atmospheric parameters are listed in Tab.5.
6 Elemental abundances
| ID | [Si/Fe] | [Ca/Fe] | [Ti/Fe] | [Ni/Fe] |
|---|---|---|---|---|
| NGC 6940 | ||||
| 28 | 0.180.08 0.17 | 0.090.35 0.04 | -0.130.24 0.11 | -0.010.17 0.05 |
| 60 | -0.020.05 0.15 | -0.070.340.03 | -0.110.190.10 | -0.20.180.14 |
| 67 | 0.070.040.18 | 0.190.090.12 | 0.030.130.09 | -0.10.090.05 |
| 108 | 0.140.070.16 | 0.070.120.01 | 0.040.140.10 | 0.140.110.05 |
| 130 | 0.130.060.14 | 0.090.10.02 | 0.040.130.09 | 0.230.090.03 |
| 132 | 0.20.050.16 | 0.080.040.02 | 0.060.070.11 | 0.040.060.04 |
| 139 | 0.120.140.16 | -0.150.180.04 | -0.220.10.14 | -0.030.070.05 |
| To 5 | ||||
| 0006 | 0.13 0.13 0.15 | 0.04 0.03 0.05 | -0.02 0.09 0.12 | 0.05 0.14 0.04 |
| 5521 | 0.10 0.03 0.15 | 0.16 0.17 0.04 | 0.13 0.05 0.11 | -0.03 0.05 0.03 |
| 7701 | 0.04 0.07 0.18 | -0.07 0.02 0.08 | -0.09 0.12 0.11 | 0.08 0.12 0.09 |
| 7834 | -0.17 0.04 0.19 | 0.12 0.11 0.03 | 0.10 0.16 0.06 | 0.01 0.19 0.05 |
| 8080 | 0.00 0.10 0.15 | -0.09 0.12 0.07 | 0.04 0.18 0.08 | -0.04 0.04 0.03 |
| ID | [Fe/H] |
|---|---|
| NGC 6940 | |
| 28 | -0.02 0.04 0.17 |
| 60 | 0.11 0.05 0.16 |
| 67 | 0.15 0.03 0.2 |
| 108 | 0.05 0.04 0.18 |
| 130 | 0.04 0.04 0.16 |
| 132 | 0.18 0.03 0.18 |
| 139 | 0.10 0.06 0.16 |
| To 5 | |
| 0006 | 0.11 0.04 0.16 |
| 5521 | -0.05 0.04 0.16 |
| 7701 | 0.21 0.05 0.2 |
| 7834 | -0.04 0.06 0.2 |
| 8080 | 0.06 0.11 0.18 |
To derive the spectroscopic atmospheric parameters and chemical abundances of the stars confirmed members, we used the local thermodynamic equilibrium (LTE) line analysis and synthetic spectrum code MOOG (Sneden 1973, Soebeck et al 2011 444https://www.as.utexas.edu/ chris/moog.html.
We used 1D model atmospheres linearly interpolated from the ATLAS9 model atmosphere grid of Castelli & Kurucz (2004).
Si I, Ca I, Ti I, Fe I, Fe II and Ni I abundances were estimated using the equivalent width (EQW) method by running the abfind driver of MOOG. EQWs for a selected line list were measured manually using the task splot in IRAF. The line list comes from D’Orazi et al. 2017. We kept only lines which are isolated and unblended, fitting a gaussian profile and/or by direct integration, depending on the feature under consideration. We considered only lines with EQWs150 mÅ.
The final temperatures were derived by removing the trend between the iron abundances (log(Fe I)) of the single lines and the excitational potential (). We changed the temperature until the slope of the trend was compatible with a flat trend within 1. In most cases, the input values were close to the final ones, so no changes were applied to the temperatures. As for the final value of the surface gravity, we checked the difference between log(Fe I) and log(Fe II) and changed it until it reached a value below 0.05 dex. As for micro-turbolence velocities, we did not change the input value since the numbers of Fe I lines were not sufficient to calculate a meaningful linear trend between the abundances and the reduced equivalent widths (REWs). The final metallicity were computed with respect to the solar value and reported in Tab.7.
We calculated also the abundances of all the others elements and then the abundance ratios with respect to Fe I. The final values are reported in Tab.6.
In order to estimate the uncertainties of the metallicities and abundance ratios, we considered mainly errors due to EQWs measurements and to internal uncertainties of the stellar parameters, defined as and in Tab.7.
The first source of error is well represented by the standard deviation from the mean abundances considering all the lines divided by the root square of the number of lines. The values derived for [X/Fe] (reported in Tab.6) were calculated by quadratically adding the value of [Fe/H] and the one of [X/H].
The values were estimated by varying Teff by 150 K, log(g) by 0.2 dex and by 0.3 dex. For each new model, we calculated the difference between the new [X/Fe] and that obtained with the final parameters. Then we added all the contributions quadratically.
7 Results of the chemical analysis
The final values of the atmospheric parameters and the individual abundances are reported in Tabs. 5 and 6. In order to evaluate the validity of our method, we checked the correlation between the derived metallicities and the atmospheric parameters. Overall we could not find any evident trend.
In the case of NGC 6940, we could compare our results with the values derived by Bcek Topcu et al.(2016) for five stars in common. The mean values of the cluster metallicities and abundances ratios are reported in Tab.8, in which we also reported the literature values for a comparison.
| ID | |||||
|---|---|---|---|---|---|
| NGC 6940 | 0.090.06 | 0.110.07 | 0.040.11 | -0.040.10 | 0.010.13 |
| Blanco-Cuaresma et al.(2015) | 0.040.09 | 0.130.13 | 0.030.09 | -0.01 0.13 | -0.050.10 |
| Bocek-Topcu (2016) | 0.040.02 | 0.120.06 | 0.080.04 | -0.040.04 | -0.010.02 |
| Reddy(2016) | -0.060.03 | 0.140.03 | 0.000.03 | -0.040.02 | 0.000.03 |
| To 5 | 0.060.11 | 0.020.11 | 0.030.10 | 0.030.08 | 0.010.05 |
7.1 NGC 6940
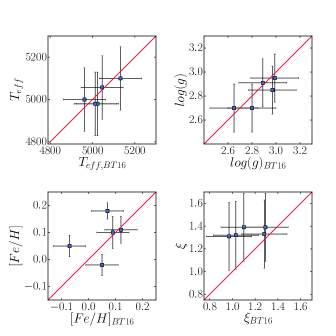
In Fig.3 (left panel) we show the comparison between the atmospheric parameters derived in this work (y-axis) and the values found by Bcek Topcu et al.(2016) (BT16, in x-axis). The agreement is quite good: each measurement is compatible with the authors’, except for the micro-turbulence velocities. We kept as valid the photometric estimates of these values, since we had too few lines to calculate the trend between the individual abundances and the reduced equivalent widths.
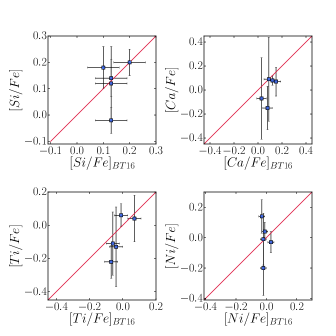
In the right panel of Fig.3, instead, we compared the abundance ratios. Some values we found are compatible with Bcek Topcu et al.(2016), but the dispersion of our measurements is larger. This can be explained with the lower resolution of our spectra and the limited spectral coverage. Moreover, most of the lines do not have a pure gaussian profile, so we measured the EQWs with other methods.
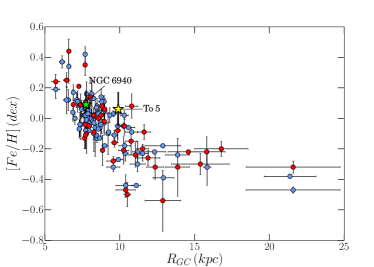
The mean value of metallicity and abundance ratios, as reported in Tab.8, are in very good agreement with the values found in literature. NGC 6940 has a nearly solar metallicity of +0.090.06 dex, consistent with the values expected for a cluster at that Galacto-centric distance, as Fig.4 shows. he Galacto-centric distance has bee computed adopting =8.5 kpc, for homogeneity with previous studies and for the sake of comparison.
7.2 To 5
Basing on previous estimates of the distance, this cluster appears to be quite interesting, since it would be located close to the critical Galacto-centric distance at which the radial abundance gradient for [Fe/H] exhibits a significant change of slope. For this cluster we provided the very first spectroscopic estimate of the photospheric parameters for all the sample stars but for 8080, for which we had to rely on the mean photometric estimates from the other sample stars. We derived for To 5 a roughly solar metallicity of +0.060.11 dex, which lies close to the upper envelope of the thin disk abundance gradient, but is still compatible with the other clusters located in the same Galacto-centric distance range, as shown in Fig.4.
8 Cluster basic parameters revisited
| ID | ||||
|---|---|---|---|---|
| NGC 6940 | ||||
| 67 | -1.7580.061 | -9.5140.046 | 1.0260.038 | 975 36 |
| 108 | -1.534 0.046 | -9.235 0.041 | 0.883 0.033 | 1132 42 |
| 130 | -2.178 0.049 | -9.182 0.047 | 0.934 0.035 | 1071 4 |
| 132 | -2.015 0.051 | -9.315 0.047 | 1.005 0.039 | 995 38 |
| 139 | -2.046 0.045 | -9.523 0.046 | 0.975 0.031 | 1026 33 |
| To 5 | ||||
| 0006 | -7.4780.862 | 1.5280.748 | -3.0610.497 | 32755 |
| 5521 | 0.2700.046 | 4.2330.042 | 0.9990.031 | 100031 |
| 7701 | 0.383 0.065 | -2.297 0.064 | 0.522 0.039 | 1917 145 |
| 7834 | -3.3680.048 | -0.9230.048 | 1.0070.031 | 99331 |
| 8080 | 23.8891.727 | -20.7521.632 | -1.1781.155 | 849130 |
In order to estimate the cluster basic parameters, we complement available photometric and spectroscopic data with the recent Gaia DR2 data.
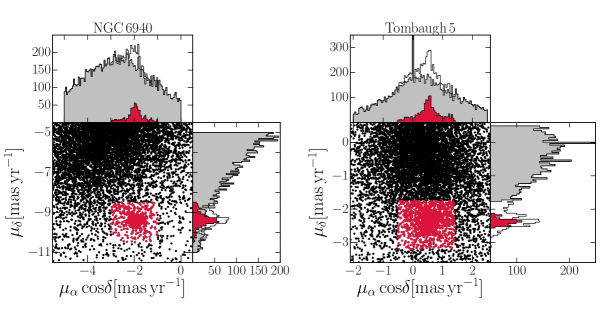
As in Fig. 5, we plotted proper motion (mas/yr) vs (mas/yr) and selected visually only the stars within the cluster radius. Then we calculated the distance from the parallax measured by Gaia only for the proper-motion-selected stars.
As one can appreciate from Fig. 5, the distributions have a gaussian profile around the mean value. To get a distance estimate we selected all the stars within 3 from the mean to include the largest number of candidate members. We note,
however, that two NGC 6940 stars observed by us are not included Gaia DR2 (namely #28 and #60), while the majority of the stars in the red clump of To 5 are missing, either because their distances are not within 3 from the mean (like #0006) or because they have peculiar proper motion (like #8080). All of them, however, are confirmed members according to radial velocities and metallicity.
The values of proper motion components, parallaxes, derived distances and the mean cluster values are reported in Tab.9.
A few recent studies have noted that the zero-point of Gaia DR2 parallaxes should probably be incremented by 0.05-0.08 mas (Stassun & Torres. 2018 , Zinn et al. 2018 . We will investigate this possibility for To5, for which distance is not yet well-constrained.
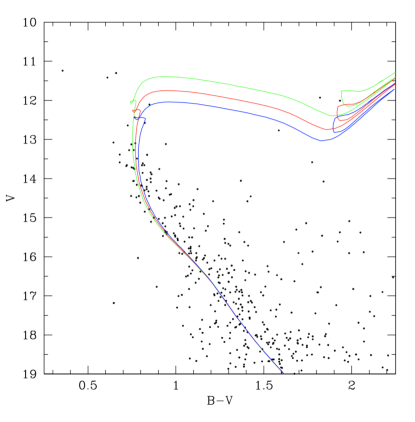
To provide an updated estimate of the clusters age, we super-imposed isochrones for different ages on top the CMD built with optical BV photometry as in Fig. 1. The isochrone fitting is performed
fixing the metallicity to the new value found in this work and the reddening to the value found in literature (see Fig.6 and 7 for NGC 6940 and To 5, respectively).
In the case of NGC 6940 the fit
yields an age of 1.00.1 Gyr (for a metallicity Z=0.0187) in nice agreement with Bcek Topcu et al. (2016)) adopting the Gaia distance estimate of 1.030.17 kpc , which is slightly higher than the values found in literature and reported in WEBDA. This corresponds to an apparent distance modulus of (m-M)V=10.720.36.
The distance estimate of To 5 reported in WEBDA database is confirmed by Gaia DR2, from which we derive an estimate of 1.70.1 kpc. If we apply an offset of 0.05 mas, the distance becomes 1.68, well within the error bars.
This was calculated using MS proper-motion-selected stars brighter than 16.0 in the Gaia passband , since for our sample of clump stars Gaia provides extremely different proper motion components and parallaxes. We do not have a clear explanation for this, since these stars have the same radial velocity and metallicity. Since To 5 field is severely contaminated by field stars, one possibility is that there are mismatches in Gaia DR2, which will probably be solved with future releases of the catalog. Another possibility is that these 5 stars have similar properties by chance, and they do not have anything to do with the cluster. We would exclude this scenario since their position in the cluster CMD is compatible with the expected locations of red, evolved stars in their He-burning phase. To better clarify this issue,
we run a few simulations with the Trilegal code (Girardi 2016), and found that for a single stellar populations (SSP) of the age nad estimated mass () of To5, the expected number of evolved stars is 43, well in agreement with available photometric data (see Fig 1).
Using this distance, our new estimate of metallicity (which corresponds to Z=0.0175), and the reddening estimate provided by Majaess et al. (2008) we derived a new age estimate using the isochrone fitting method, as shown in Fig. 7, where a CMD based on Maciejewski & Niedzielski (2007) has been plotted. We find that an age of 25050 Myr nicely fits the overall stars’ distribution, thus supporting earlier investigations. The Gaia DR2 distance of 1.7 kpc places To 5 in the close vicinity of the Perseus arm, as defined by the position of star forming regions in this Galactic sector derived from maser distances as in Reid et al. (2009).
9 Summary and Conclusions
In this work we presented a spectroscopic study of two open clusters: NGC 6940 and To 5. While the former was studied before, for the latter these are the first spectroscopic measurements to-date. Our findings can be summarised as follows:
-
•
We observed seven candidate red clump stars in the region of the two clusters. All the observed stars in NGC 6940 turn out to be cluster members. The cluster mean value is VNGC 6940=8.00.2 km/s. In the case of To 5, we could confirm the membership of five of the observed stars and the mean radial velocity is Vr,To5=-22.80.4 km/s.
-
•
We then derived abundances for the following elements: FeI, SiI, CaI, TiI and NiI. Overall, the two clusters exhibit solar composition, with mean metallicity [Fe/H]NGC 6940=+0.090.06 dex, and [Fe/H]To 5=+0.060.11 dex. The estimate we found for NGC 6940 is in good agreement with the most recent literature. On the other hand, the metallicity measured for To 5 confirms the large spread (almost 0.5 dex) in [Fe/H] at about10 kpc from the Galactic centre.
-
•
We used Gaia DR2 to select the cluster members based on the analysis of proper motions and to calculate the cluster distances from the corresponding parallaxes. We derived for NGC 6940 a heliocentric distance of 1.00.2 kpc. This is somewhat larger than the values found in literature, but provides a generally good fit of the star distribution in the CMD. For To 5 we found a distance of 1.70.1 kpc, confirming the values reported in WEBDA, and thus ruling out previous suggestions of a shorter distance of 1.3 kpc.
-
•
With our new estimates of metallicities and an updated distances from Gaia DR2, we revised the cluster fundamental parameters, in particular the age. Using the isochrone fitting technique we found an age of 1.00.1 Gyr for NGC 6940, and 25050 Myr for To 5.
References
- Alonso et al. (1999) Alonso, A., Arribas, S., & Martínez-Roger, C. 1999, A&AS, 140, 261
- Banse et al. (1983) Banse, K., Crane, P., Grosbol, P., Middleburg, F., Ounnas, C., Ponz, D., Wladthausen, H., 1983, Msngr, 31, 26
- Blanco-Cuaresma et al. (2015) Blanco-Cuaresma, S., Soubiran, C., Heiter, U., et al. 2015, A&A, 577, A47
- Böcek Topcu et al. (2016) Böcek Topcu, G., Afşar, M., & Sneden, C. 2016, MNRAS, 463, 580
- Carraro, Semenko, & Villanova (2016) Carraro G., Semenko E. A., Villanova S., 2016, AJ, 152, 224
- Casamiquela et al. (2016) Casamiquela L., et al., 2016, MNRAS, 458, 3150
- Castelli & Kurucz (2004) Castelli, F., & Kurucz, R. L. 2003, IAUS, 210, 20
- Chountonov (2004) Chountonov, G. A. 2004, Magnetic Stars, 286
- D’Orazi et al. (2017) D’Orazi, V., Desidera, S., Gratton, R. G., et al. 2017, A&A, 598, A19
- Gaia Collaboration et al. (2016) Gaia Collaboration, Prusti, T., de Bruijne, J. H. J., et al. 2016, A&A, 595, A1
- Gaia Collaboration et al. (2018) Gaia Collaboration, Brown, A. G. A., Vallenari, A., et al. 2018, arXiv:1804.09365
- Geisler (1988) Geisler, D. 1988, PASP, 100, 338
- Geyer & Nelles (1985) Geyer, E. H., & Nelles, B. 1985, A&AS, 62, 301
- Gilmore et al. (2012) Gilmore G., et al., 2012, Msngr, 147, 25
- Girardi (2016) Girardi, L., 2016, AN, 337, 871
- Gratton et al. (1996) Gratton, R. G., Carretta, E., & Castelli, F. 1996, A&A, 314, 191
- Grosbol and Ponz (1990) Grosbol, P., Ponz, D., 1990, apaa, 11
- Hartwick & McClure (1972) Hartwick, F. D. A., & McClure, R. D. 1972, PASP, 84, 288
- Jennens & Helfer (1975) Jennens, P. A., & Helfer, H. L. 1975, MNRAS, 172, 681
- Johnson et al. (1961) Johnson, H. L., Hoag, A. A., Iriarte, B., Mitchell, R. I., & Hallam, K. L. 1961, Lowell Observatory Bulletin, 5, 133
- Kharchenko et al. (2013) Kharchenko, N. V., Piskunov, A. E., Roeser, S., Schilbach, E., & Scholz, R.-D. 2013, VizieR Online Data Catalog, 355,
- Larsson-Leander (1960) Larsson-Leander, G. 1960, Stockholms Observatoriums Annaler, 20,
- Larsson-Leander (1964) Larsson-Leander, G. 1964, ApJ, 140, 144
- Lata et al. (2004) Lata, S., Mohan, V., Pandey, A. K., & Sagar, R. 2004, Bulletin of the Astronomical Society of India, 32, 59
- Maciejewski & Niedzielski (2007) Maciejewski, G., & Niedzielski, A. 2007, A&A, 467, 1065
- Majaess et al. (2008) Majaess, D. J., Turner, D. G., & Lane, D. J. 2008, MNRAS, 390, 1539
- Marigo et al. (2017) Marigo, P., Girardi, L., Bressan, A., et al. 2017, ApJ, 835, 77
- Mermilliod & Mayor (1989) Mermilliod, J.-C., & Mayor, M. 1989, A&A, 219, 125
- Mermilliod et al. (2008) Mermilliod, J. C., Mayor, M., & Udry, S. 2008, A&A, 485, 303
- Munari et al. (2005) Munari, U., Sordo, R., Castelli, F., & Zwitter, T. 2005, A&A, 442, 1127
- Netopil et al. (2016) Netopil, M., Paunzen, E., Heiter, U., & Soubiran, C. 2016, A&A, 585, A150
- Reddish (1954) Reddish, V. C. 1954, MNRAS, 114, 583
- Reddy et al. (2016) Reddy, A. B. S., Lambert, D. L., & Giridhar, S. 2016, MNRAS, 463, 4366
- Reid et al. (2009) Reid, M.J., Menten, K.M., Zheng, X.W., Brunthaler, A., Moscadelli, L., Xu, Y., Zhang, B., et al., 2009, ApJ, 700, 137
- Sanders (1972) Sanders, W. L. 1972, A&A, 16, 58
- Sneden (1973) Sneden, C., 1973, PhDT, 180
- Sobeck et al. (2011) , Sobeck, J.S., Kraft, R.P., Sneden, C., Preston, G.W., Cowan, J.J., Smith, G.H., Thompson, I.B., et al. 2011, AJ, 141, 175
- Stassun & Torres (2018) Stassun, K.G., Torres, G., 2018, ApJ, 862, 61
- Tagliaferri & Belloni (1997) Tagliaferri, G., & Belloni, T. 1997, Mem. Soc. Astron. Italiana, 68, 1001
- Thogersen et al. (1993) Thogersen, E. N., Friel, E. D., & Fallon, B. V. 1993, PASP, 105, 1253
- Tody (1993) Tody, D., 1993, ASPC, 52, 173
- Tody (1996) Tody, D., 1996, ASPC, 101, 322
- Tombaugh (1941) Tombaugh, C. W. 1941, PASP, 53, 219
- van den Berg & Verbunt (2001) van den Berg, M., & Verbunt, F. 2001, A&A, 375, 387
- Vasilevskis & Rach (1957) Vasilevskis S., Rach R. A., 1957, AJ, 62, 175
- Walker (1958) Walker, M. F. 1958, ApJ, 128, 562
- Zdanavičius et al. (2011) Zdanavičius, J., Vrba, F. J., Zdanavičius, K., Straižys, V., & Boyle, R. P. 2011, Baltic Astronomy, 20, 1
- Zinn et al. (2018) Zinn, J.C., Pinsonneault, M.H., Huber, D., Stello, D., 2018, arXiv180502650