9pt
Multi-View Community Detection in Facebook Public Pages
Abstract
Community detection in social networks is widely studied because of its importance in uncovering how people connect and interact. However, little attention has been given to community structure in Facebook public pages. In this study, we investigate the community detection problem in Facebook newsgroup pages. In particular, to deal with the diversity of user activities, we apply multi-view clustering to integrate different views, for example, likes on posts and likes on comments. In this study, we explore the community structure in not only a given single page but across multiple pages. The results show that our method can effectively reduce isolates and improve the quality of community structure.
1 Introduction
In the last decade, the rapid growth and adoption of online social networks, such as Facebook, Twitter, Linkedin, has fundamentally changed the way people interact with each other. There are many people who would rather spend more time on these social networking sites than traditional media. With this trend, a great deal of data has been generated from the increasing number of online social networking users. Therefore, it is important to study the structure of social networks, which can provide meaningful insight to Sociology, Communications, Economics, Marketing or even Epidemiology.
One important type of structure of social networks is how the entities are divided into different groups. Basically, there is no formal definition of community, but it is believed that entities are densely connected inside each community with less links between different communities [1]. This community structure plays a significant role in visualization [2], dynamic community detection [3], opinion mining [4], and behavior prediction [5].
Previous research work on community detection generally dealt with the single-view setting. Views are independent data sources or datasets. One classic example is the web-page classification [6], in which one view is the content of web-page, and the other is comprised of the hyperlinks pointing to it. In social networks, such as YouTube and Flickr, the interactions between users are complex [7]. Similarly, on Facebook, users like, comment and share content, and interact with each other through these activities. Specifically, in the same page, the activities on posts and those on comments can form two views. From each view, we can generate features and construct a graph to find community structures within a given page.
Apart from the complexity of interactions of users, the volume of data derived from social media has increased exponentially. At the end of 2017, Facebook had more than billion users [8] and up to million small businesses had public pages [9]. We find that with an increase in the number of users, and corresponding interactions, there is naturally a significant correlative increase in difficulty of discovering community structures within Facebook pages. In this paper, we propose to model Facebook page as a weighted graph that is generated by two views (posts and comments). Then we examine the community structure of CBS News and The New Times Facebook pages in last week of 2012. In addition, the community structure for common users across multiple pages is studied. Our findings show that combining different views can remarkably reduce the number of isolates in a single-view and make the community structure more cohesive in networks because both views can mutually benefit from each other.
The rest of the paper is organized as follows. The next section introduces the related work. Section describes the issue of single-view methods. The method is presented in Section . Section gives a detailed empirical study and results. Finally, discussion is made in Section .
2 Related Work
Before community detection became a trending research topic, data clustering has been always a basic problem in machine learning research. Although clustering is more general in terms of the non-overlapping characteristic of data points, it can be applied to the community detection problem. There are basically two types of clustering algorithms [10]. One is model-based or so-called generative approach and the other is similarity-based or discriminative approach. Furthermore, in similarity-model methods, spectral clustering [11, 12] has prevailed in the last several years for its performance, efficiency and robustness. On the other hand, multi-view clustering is an effective tool for complex social networks. The earliest work of multi-view clustering was proposed by Blum and Mitchell in their co-training algorithm [6]. Their idea was based on the assumption that learning can progress with enough labeled data in each view otherwise each view mutually benefits from the labeled data to each other. Steffen Bickel and Tobias Scheffer [13] proposed to alternately cluster each view and exchange information during the learning process.
Multi-view idea met spectral clustering in Virginia’s work [14], in which the disagreement between two views was minimized. It outperformed the result from each view in a sense that each view can leverage the information from each other. Later, spectral clustering was extended to clustering multiple graphs by Zhou et al [15], where a generalized Laplacian was built based on a random walk and its eigenvectors were computed. Kumar et al. added co-training flavor to spectral clustering [16]. First, original two sets of eigenvectors of graphs were computed. Second, each eigenvector was used to modify the structure of the other graph. Third, the clustering result was generated from the column-wise concatenation of the two eigenvector matrices. Also, Kumar et al. [17] allowed the pair-wise co-regularizers to be included in the objective function to decrease the disagreement between any pair of views. Xiang et al. [18] were the first to bring the Pareto optimization into spectral clustering to find optimal cuts for multiple graphs via multi-objective functions. No parameter was needed to set for Pareto frontier and it explored all possible good cuts. Xia et al. proposed a novel Markov chain method for Robust Multi-view Spectral Clustering (RMSC) to deal with the noise problem [19]. They used the Lagrangian Multiplier scheme to optimize RMSC. In addition to spectral clustering, many other clustering algorithms were applied to multi-view setting. Cai et al. extended K-means to multi-view clustering on a large scale amount of data [20]. Linked Matrix Factorization [21] was proposed for clustering multiple graphs. And Liu et al. [22] formulated the problem as a joint non-negative matrix factorization process that forces each result of view to hold a consensus. Zhang et al. [23] also used similar NMF method but with constrains to handle unmapped data. Other related work includes Linked Matrix Factorization [21], tensor methods [24], fuzzy clustering [25] and belief propagation [26].
Moreover, heterogeneous networks represent multi-relational in social networks and some interesting work [27, 7, 28] should be noticed recently. However, little work has been carried out on Facebook public pages. This paper focuses on modeling, testing and discovering the community structure of Facebook newsgroup pages. To represent the users interactions in public pages precisely, two graphs are built and merged in a way that modularity is optimized. Analysis is conducted on not only a single page but also against multi-page clusters.
3 Issues of Single View Community Detection
In the traditional research of community detection in the single-view setting, the procedure is the following: first construct a graph based on the connection between users and then apply some algorithm to partition the graph. However, in real social networks, the interaction between users are complex. For example, users can like or comment a post so it is hard to use only one graph to represent different interactions between users.
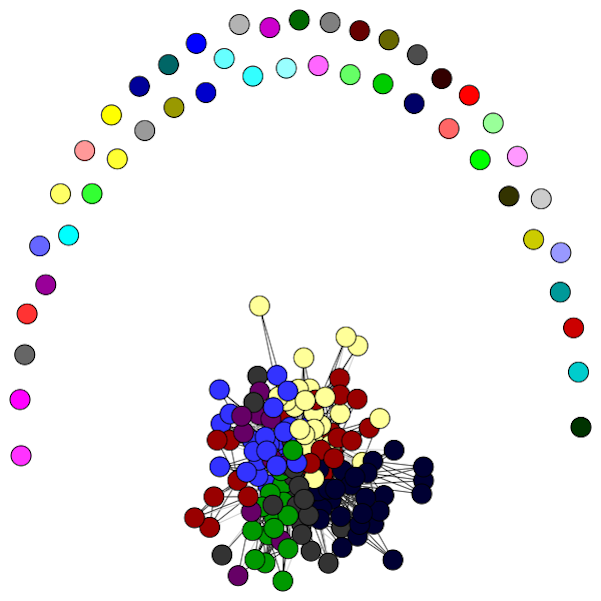
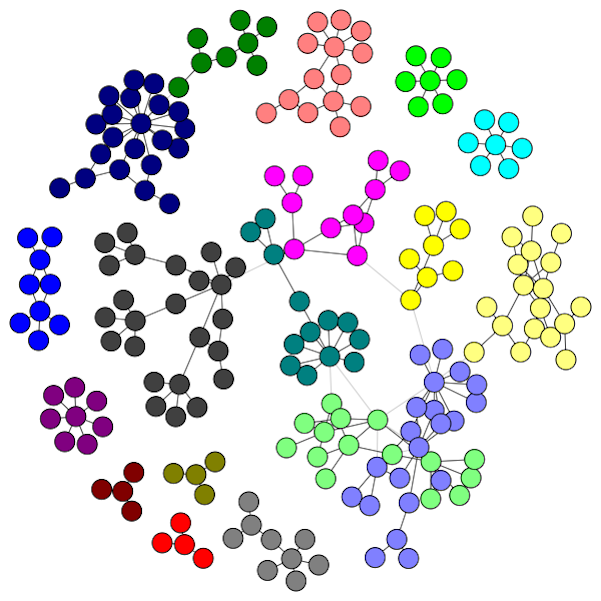
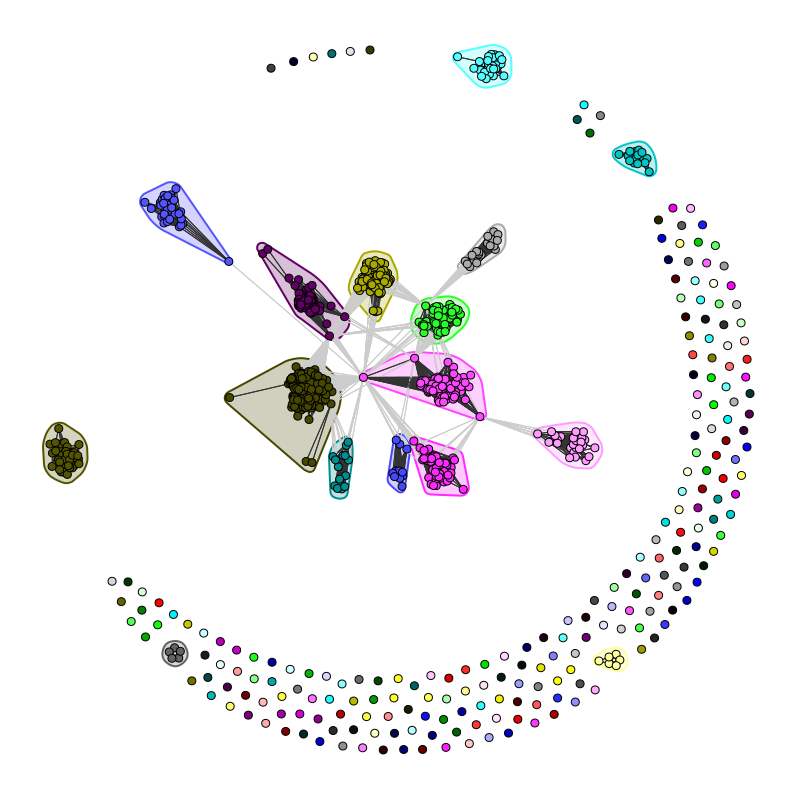
For CBS News page, we extract sample users from our database and construct two graphs based on the interactions of different content: posts and comments. The definition is shown in the next section. Then, we apply the multi-level algorithm [29, 30, 31] to find the community structure in the two graphs. The connected nodes with the same color belong to the same community.
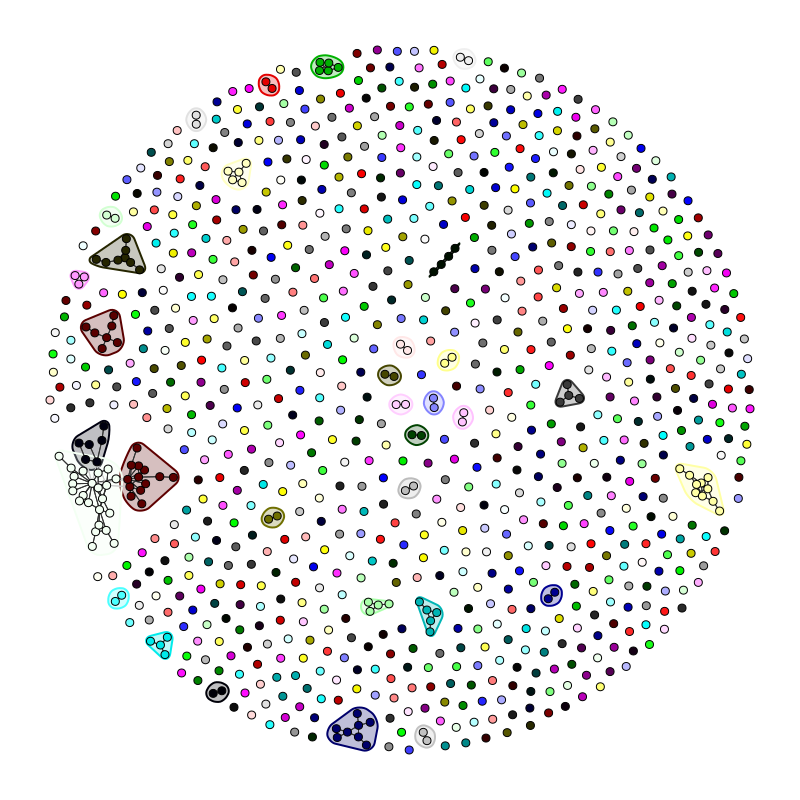
It is clear that there are more isolates in the post graph in Figure 1 but the comment graph in Figure 2 shows a regular and balanced community structure. Therefore, the issue is that single-view or one graph, can’t best represent the interactions between users. In particular, in this example, the users that are considered as isolates in the post graph actually have connections with others in the comment graph.
4 Method
4.1 Problem Formulation
Before we formulate the problem, it is necessary to mention the terminology in this paper. We consider networks as graphs, where a node represents a Facebook user and an edge represents interaction between a pair of nodes. Community and cluster are interchangeable as well.
A multi-view dataset can be represented by k graphs that have the same set of nodes but with a different set of edges. Formally, given graphs and the number of communities k, our goal is to find a vector v=(, , …, ) such that v gives an optimal community structure for all graphs, where represents that node i belongs to community and , . In this paper, we focus on two views (activities on posts and comments) in Facebook public pages. Thus, .
4.2 Graph Construction
To some extent, community detection is a graph partitioning problem. So, it is important to define the appropriate graph for our purpose. In Facebook, users have three basic types of actions: comment, like and share. Specifically, in newsgroup pages, post and comment are the basic blocks in which users interact with each other.
In data clustering, a matrix is used to represent and analyze a graph. Here we use adjacency matrices to represent our social interaction graphs.
If a pair of users and concurrently like a post, then we put in the cell of the matrix. And we call this the post graph. The adjacency matrix 1 for post view/graph is defined as follows:
| (1) |
The other adjacency matrix 2 for the comment view/graph is defined by likes on comment. And we call this comment graph. If user likes the comment of user or vice versa or they concurrently like a comment, we assign the weight to be 1, otherwise 0.
| (2) |
Then we define our weighted graph by combining the two graphs into one and assigning each graph a weight based on importance factor. Moreover, it can be easily extended to multiple views. Its formal definition 3 is as follows:
| (3) |
where n is the number of views/graphs, and . And when , it becomes the adjacency matrix for two views 4.
| (4) |
It turns out when or , it is reduced to single-view.
4.3 Multi-View Community Detection via Weighted Graphs
To learn the optimal parameter in equation 4, modularity [32] is introduced. Modularity 5 is a measurement that evaluates how apposite community structure is for any given network. It ranges from to inclusively and the larger it is, the better the community structure is. From the definition, modularity essentially is the value that the real weight of an edge minus the probability of generating it and sum them all.
| (5) |
| (6) |
where m is the number of edges, W is the adjacency matrix, are the degree of node i and j respectively.
Our algorithm borrows the idea of modularity maximization [33]. First, we generate a set of parameters and calculate the modularity for each network’s structure. Then, we pick the largest modularity value and its corresponding community structure as the result. The details can be seen in Algorithm 1.
The time complexity of Algorithm 1 is based on two aspects. The first is to construct the adjacency matrix, which takes time theoretically, but this can be reduced to because most social networks are sparse , where and are the number of nodes and edges of the network. In addition, the second is to run the core community detection algorithm [29] times that takes , where is the number of parameters. In total, the time complexity of our algorithm is , which is since .
5 Empirical Study
5.1 Data Collection
Our Facebook dataset [34] is crawled from public pages by using Facebook Graph API. In this paper, we only consider the public pages like CBS News, Fox News and New York Times, etc. One characteristic of these pages is that only the administrators can post information. Users can only comment, like and share posts or reply and like comments.
In our database, we have several tables such as comment, likedby and shares, etc. Since comment and like are the most common activities in Facebook newsgroup pages, we focus on the comment table and the likedby table. Specifically, the schema of comment is composed of , , , , , and . And the schema of likedby is composed of , , and .
Until June 2018, we have crawled millions of pages, hundreds of millions of posts, billions of comments and likes by near billions application-scoped users. Table 1 shows the statistics in detail.
| Table Name | Number of rows | Size in GB |
|---|---|---|
| page | 4,706,324 | 0.30 |
| shares | 160,098,978 | 8.54 |
| post | 343,000,084 | 246.66 |
| comment | 6,429,663,271 | 1,213.59 |
| likedby | 36,897,398,296 | 4,028.59 |
| reaction | 95,831,789,680 | 9,973.33 |
We collected two datasets from CBS News and The New York Times in the last week of 2012. The statistics of the two datasets are listed in Table 2.
| Category | CBS | NY Times |
|---|---|---|
| Users | 11,610 | 42,001 |
| Posts | 42 | 57 |
| Comments | 5,488 | 3,244 |
| Likes | 15,000 | 64,104 |
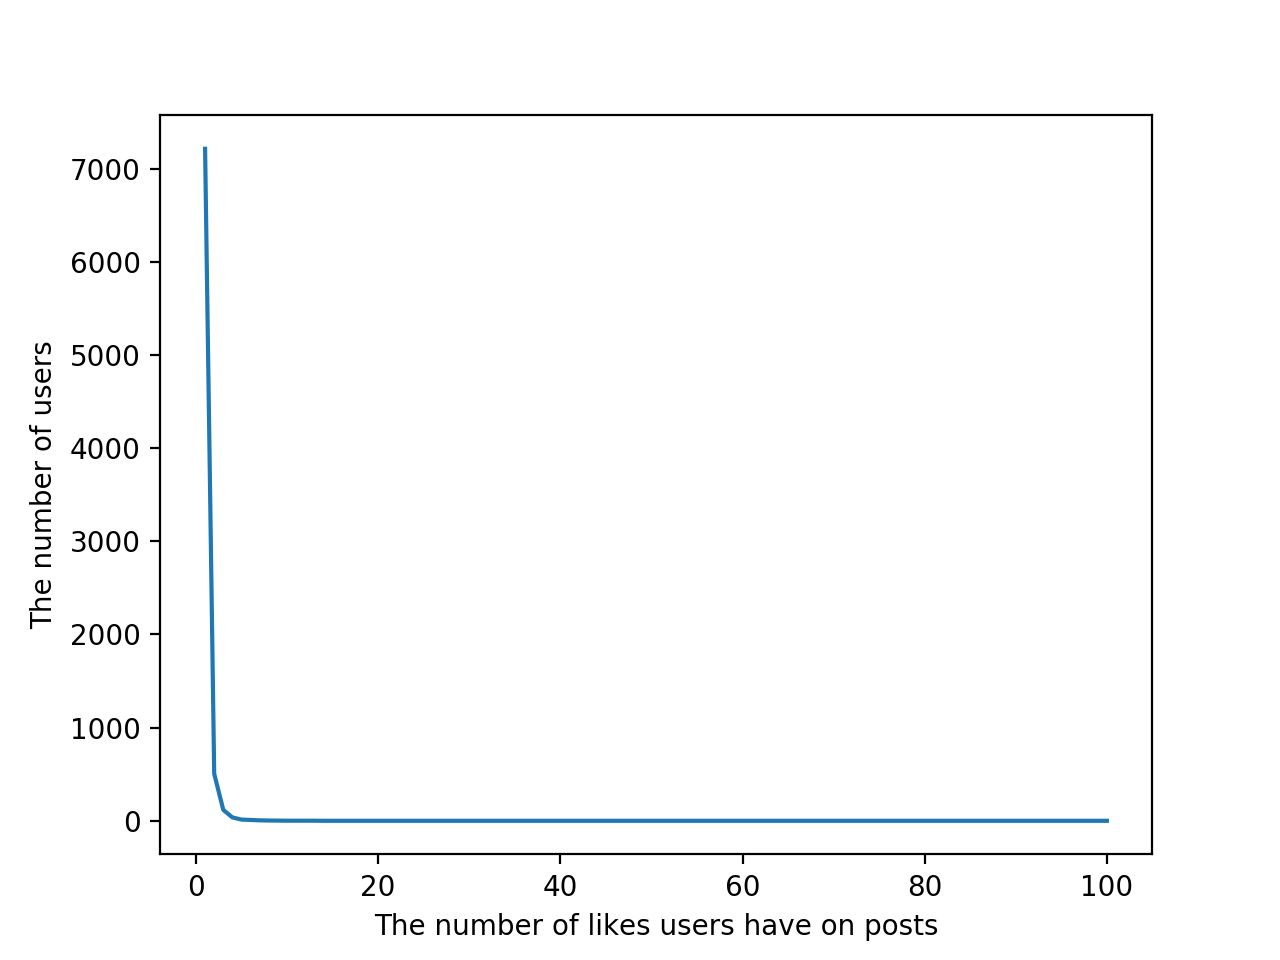
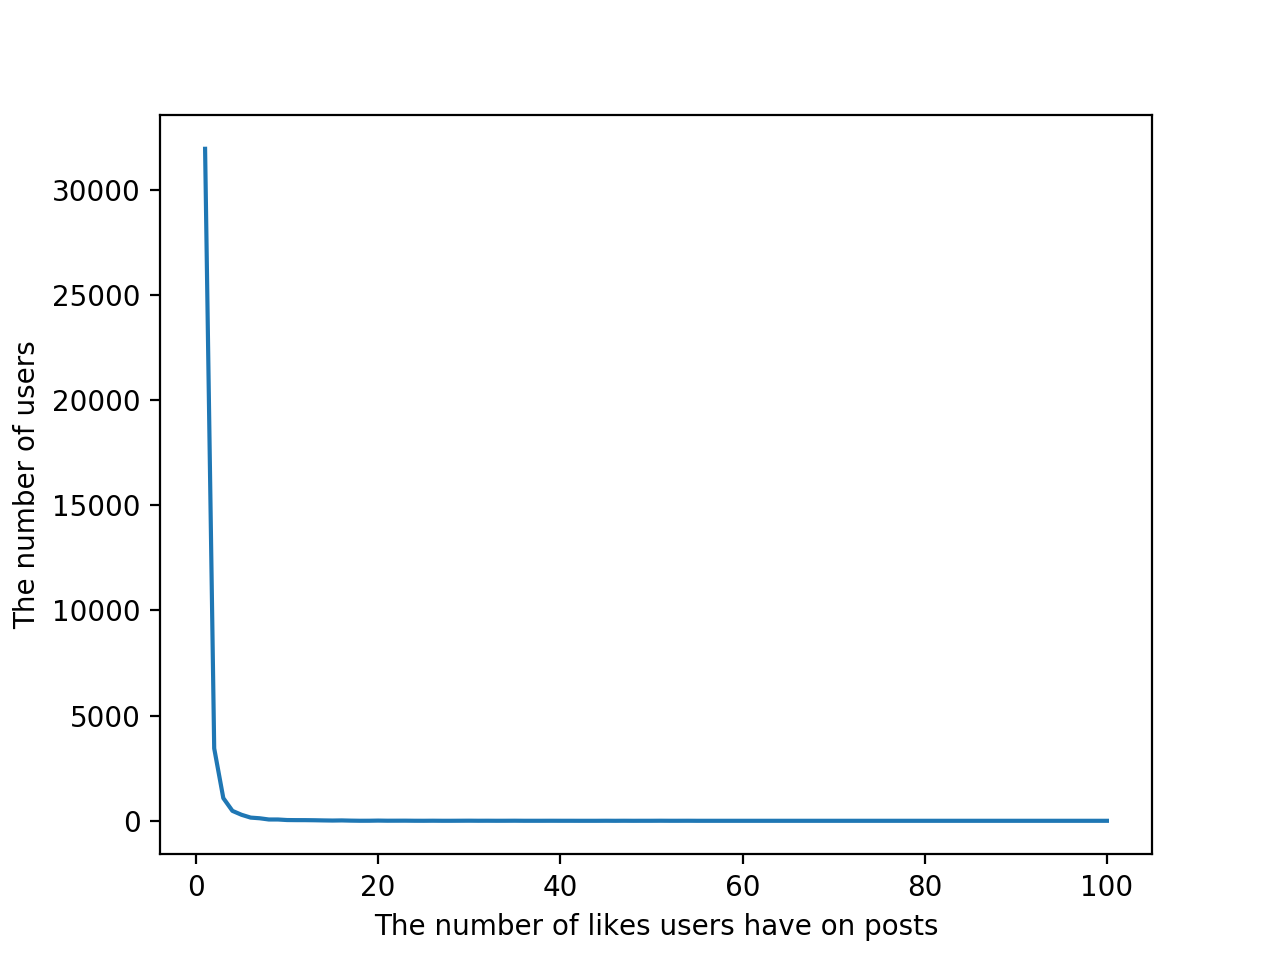
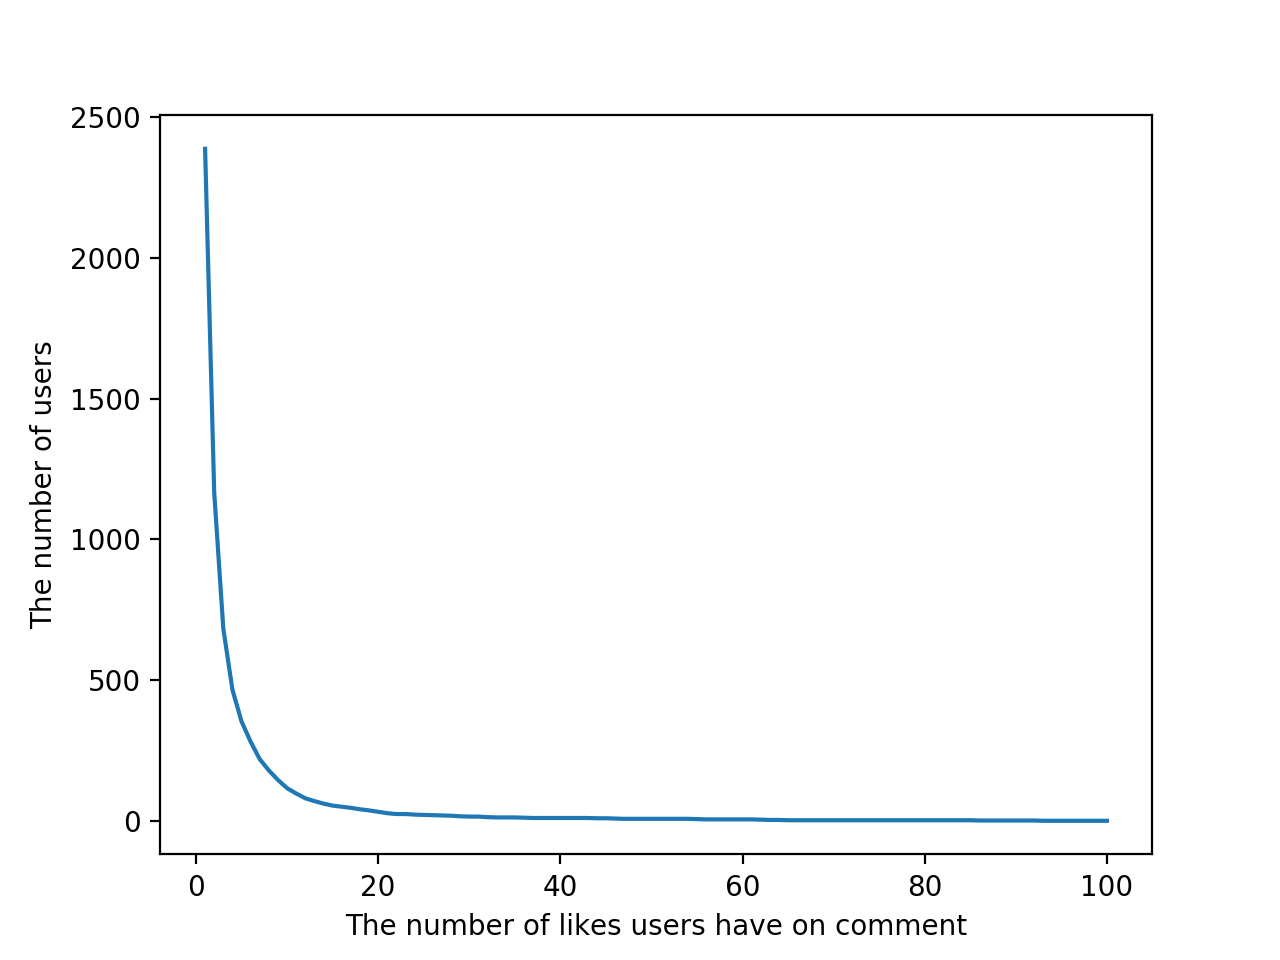
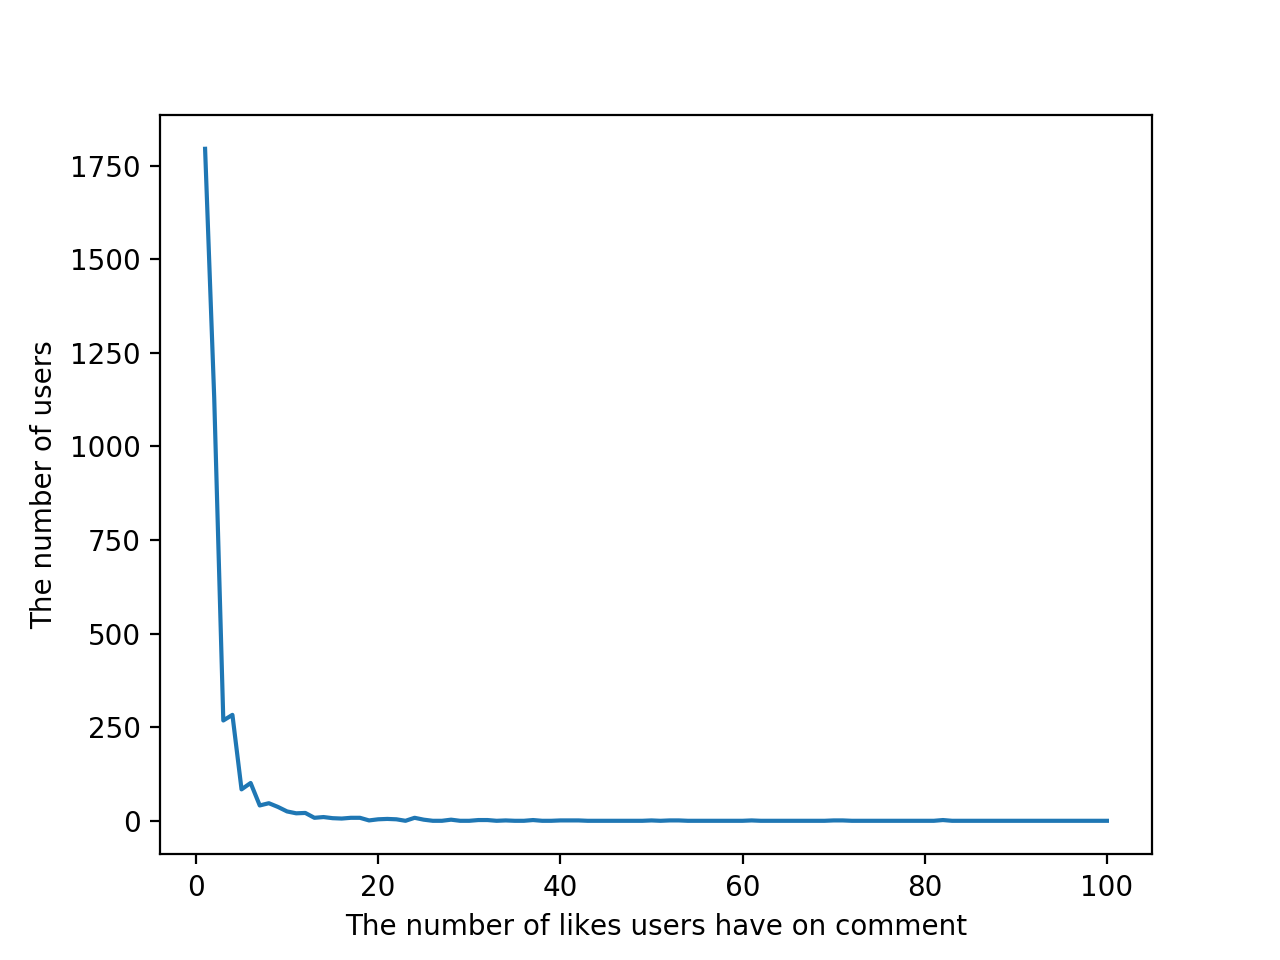
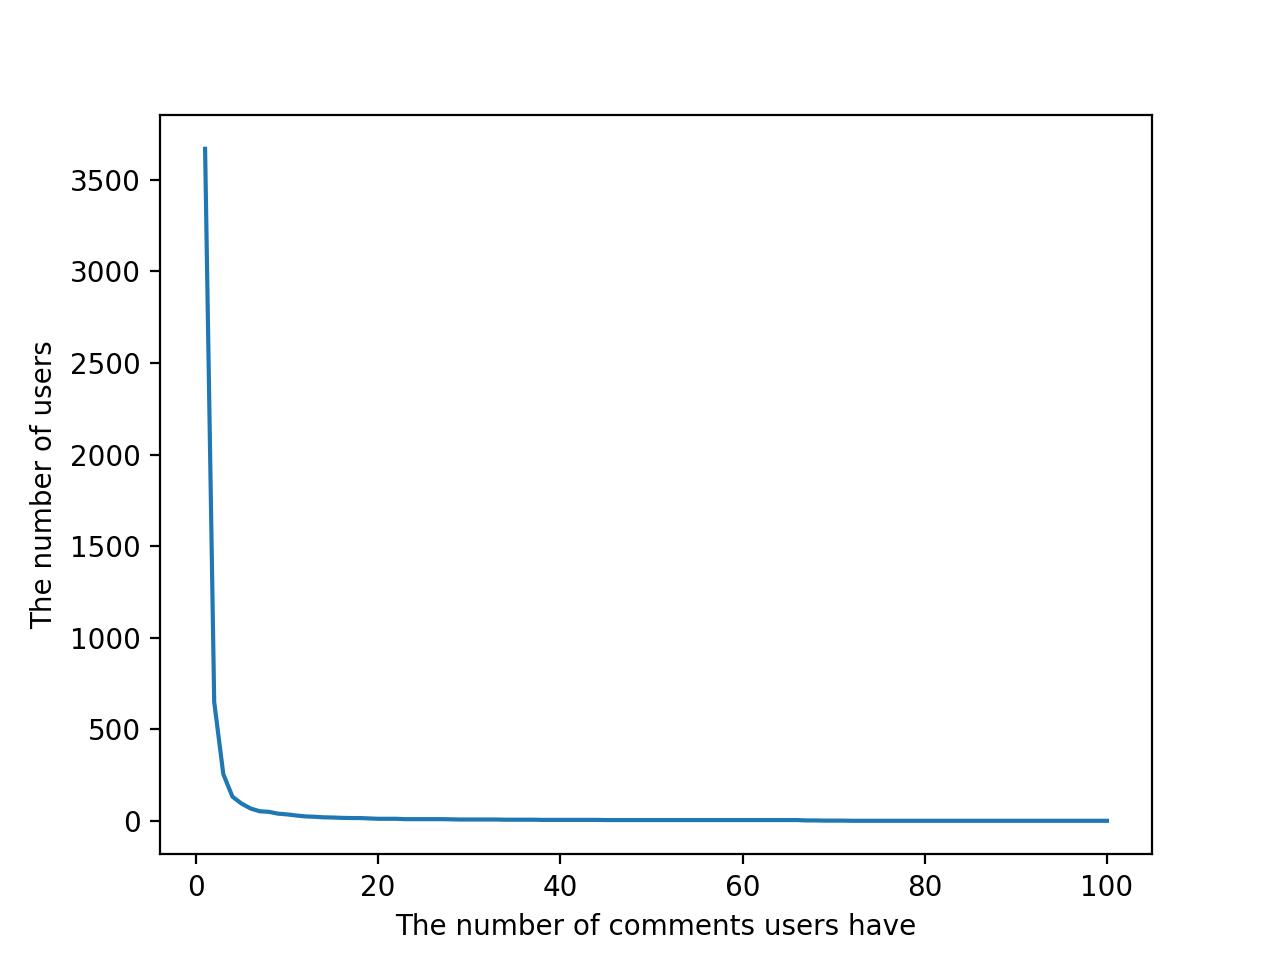
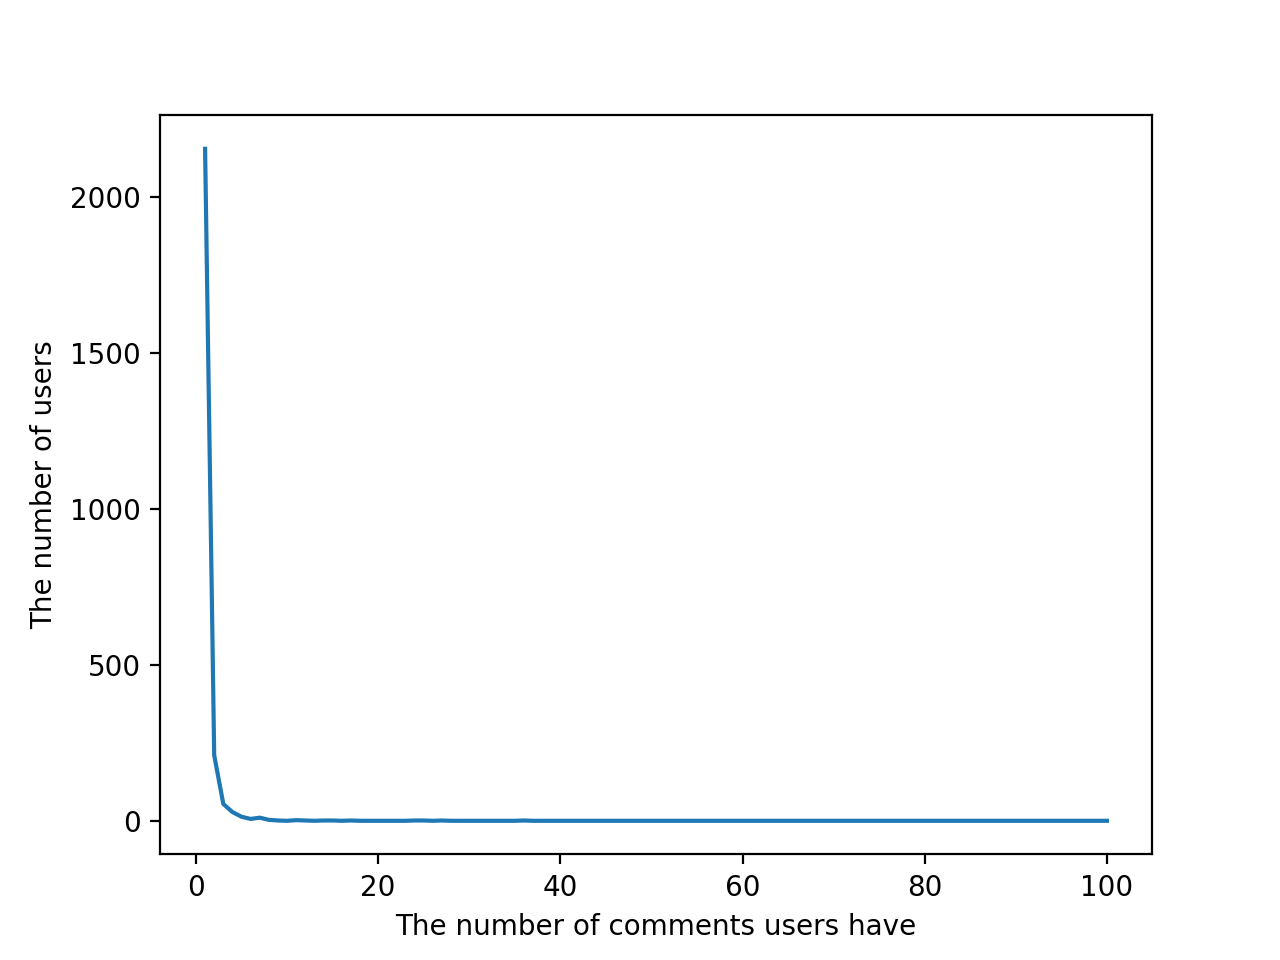
According to previous work [35, 36], most variables in internet or social networks display power-law/long tail distributions. To verify this, we plot the users distribution with the number of activities in Facebook public pages, where the x-axis is the number of likes of users on comments or posts and the y-axis is the number of users. Figure 3LABEL:sub@1a and Figure 3LABEL:sub@2a reveal the users distributions with likes on posts and on comments respectively for CBS News. And Figure 3LABEL:sub@3a plots the distributions of users with comments. In addition, Figure 3LABEL:sub@1b, Figure 3LABEL:sub@2b and Figure 3LABEL:sub@3b are those for The New York Times. It can be seen that with the increase in number of likes, the number of users drops significantly, approximately power distributions. Most Facebook users in the two pages have less than likes and comments in a week.
5.2 Parameter Tuning
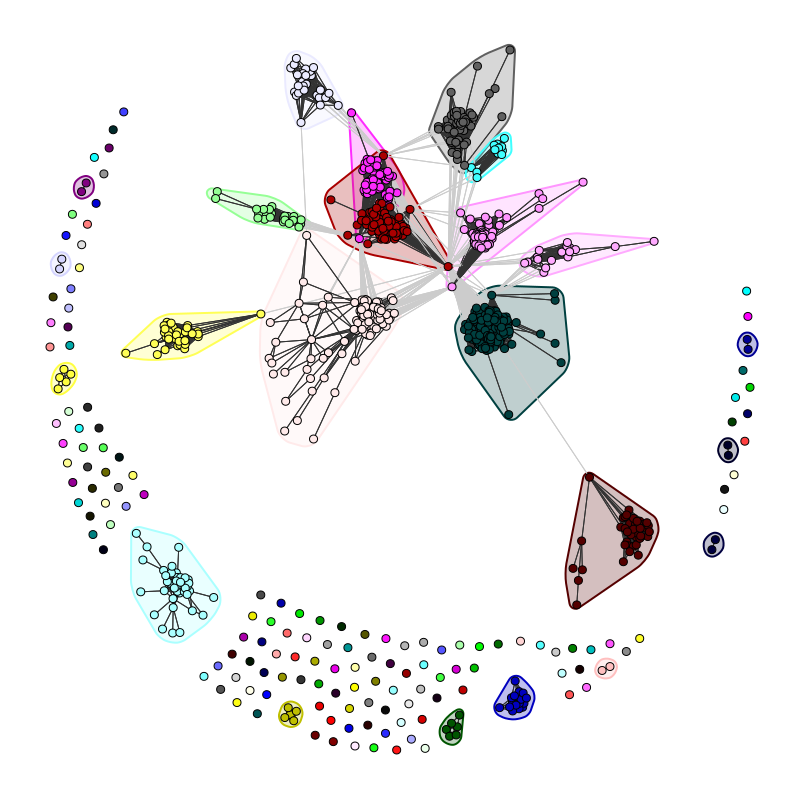
After defining the graphs, we study how the parameter affects the community structure of pages. Comment graphs show less density than post graphs, which implies that users are inclined to like posts rather than like comments. Moreover, the number of clusters decrease tens of times in Table 3 and hundreds of times in Table 4 for each page, which shows our algorithm can effectively reduce isolates and uncover a more cohesive structure of networks. View and View represent post graph and comment graph respectively. Merged represents the weighted graph from the two views. On the other hand, we observe that modularity is not a perfect measurement especially for networks with a number of isolates because the more isolates are, the larger modularity is.
| Category | View 1 | View 2 | Merged |
|---|---|---|---|
| Users | 10,535 | 10,535 | 10,535 |
| Edges | 2,448,338 | 28,208 | 2,475,896 |
| Clusters | 3,338 | 6,821 | 120 |
| Isolates | 3,321 | 6,647 | 4 |
| Modularity | 0.8334 | 0.9135 | 0.8350 |
| Category | View 1 | View 2 | Merged |
|---|---|---|---|
| Users | 41,252 | 41,252 | 41,252 |
| Edges | 106,115,374 | 213,746 | 106,296,974 |
| Clusters | 3,395 | 36,340 | 31 |
| Isolates | 3,383 | 36,279 | 0 |
| Modularity | 0.6054 | 0.8057 | 0.6050 |
In order to find the optimal parameter, we generate a set of parameters as the candidates, {0.0, 0.2, 0.4, 0.6, 0.8, 1.0}. Then we run Algorithm 1 repetitively for each parameter and calculate the corresponding modularity. We plot the relation between the parameters and their modularity in Figure 4 for both CBS News and The New York Times.
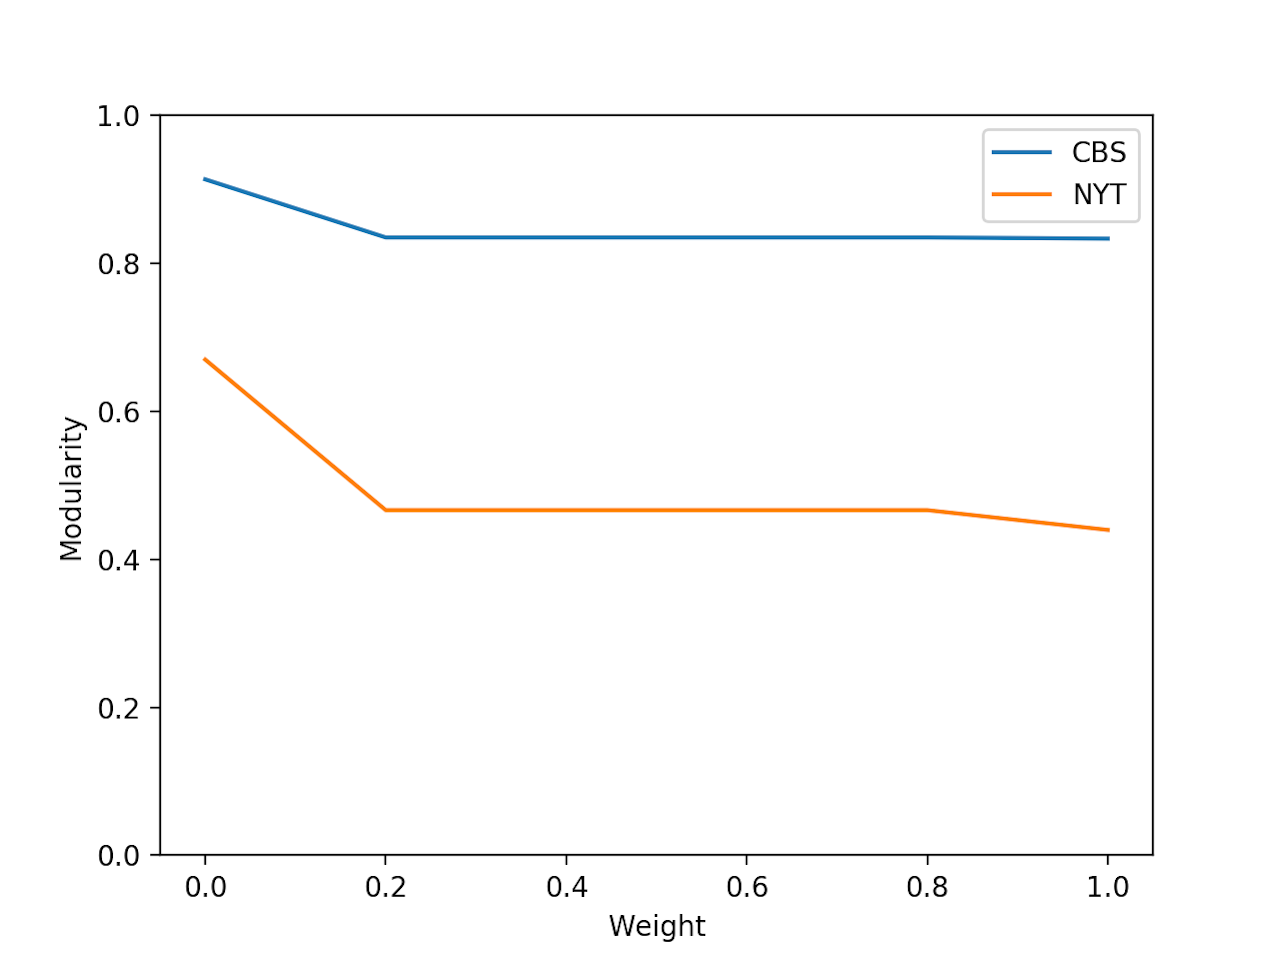
Also we examine how the parameter affects the number of communities. Table 5 shows the relation between the parameters and their number of communities for the two pages. The results demonstrate the parameter does not change the modularity value and the number of communities. In this study, the parameter value is to set to be . It is worth noting that the parameter improves the modularity of the post graph and it makes the both graphs denser. Modularity is inclined to increase with more isolates for the same set of users, which can explain why it reaches the maximum value when the parameter is .
| Parameter | CBS | NY Times |
|---|---|---|
| 0 | 6,821 | 36,340 |
| 0.2 | 120 | 31 |
| 0.4 | 120 | 31 |
| 0.6 | 120 | 31 |
| 0.8 | 120 | 31 |
| 1 | 3,338 | 3,395 |
5.3 Selection of Active Users
Facebook itself is a huge dataset with billions of users so that it is not easy to analyze the activities of all users. Moreover, there are a number of users who have limited activities and don’t contribute to providing any structural information. Therefore, for our good, we define the following popular content and active users. For popular content (post and comment) 1 in public pages is defined by the following:
Definition 1
Popular Facebook Content is a post liked by at least 2 users or a comment liked by at least 1 user.
For active Facebook users, the definition 2 is as follows:
Definition 2
An Active Facebook User must have the following conditions: at least likes 1 popular post; at least has 1 popular comment or at least likes 1 popular comment.
For CBS News and The New York Times, we selected popular content and then the active users in the same page. The result 6 is shown in the following:
| Category | CBS | NY Times |
|---|---|---|
| Users | 575 | 1,582 |
| Posts | 42 | 54 |
| Comments | 3,015 | 1,799 |
| Likes | 15,000 | 64,014 |
5.4 Comparison of Different Methods
We choose the multi-view clustering[13] for the baseline. To be fair, the weighted graph is taken as the base on which modularity is calculated for all methods. Multi-Level [29] and LPA [37] are selected as our core community detection algorithms. We tested these methods on the active users data described in Table 6.
Table 7 and Table 8 show the modularity values calculated by a different method under the same graph and number of communities. We can see that our method based on the Multi-Level algorithm outperforms the other two in CBS News and The New York Times pages. On the other hand, like other clustering algorithms, MVC has to estimate the optimal number of clusters so it repetitively runs at least K times, where K is the maximum number of communities.
| Method | Modularity | Clusters |
|---|---|---|
| MVC | 0.8196 | 14 |
| Weighted LPA | 0.8200 | 26 |
| Weighted Multi-Level | 0.8373 | 20 |
| Method | Modularity | Clusters |
|---|---|---|
| MVC | 0.3899 | 7 |
| Weighted LPA | 0.1641 | 4 |
| Weighted Multi-Level | 0.4241 | 10 |
5.5 Community Detection in Multiple Pages
In reality, Facebook users often participate in multiple pages. For example, one user can like a post about the presidential election in the CBS News page and write a comment on the post with a similar topic on the NBC page. Therefore, we try to discover communities of users across multiple pages in this part.
The first dataset is ABC News and CBS News in the December of 2012. The reason why we chose the two pages is that they share enough Facebook users. The statistics of the two pages can be seen in Table 9:
| Category | ABC | CBS |
|---|---|---|
| Total users | 362,722 | 61,576 |
| Common users | 961 | 961 |
| Posts | 613 | 220 |
| Comments | 108,116 | 24,564 |
| Likes | 674,791 | 85,639 |
Here, common users who are involved in the two pages and let the parameter be . Initially, we plotted the post graph in Figure 5 and the comment graph in Figure 6. By applying Algorithm 1, we get the communities structure for the graphs in Table 10.
| Category | View 1 | View 2 | Merged |
|---|---|---|---|
| Nodes | 961 | 961 | 961 |
| Edges | 17,188 | 169 | 17,343 |
| Clusters | 233 | 850 | 160 |
| Isolates | 217 | 818 | 137 |
| Modularity | 0.6881 | 0.8480 | 0.6912 |
Both Figure 5 and Figure 6 show sparse structure. After we apply our multi-view community detection algorithm, it 7 erases most of the outliers in the comment graph.
The second dataset is ABC News, CBS News and NBC in the last half of . In this dataset, we are interested in the users who have comment in ABC News and likes in the rest two. Consequently, we change the view into the graph in which any pair of users concurrently like posts or comments and view into the graph in which any pair of users like each other’s comment. The data statistics is shown in Table 11. And the community structure information is described in Table 12.
| Category | ABC | CBS | NBC |
|---|---|---|---|
| Total users | 311,332 | 102,986 | 220,868 |
| Common users | 533 | 533 | 533 |
| Posts | 3,280 | 1,252 | 6,899 |
| Comments | 588,708 | 160,097 | 486,728 |
| Likes | 2,479,937 | 725,646 | 2,622,432 |
| Category | View 1 | View 2 | Merged |
|---|---|---|---|
| Nodes | 533 | 533 | 533 |
| Edges | 129,674 | 612 | 129,708 |
| Clusters | 4 | 376 | 6 |
| Isolates | 1 | 361 | 1 |
| Modularity | 0.0605 | 0.5917 | 0.0604 |
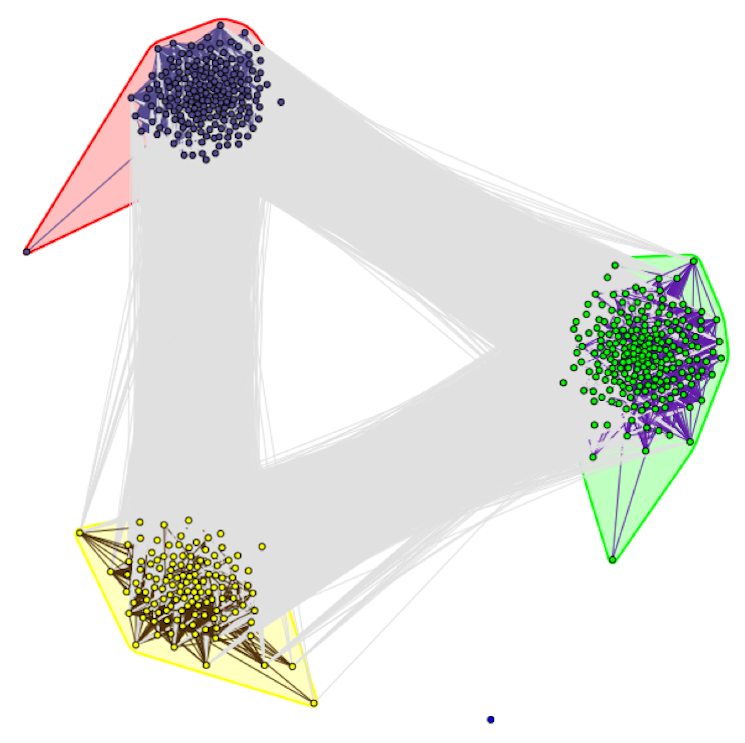
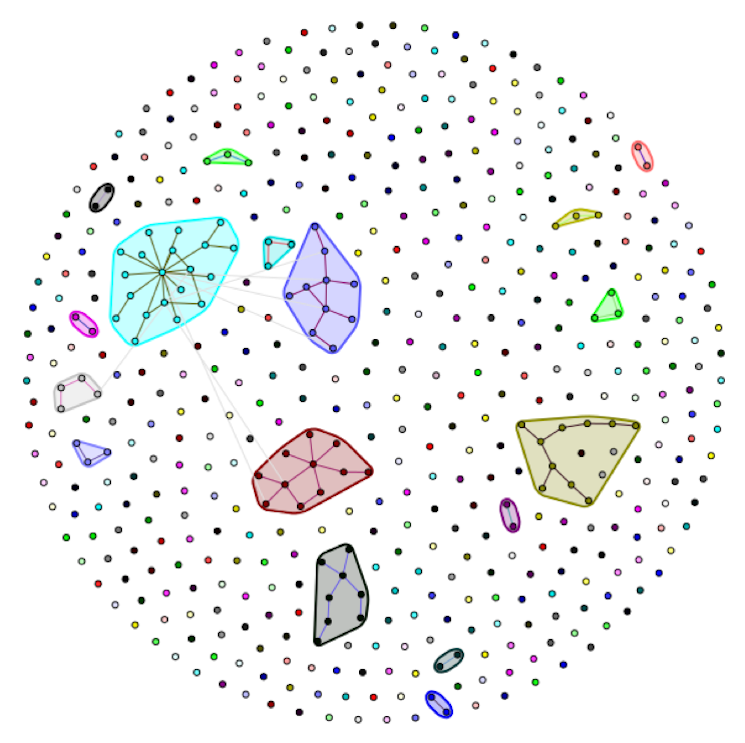

Figure 8 illustrates the users are located in three communities but Figure 9 shows the sparse structure. Figure 10 describes that most isolates are effectively removed in the post graph. Interestingly, when there are more than two pages, users within a page interact more than different pages so each community represents each page.
6 Discussion
Community detection in social networks as a research topic has attracted a significant amount of attention in the past few years. Prior research provided innovative theories, algorithms, and applications. However little work has been done with regards to exploring community structure in Facebook public pages. In this work, we propose a weighted multi-view community detection method and apply it to the Facebook newsgroup pages, CBS News, and The New York Times, etc. We not only investigate the community structure in a single page but across two or even three pages. The results reveal three advantages of our method: 1) it can alleviate the isolates issue in the sparse network/view. For example, in the CBS News page (last week of 2012), the isolates are decreased from and to . 2) more cohesive community structure can be found during the process, take the New York Times page (last week of 2012) as an example, the number of communities becomes from and . 3) it discovers latent communities across multiple pages. In the ABC, CBS and NBC pages, the common users show strong cohesion in post graph, but in our weighted graph, two more communities are discovered, which might provide useful information for recommend systems.
However, our method still has two limitations. First, it can not handle directed graphs. For example, like actions of users are one-way, which means one edge should point from the user who has the like to the user who posts the comment. Under such situation, it is unknown whether the community structure could be changed. Second, overlapping communities can not be discovered, but it is interesting because it has more reasonable assumption that one user can belong to multiple communities. More importantly, such overlapping structure might help to recommend users items more precisely in real recommendation systems.
7 References
References
- [1] S. Wasserman and K. Faust, Social network analysis: Methods and applications, vol. 8. Cambridge university press, 1994.
- [2] H. Kang, L. Getoor, and L. Singh, “Visual analysis of dynamic group membership in temporal social networks,” ACM SIGKDD Explorations Newsletter, vol. 9, no. 2, pp. 13–21, 2007.
- [3] L. Tang, H. Liu, J. Zhang, and Z. Nazeri, “Community evolution in dynamic multi-mode networks,” in Proceedings of the 14th ACM SIGKDD international conference on Knowledge discovery and data mining, pp. 677–685, ACM, 2008.
- [4] T. Wang, K. C. Wang, F. Erlandsson, S. F. Wu, and R. Faris, “The influence of feedback with different opinions on continued user participation in online newsgroups,” in Advances in Social Networks Analysis and Mining (ASONAM), 2013 IEEE/ACM International Conference on, pp. 388–395, IEEE, 2013.
- [5] L. Tang and H. Liu, “Scalable learning of collective behavior based on sparse social dimensions,” in Proceedings of the 18th ACM conference on Information and knowledge management, pp. 1107–1116, ACM, 2009.
- [6] A. Blum and T. Mitchell, “Combining labeled and unlabeled data with co-training,” in Proceedings of the eleventh annual conference on Computational learning theory, pp. 92–100, ACM, 1998.
- [7] L. Tang, X. Wang, and H. Liu, “Uncovering groups via heterogeneous interaction analysis,” in Data Mining, 2009. ICDM’09. Ninth IEEE International Conference on, pp. 503–512, IEEE, 2009.
- [8] Statista, “Number of monthly active facebook users worldwide.” https://www.statista.com/statistics/264810/number-of-monthly-active-facebook-users-worldwide/, 4 2018.
- [9] S. Aslam, “Facebook by the numbers: Stats, demographics and fun facts.” https://www.omnicoreagency.com/facebook-statistics/, 1 2018.
- [10] P. Berkhin et al., “A survey of clustering data mining techniques.,” Grouping multidimensional data, vol. 25, p. 71, 2006.
- [11] J. Shi and J. Malik, “Normalized cuts and image segmentation,” IEEE Trans. Pattern Anal. Mach. Intell., vol. 22, pp. 888–905, Aug 2000.
- [12] A. Y. Ng, M. I. Jordan, and Y. Weiss, “On spectral clustering: Analysis and an algorithm,” in Advances in neural information processing systems, pp. 849–856, 2002.
- [13] S. Bickel and T. Scheffer, “Multi-view clustering,” in ICDM, vol. 4, pp. 19–26, 2004.
- [14] V. R. De Sa, “Spectral clustering with two views,” in ICML workshop on learning with multiple views, pp. 20–27, 2005.
- [15] D. Zhou and C. J. Burges, “Spectral clustering and transductive learning with multiple views,” in Proceedings of the 24th international conference on Machine learning, pp. 1159–1166, ACM, 2007.
- [16] A. Kumar and H. Daumé, “A co-training approach for multi-view spectral clustering,” in Proceedings of the 28th International Conference on Machine Learning (ICML-11), pp. 393–400, 2011.
- [17] A. Kumar, P. Rai, and H. Daume, “Co-regularized multi-view spectral clustering,” in Advances in neural information processing systems, pp. 1413–1421, 2011.
- [18] X. Wang, B. Qian, J. Ye, and I. Davidson, “Multi-objective multi-view spectral clustering via pareto optimization,” in Proceedings of the 2013 SIAM International Conference on Data Mining, pp. 234–242, SIAM, 2013.
- [19] R. Xia, Y. Pan, L. Du, and J. Yin, “Robust multi-view spectral clustering via low-rank and sparse decomposition.,” in AAAI, pp. 2149–2155, 2014.
- [20] X. Cai, F. Nie, and H. Huang, “Multi-view k-means clustering on big data.,” in IJCAI, pp. 2598–2604, 2013.
- [21] W. Tang, Z. Lu, and I. S. Dhillon, “Clustering with multiple graphs,” in Data Mining, 2009. ICDM’09. Ninth IEEE International Conference on, pp. 1016–1021, IEEE, 2009.
- [22] J. Liu, C. Wang, J. Gao, and J. Han, “Multi-view clustering via joint nonnegative matrix factorization,” in Proceedings of the 2013 SIAM International Conference on Data Mining, pp. 252–260, SIAM, 2013.
- [23] X. Zhang, L. Zong, X. Liu, and H. Yu, “Constrained nmf-based multi-view clustering on unmapped data,” in AAAI, pp. 3174–3180, 2015.
- [24] X. Liu, S. Ji, W. Glänzel, and B. De Moor, “Multiview partitioning via tensor methods,” IEEE Transactions on Knowledge and Data Engineering, vol. 25, no. 5, pp. 1056–1069, 2013.
- [25] Y. Jiang, F.-L. Chung, S. Wang, Z. Deng, J. Wang, and P. Qian, “Collaborative fuzzy clustering from multiple weighted views,” IEEE transactions on cybernetics, vol. 45, no. 4, pp. 688–701, 2015.
- [26] C.-D. Wang, J.-H. Lai, and S. Y. Philip, “Multi-view clustering based on belief propagation,” IEEE Transactions on Knowledge and Data Engineering, vol. 28, no. 4, pp. 1007–1021, 2016.
- [27] D. Greene and P. Cunningham, “Multi-view clustering for mining heterogeneous social network data,” in Paper presented at the Workshop on Information Retrieval over Social Networks, 31st European Conference on Information Retrieval (ECIR’09), Toulouse, France, April 6-9, 2009, 2009.
- [28] L. Tang, X. Wang, and H. Liu, “Community detection via heterogeneous interaction analysis,” Data mining and knowledge discovery, vol. 25, no. 1, pp. 1–33, 2012.
- [29] V. D. Blondel, J.-L. Guillaume, R. Lambiotte, and E. Lefebvre, “Fast unfolding of communities in large networks,” Journal of Statistical Mechanics: Theory and Experiment, vol. 2008, no. 10, p. P10008, 2008.
- [30] G. Csardi and T. Nepusz, “The igraph software package for complex network research,” InterJournal, Complex Systems, vol. 1695, no. 5, pp. 1–9, 2006.
- [31] A. Hagberg, P. Swart, and D. S Chult, “Exploring network structure, dynamics, and function using networkx,” tech. rep., Los Alamos National Lab.(LANL), Los Alamos, NM (United States), 2008.
- [32] M. E. J. Newman, “Modularity and community structure in networks,” Proceedings of the National Academy of Sciences, vol. 103, pp. 8577–8582, Jun 2006.
- [33] M. Chen, K. Kuzmin, and B. K. Szymanski, “Community detection via maximization of modularity and its variants,” IEEE Transactions on Computational Social Systems, vol. 1, no. 1, pp. 46–65, 2014.
- [34] F. Erlandsson, R. Nia, M. Boldt, H. Johnson, and S. F. Wu, “Crawling online social networks,” in Network Intelligence Conference (ENIC), 2015 Second European, pp. 9–16, IEEE, 2015.
- [35] M. Faloutsos, P. Faloutsos, and C. Faloutsos, “On power-law relationships of the internet topology,” in ACM SIGCOMM computer communication review, vol. 29, pp. 251–262, ACM, 1999.
- [36] A. Clauset, C. R. Shalizi, and M. E. Newman, “Power-law distributions in empirical data,” SIAM review, vol. 51, no. 4, pp. 661–703, 2009.
- [37] U. N. Raghavan, R. Albert, and S. Kumara, “Near linear time algorithm to detect community structures in large-scale networks,” Physical review E, vol. 76, no. 3, p. 036106, 2007.