Teesside University
Middlesbrough, UK
Integrating splice-isoform expression into genome-scale models characterizes
breast cancer metabolism
Abstract
Motivation: Despite being often perceived as the main contributors to cell fate and physiology, genes alone cannot predict cellular phenotype. During the process of gene expression, of human genes can code for multiple proteins due to alternative splicing. While most splice variants of a gene carry the same function, variants within some key genes can have remarkably different roles.
To bridge the gap between genotype and phenotype, condition- and tissue-specific models of metabolism have been constructed. However, current metabolic models only include information at the gene level. Consequently, as recently acknowledged by the scientific community, common situations where changes in splice-isoform expression levels alter the metabolic outcome cannot be modeled.
Results: We here propose GEMsplice, the first method for the incorporation of splice-isoform expression data into genome-scale metabolic models. Using GEMsplice, we make full use of RNA-Seq quantitative expression profiles to predict, for the first time, the effects of splice isoform-level changes in the metabolism of patients with different breast cancer types. We validate GEMsplice by generating cancer-versus-normal predictions on metabolic pathways, and by comparing with gene-level approaches and available literature on pathways affected by breast cancer.
GEMsplice is freely available for academic use at https://github.com/GEMsplice/GEMsplice_code.
Compared to state-of-the-art methods, we anticipate that GEMsplice will enable for the first time computational analyses at transcript level with splice-isoform resolution.
This is a pre-copyedited, author-produced version of an article accepted for publication in Bioinformatics following peer review. The version of record “C. Angione, ”Integrating splice-isoform expression into genome-scale models characterizes breast cancer metabolism”, Bioinformatics, btx562, 34(3):494-501, 2018” is available online at: https://academic.oup.com/bioinformatics/article-abstract/34/3/494/4107935.
1 Introduction
The increasing availability of multi-omic datasets has rapidly moved the focus of many research efforts from data collection to finding effective methods for data interpretation and analysis. In terms of biomedical results, this step is therefore currently considered more limiting than data collection itself [1].
Genes and their expression have been the subject of the vast majority of research studies in computational biology and bioinformatics. However, it is the interaction of genes, proteins, reactions, and metabolites (different omics) that shapes the behavior of a cell. When analyzing biological models, the classical pathway-based perspective has been replaced, in the last 20 years, by a network-based approach, therefore bypassing parametrization and need for kinetic data, and leading to the generation of genome-scale metabolic models. These models include thousands of biochemical reactions, often the full set of reactions known for a given organism, allowing for prediction of cell phenotype. In this regard, metabolism is the only biological system that can be fully modeled at genome-scale, and also the closest to the phenotype.
Metabolism is now considered as a driver, rather than a marker, of cancer onset and proliferation. In breast cancer, metabolic heterogeneity is one of the causes of poor clinical outcome: although being classified as a single disease, more than types of breast cancer exist. A genome-scale analysis of cancer metabolism captures many effects that could not be identified using standard data and gene expression analysis. Furthermore, a wide set of tools for the incorporation of cancer omic data into these models have been developed, making them suitable for integrating and interpreting the great amount of data that is being gathered on cancer metabolic alterations [2].
As mentioned above, reduced cost for data gathering and analysis has recently yielded a rapid increase in the amount of available omics data. RNA-Seq is now widely used to produce high-throughput data in more detail compared to microarrays, with a more accurate estimation of transcript levels. As a result, splice isoform expression levels are now becoming available in cancer studies, where the same gene can code for multiple proteins due to alternative RNA splicing before translation. Alterations of specific splice-isoform expression in some genes can constitute a biomarker for cancer metabolism. In humans, alternative splicing affects of multiexon genes [3].
However, to date, functional information included in most metabolic models refers to genes or proteins only. The idea exploited here is that splice isoform data can be readily integrated and used in conjunction with annotated genome-scale models in order to constrain and refine existing models. Although Recon1 [4] was the only human metabolic model that introduced isoform-level annotations for some genes through bibliographic research, it adopted a custom annotation for isoforms, and therefore did not allow any mapping to known identifiers from public databases. For these reasons, such annotations have been subsequently lost and then simply ignored, mapping transcriptomic data with gene-level resolution only [5]. Consequently, expression data at the splice-isoform level has been neglected or simply averaged within the same gene to approximate the expression at the gene level.
Nevertheless, especially in human metabolic models, the incorporation of splice isoforms is key to understanding complex diseases like cancer. In this regard, pyruvate kinase (PK) is a striking example. In fact, the switch to the second isoform of pyruvate kinase (PKM2) is considered essential for cancer growth [6]. Conversely, the switch from PKM2 to the main pyruvate kinase isoform (PKM1) is able to reverse the Warburg effect and could therefore constitute a therapeutic target. In general, these crucial isoform-level events, e.g. the switch to minor isoforms, which get overexpressed compared to the major isoform of a gene, cannot be captured by current metabolic models, as highlighted in a number of recent reviews [7, 8, 5, 9].
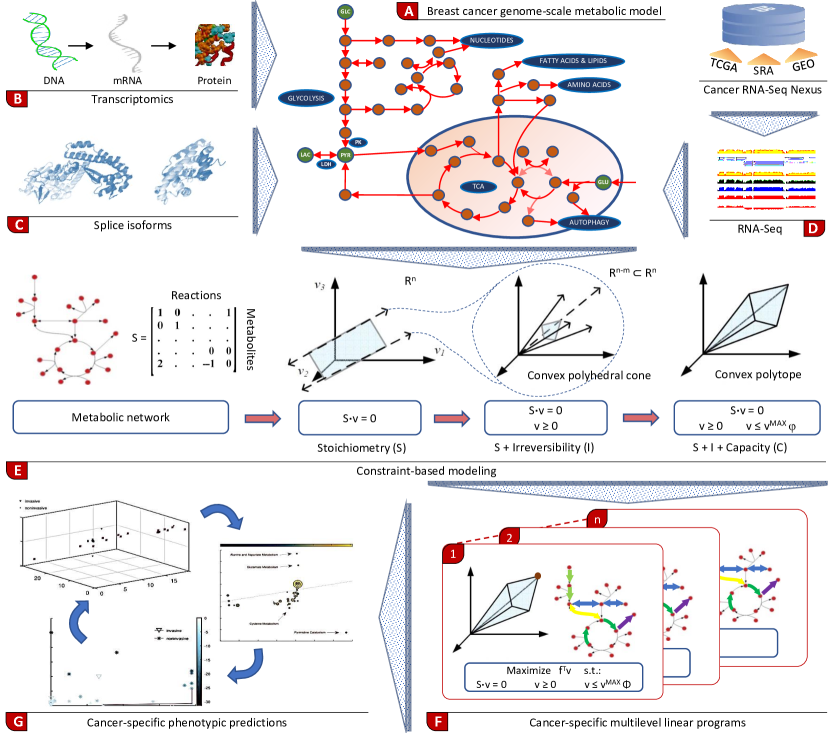
Here we propose GEMsplice (genome-scale metabolic modeling with splice-isoform integration), the first method for incorporating RNA-Seq data at the splice-isoform level into a metabolic model. The GEMsplice pipeline exploits, for the first time, the full potential of the next-generation sequencing technology in the context of genome-scale metabolic reconstructions. As a result, it enables more accurate predictions of human metabolic behavior and cancer metabolism. We show that GEMsplice compares favorably to existing tools for integration of transcriptomics data at the gene level only. We also validate GEMsplice by building breast cancer-versus-normal genome-scale models and by comparing predictions with available results on metabolic pathways affected by breast cancer. The full GEMsplice pipeline is illustrated in Figure 1. GEMsplice is made freely available in Matlab/Octave at https://github.com/GEMsplice/GEMsplice_code, and is fully compatible with the COBRA 2.0 Toolbox [10].
Beyond the Warburg effect: metabolism is a key player in cancer formation and progression
Known molecular markers of cancer can be associated with two main classes: (i) cell proliferation and (ii) tissue remodeling [13]. Cancer cells show higher rate of proliferation than normal cells in the tissue from which they originated. The main goal of metabolism in cancer cells is to keep cell viability and ensure new biomass production by acquiring nutrients from an environment where nutrients are often scarce. To this end, cancer cells exhibit a modified metabolism and an increased need for proteins, energy, nucleotides and lipids. The two main nutrients used by cancer cells are glucose and glutamine; both support cell growth and are used to build carbon intermediates, which are employed in a number of processes that build macromolecules.
The first difference between normal and cancer metabolism was observed in the 1920s by Otto Warburg [14]. Normal cells take up glucose and perform glycolysis to obtain pyruvate, which is then transferred to the mitochondrion and used by oxidative phosphorylation (OXPHOS) in the TCA cycle along with oxygen to efficiently produce ATP. Conversely, proliferating cancer cells require higher amount of glucose, but after obtaining pyruvate they preferentially use it to secrete lactate in the cytoplasm. Strikingly, this rather inefficient energy production pipeline is used also when the cell is exposed to oxygen. Preferential use of glycolysis allows faster proliferation but maximizes the secretion of lactic acid, which damages surrounding cells. This behavior, called Warburg effect or aerobic glycolysis, facilitates proliferation and migration of cancer cells.
However, a misinterpretation of this phenomenon by Warburg himself led to the enduring misconception that cancer cells do not use the TCA cycle to produce ATP. Indeed, it must be noted that the vast majority of cancer cells still use the mitochondrion and its TCA cycle to produce a fraction of the required ATP. In fact, in contrast to quiescent cells, glycolysis does not fuel directly the TCA cycle, but is essentially decoupled from it [15]. The advantage of converting excess pyruvate into lactate instead of transferring it into the mitochondrion is that high glycolytic activity can continue without leading to excessive flux through the electron transport system and consequent overproduction of reactive oxygen species (ROS), or excess ATP and NADH generation, which would in turn repress glycolysis. As a result of this decoupling, useful glycolytic intermediates (e.g., precursors of serine biosynthesis) can be generated at higher rates.
Pyruvate kinase (PK), the last step in the glycolytic pathway, is responsible for keeping the balance between the production of pyruvate for the mitochondrion (high PK activity) and the production of glycolytic intermediates for biosynthesis (low PK activity). This is achieved through the preferential expression of PKM1 or PKM2, two splice isoforms of PK whose activity respectively supports pyruvate or glycolytic intermediates for biosynthetic processes. In cancer phenotypes, being mostly controlled by the isoform PKM2, PK and its ATP product are independent of oxygen, therefore enabling ATP generation and growth during hypoxia (unlike mitochondrial respiration, which needs oxygen).
Glucose is not the only key nutrient for cancer cells. Proliferating cells can consume up to ten times more glutamine than any other amino acid. Glutamine is used as a carbon source for fatty acid synthesis, in biosynthetic pathways (especially the biosynthesis of nucleotides), and for TCA cycle intermediates (although as a secondary source, less than glucose). While in normal cells glucose/glutamine intake depends mainly on extracellular stimuli, mutations undergone by cancer cells confer the ability to proliferate with a high degree of independence, by constantly importing amino acids and glucose from the extracellular environment [16]. Taken together, these studies show that metabolism, once believed to be mainly a passive indicator of the state of a cell, is now widely recognized as a key player in cancer formation and progression.
2 Methods
Incorporating RNA-Seq data into a breast cancer model at the splice-isoform level
To model splice-isoform data in the breast cancer metabolic model, RNA-Seq expression profiles of breast cancer were considered from Cancer RNA-Seq Nexus [12], which provides phenotype-specific transcript expression levels in a variety of cancer types and stages. In Cancer RNA-Seq Nexus, data were processed as follows. For GEO/SRA samples, Bowtie [17] was used to align RNA-Seq reads to the reference human transcriptome from GENCODE [18]; eXpress [19] was then used to obtain FPKM isoform abundances. For TCGA samples, starting from Level 3 RNA-Seq v2 “tau values” quantified through RSEM [20], TPM values were obtained through multiplication by .
The expression values, at this point, are measured in FPKM for GEO/SRA, and in TPM for TCGA samples. FPKMs were then converted to TPMs using the following formula for all the expression values in each sample : , where is the sum of the FPKM values of all the transcripts in the th sample, and a sample-specific scaling factor accounting for the fact that the number of transcripts varies across the different samples, (number of transcripts in the largest sample)(number of transcripts in sample ). We remark that TPM (and not FPKM) expression values were used as a starting point to generate the metabolic outcome across samples because they are proportional to the abundance and independent of the mean expressed transcript length, therefore making them more suitable to comparisons across samples [20].
Transcript annotations in Cancer RNA-Seq Nexus consist of Ensembl and UCSC IDs. These were converted to RefSeq annotations using BioMart [21]. However, the breast cancer model is annotated only with gene-level Entrez IDs. To expand these and generate transcript-level IDs with splice-isoform resolution, RefSeq IDs for transcripts were retrieved from the SBML source of Recon1 using a custom script, as they were not included in the final Matlab version of the model (see File S1). These newly generated transcript-level RefSeq IDs and the gene-level default Entrez IDs of the remaining genes in the model were used to associate each transcript in the model with the corresponding expression value in the RNA-Seq cancer profiles. The profiles were finally mapped onto the breast cancer metabolic model (see Figure 1, and the following Methods subsection for details on how the mapping was achieved).
Phenotype predictions from RNA-Seq data
Breast cancer is a multifactorial disease and, as a result, breast cancer cells are intrinsically multi-target. To model this behavior and generate cancer-specific models from Cancer RNA-Seq Nexus, an extended flux balance analysis (FBA) framework was used, coupled with a multi-omic integration method and multi-level linear programming. Several approaches have been proposed and reviewed for the integration of gene expression data into FBA models [22, 23]. Each reaction in a FBA model is controlled by an associated gene set, defined through AND/OR Boolean operators between genes. In this work, METRADE [24] was used to constrain the upper- and lower- limits of each reaction as a function of the expression level of the gene set controlling the reaction.
Multiple cellular targets were modeled as a trilevel linear program:
| max | (1) | |||||
| such that | ||||||
| such that | ||||||
where is the stoichiometry matrix of the metabolic reactions in the cell, is the vector of reaction flux rates, while , , are Boolean vectors of weights selecting the three reactions in whose flux rate will be considered as objective. Lower- and upper-limits for the flux rates in in the unconstrained model are given by the vectors and . The vector represents the gene set expression of the reactions associated with the fluxes in . The expression level of a gene set is defined from the expression levels of its genes. According to the type of gene set, we define for single genes, for enzymatic complexes, and for isozymes. These rules were applied recursively in case of nested gene sets. To enable transcript-specificity, METRADE was also applied at the splice-isoform level, with annotations retrieved as above. The function maps the expression level of each gene set to a coefficient for the lower- and upper-limits of the corresponding reaction, and is defined as
| (2) |
Note that the vector notation was adopted, with the convention when some element of is . The sign operator returns a vector of (signs of ). models the reliability of the gene set expression level as an indicator of the rate of production of the associated enzyme.
One may argue that gene expression data is not a good proxy for protein abundance and ultimately for flux rates. However, gene expression data is certainly the omic data with better quality and coverage (almost always genome-scale). Furthermore, in mammals, mRNA levels can be considered the main contributors to the overall protein expression level [25, 26]. Positive correlation between mRNA and protein levels was also recently found in most normal and cancer cell lines [27]. We remark that, although GEMsplice natively handles absolute expression values, it can also handle fold-change values directly, by replacing the logarithmic map (2) with (see README file in the source code). Furthermore, our method is general and not dependent on a particular proxy. For instance, one may use protein abundances within the same approach proposed here. All simulations were carried out in Matlab R2016b and Octave 4.0.3, with the GLPK solver.
Modeling cancer biomarkers in multi-level linear programming.
The three objectives of the linear program in Equation (1) are chosen to model known mechanisms and key players in cancer metabolism. Here we consider: (i) the biomass (growth rate) reaction, (ii) pyruvate kinase (PK) and (iii) lactate dehydrogenase (LDH). (Note however that this is fully customizable in GEMsplice.) In our pipeline, we minimize the maximum allowed flux rate of PK as the second level of the trilevel linear program, selected through the vector . As a third (outer) level of our linear program, selected by the vector , we model the Warburg effect by minimizing the flux through LDH. In fact, a negative flux rate of this reversible reaction models the production of lactate from pyruvate. The first level (inner level), governed by the vector , is assigned to represent the maximization of the flux through the biomass reaction, modeling the observation that cancer cells grow and divide faster than normal cells in order to achieve their main goal, proliferation.
3 Results
GEMsplice maps RNA-Seq expression levels and splice isoforms onto a genome-scale model of breast cancer
GEMsplice maps RNA-Seq expression profiles to the metabolic model of breast cancer, using for the first time splice isoform annotations. A cohort of patients from Cancer RNA-Seq Nexus was taken into account with different breast cancer subsets, of which are invasive carcinomas at different stages. The subset classification is built from observation of genotype and phenotype, and can for instance refer to a specific type of stage of cancer, a disease state, or a particular cell line. To assess differences in the metabolic response among the different types and stages of breast cancer, we consider the average of RNA-Seq expression levels within the same cancer subset, and we finally map these to the phenotypic space of flux rates in the metabolic model using trilevel optimization (Figure 2, Figure LABEL:sup_fig:biomass_lactate_pyruvate and File S2; see Methods for details on how phenotype predictions are achieved from RNA-Seq data).
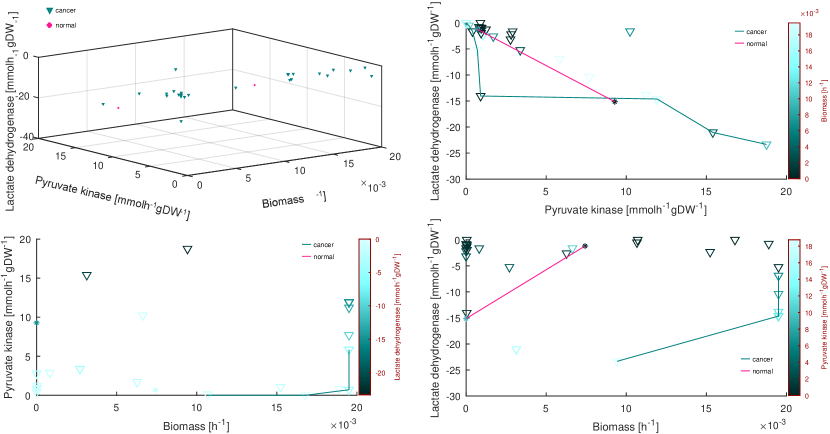
GEMsplice correctly predicts breast cancer cells to grow faster than normal healthy cells, while keeping comparable levels of PK activity. Some breast cancer cells are also predicted to use less PK compared to the healthy counterpart, leading to accumulation of intermediates in the glycolytic pathway, therefore fueling the serine biosynthesis pathway [28]. The trade-off between high and low PK flux might also explain the balance between PKM2 (limiting step, controlling PK flux) and PKM1 (promoting OXPHOS in the mitochondrion instead). The trade-off between LDH and PK in cancer cells is also lower than in normal cells in terms of negative flux rate values, consistent with the widely accepted evidence that cancer cells use the reverse direction of LDH to produce lactate from pyruvate (Warburg effect). When all the breast cancer subsets are considered, the bottom right panel shows a weak negative correlation between biomass and negative flux of lactate dehydrogenase (Pearson’s , , Spearman’s , ). These predictions are in keeping with the widely accepted fact that the amount of lactate production is positively correlated with tumor growth. More specifically, in breast cancer, a positive correlation has been highlighted between degree of malignancy, degree of mitochondrial structural abnormality [29], and the most common biomarkers of malignant tumor, e.g. intensive use of glycolysis and increased production of lactate [30].
Splice isoform expression-based flux control analysis
To further analyze the cancer-specific models, and to assess the role of the expression of splice isoforms in the model, we propose a steady-state control analysis based on transcript specificity. This method builds on the technique named metabolic control analysis [31], which considers the relationship between enzyme activity and flux rates. We adapt this analysis to assess the contribution of each splice isoform to the cellular goals.
As described above, flux rates in our model also depend on the expression level of splice isoforms. In each sample, a control analysis on flux rates with respect to these expression levels involves the estimation of the relation between fractional changes in the flux rates and fractional changes in the splice isoform expression. This can be written as a scaled partial derivative of the form
We here adopt an adjusted control coefficient by shrinking the sample-specific denominator towards its average across all the samples. As in the standard deviation correction for differential expression tests [32], our correction prevents gross overestimation of control coefficients. Without this correction, “false positives” would arise when is a very small value, irrespective of the numerator. More formally, to approximate this partial derivative, we separately take into account each splice isoform included in the breast cancer metabolic model, and we evaluate positive and a negative intermediate control coefficients and , defined as
| (3) |
where is small enough so that the ratio approximates the derivative; is the flux of interest (in our analysis, we focus on the three objectives of the linear program, namely biomass, PK and LDH). Then, for each flux and splice isoform of interest, we finally calculate the overall flux control coefficient as the maximum variation caused by a positive or negative perturbation of the isoform expression level:
| (4) |
These transcript- and cancer-specific coefficients evaluate the relative steady-state change in three pivotal flux rates in breast cancer cells, with respect to the relative change in the expression level of the transcript (see File S3). For our simulations, we set the denominator to avoid proportionality between the final control coefficient and the expression value itself, and . In general, the smaller the value chosen for , the more effective in approximating the scaled derivative of . Note that calculating a flux control coefficient for each splice isoform does not explicitly identify controlling transcripts, but rather provides an effective way to quantify their influence on the key flux rates in breast cancer cells.
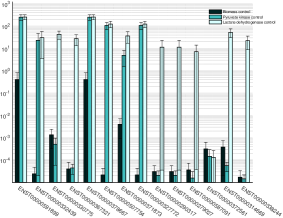
The most influential transcripts were selected independently for biomass, PK and LDH. The union of these three sets of ten transcripts, composed of transcripts, was chosen to perform further enrichment analysis through PANTHER [33]. A functional classification of each transcript was obtained using the “protein class” ontology, which is adapted from the PANTHER/X molecular function ontology and also includes Gene Ontology (GO) annotations. Interestingly, the selected transcripts are highly enriched for transmembrane transport and respiratory electron transport chain.
As shown in Figure 3a, the most effective transcript at controlling the value of biomass and LDH with a less stringent control on PK is ENST00000330775, a transcript of glucose-6-phosphate translocase (G6PT). In brain cancer, G6PT is a key player in transducing intracellular signaling events; modulating its expression has been proposed as an anti-cancer strategy [34]. Furthermore, our results suggest that PK and LDH are maximally and simultaneously controlled by ENST00000591899 and ENST00000378667, transcripts of ubiquinol-cytochrome c reductase, whose amplification was suggested to correlate with more aggressive breast cancer [35]. ENST00000507754 and ENST00000327772, transcripts of Complex I (whose activity is known to regulate breast cancer progression [36]), can control both PK and LDH without disrupting the growth rate. Although further experimental investigation is needed on these key transcripts, our genome-scale method may suggest for the first time transcript-specific targets for anti-cancer strategies.
Pathway-based flux analysis
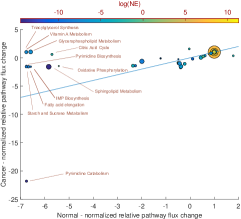
A pathway-based perspective has been often taken in genome-scale models with the aim of investigating sensitivity analysis [37, 38, 39], and coupled with Bayesian techniques to detect pathway crosstalks and temporal activation profiles [40]. To assess the variation in the average flux of each pathway with respect to the unconstrained breast cancer model, we here compute a normalized average pathway flux
| (5) |
where is the average flux in the th pathway across the different cancer subsets, while indicates the flux of the th pathway in the unconstrained breast cancer model. To account for the tolerance of the linear solver, average pathway fluxes of less than were assumed to be zero. Pathways, defined using the KEGG LIGAND database, were inherited from Recon1.
Figure 3b shows the indicator plotted for each pathway when computed across breast cancer cells and normal cells (results for invasive and unlabeled breast cells are shown in Figure LABEL:sup_fig:bubble_pathways). The least-square linear regression reveals a positive pathway flux correlation (Pearson’s , , Spearman’s , ). The eleven pathways indicated in the figure were detected as outliers, with significantly different behavior between cancer and normal breast cells.
To support our predictions, literature-based evidence of breast cancer alterations in such pathways was aggregated. Alanine and aspartate are byproducts of amino acid and glutamine fermentation, an important source for protein synthesis, especially when the cell lacks oxygen. Aspartate is also a main contributor to nucleotide and protein synthesis; the malate/aspartate shuttle pathway translocates electrons for the mitochondrial electron transport chain to produce ATP [41]. Perturbations in the citric acid cycle (TCA) were largely expected because ot the known “Warburg” reduction of glucose metabolism through the mitochondrion. Likewise, the prediction of altered fatty acid elongation metabolism is in keeping with recent studies reporting elongation of fatty acids as a marker in breast cancer [42].
GEMsplice also correctly predicts that pyrimidine biosynthesis pathways are downregulated in normal cells when compared to breast cancer cells [43]. Vitamin A and carbohydrate altered metabolism are also associated with breast cancer [44, 45]. In breast cancer cells, Inosine monophosphate (IMP) dehydrogenase inhibitors cause growth reduction and phenotypic alterations [46]. The prediction of starch and sucrose metabolism confirms previous genome-wide association studies, which reported significant relation between altered starch and sucrose pathway and the risk of developing ER-negative breast cancer [47]. Sphingolipids are responsible for oestrogen signaling and can control differentiation and proliferation of breast cancer cells [48]. The glycerophospholipid pathway, also flagged as biomarker by GEMsplice, was previously found altered in the metabolic phenotype of breast [49]. Finally, triacylglycerol was found to be a biomarker and a prognostic predictor of poor clinical outcome in triple negative breast cancer [50].
 |
|
|
| (a) | (b) | (c) |
Comparison with gene-level approaches
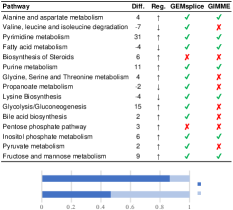
We here compare the results obtained by GEMsplice with GIMME [51], where expression levels are mapped to the model with gene-level resolution only. Present/absent calls for GIMME were obtained by applying zFPKM normalization [52]. To compare the pathway activity predicted by GEMsplice and GIMME in cancer conditions, we computed the average absolute value of flux rates in all nonzero biomass samples. As a benchmark for comparison and validation, we used the set of metabolic pathways found to be significantly upregulated and downregulated in unfavorable breast cancer conditions [53]. Pathways with equal number of upregulated and downregulated reactions were excluded from the analysis.
GEMsplice correctly predicts out of pathway overexpression/underexpression patterns, while GIMME only predicts out of (Figure 3c, and File S5). Three key pathways widely accepted to be dysregulated in breast cancer are correctly identified by GEMsplice, but incorrectly by GIMME: (i) glycolysis, highly upregulated in cancer, shows 3.44 cancer/normal fold change in GEMsplice, while 0.55 in GIMME; (ii) glycine, serine, and threonine metabolism, upregulated in cancer: 2.54 fold change in GEMsplice, 0.41 in GIMME; (iii) valine, leucine and isoleucine degradation, downregulated in cancer, 0.30 fold change in GEMsplice, 2.85 in GIMME.
The exact flux rates predicted for lactate dehydrogenase activity were also evaluated against the widely-accepted cancer “Warburg” metabotype. Ten cancer samples are incorrectly predicted by GIMME with zero or negligible () “Warburg” LDH flux (therefore not switching to aerobic glycolysis), while only three by GEMsplice. Furthermore, all non-malignant and normal cells with nonzero growth are correctly predicted by GEMsplice with lowest activity of LDH, while two out of four nonzero-growth normal or non-malignant tissues are incorrectly predicted by GIMME with a typical cancer metabotype, consisting of very high LDH activity. These examples suggest that integrating splice isoform information with metabolic models improves the characterization of breast cancer metabolism. With the current fast-paced improvements in speed and costs of omic profiling, and therefore with increasing availability of isoform-level model annotations and RNA-Seq data, we expect such specific differences to increase even further.
4 Conclusion
While the rate of acquisition of omics data is rapidly increasing, analyzing and extracting information through computational tools arguably remains the main bottleneck in biology. Most studies focus on statistical analysis on gene expression values to evaluate how they vary across different samples. However, modeling how the gene expression alterations change metabolic processes at genome scale provides greater understanding of the phenotypic outcome with respect to studies involving only transcriptomic data [54]. Given that the last decade in cancer research has repeatedly shown that cancer is a complex disease that cannot be studied by narrowing it down to a single gene or enzyme, a genome-wide metabolic approach seems therefore the right direction to assess and predict the phenotype of a cancer cell.
We here proposed GEMsplice, a method for linking gene expression and splice isoform data to genome-scale metabolic models. GEMsplice is the first attempt at solving one of the main issues of metabolic modeling: as outlined in recent reviews [9, 7, 8, 5], current methods only allow integration of omics data up to the gene level, but not with splice-isoform resolution.
The idea is that every single profile can be used to create a profile-specific model of metabolism that includes splice-isoform annotations. This integrated model can be readily used to predict the flux rate of any biochemical reaction included in the metabolic model, in a range of cancer subtypes. Individual profiles, patients or cells related to the same cancer can be mapped onto this model, for instance to cross-compare their metabolic behavior within the same cancer type, instead of cross-comparing cells using transcriptomics data only.
Although it allows mapping cancer-specific transcript expression levels onto any metabolic network, GEMsplice comes with limitations and room for improvement. For instance, if reaction-specific information is available, the map from genes to reaction flux bounds could be chosen in a reaction-specific manner and tailored to specific environmental or growth conditions. Likewise, post-transcriptional regulation of expression levels could be readily included in the model if available. On the other hand, inconsistencies can be used to improve the model and the associated biological knowledge on metabolic enzymes. For instance, incorrect predictions of specific flux rates may shed light on where post-transcriptional regulation take place [13]. A further development of cancer metabolic studies may involve a model that takes into account interactions between cancer cells and their environment, e.g. interactions with supporting cells. This approach will likely capture features that cannot be observed with models of single cancer cells.
Breast cancer is manifested through a variety of effects that cannot be reduced to a single feature. The difference in behavior of different cancer cells shows that reconstructing a generic model of a cancer cell is not a viable approach [55]. Models should therefore always be created in a tissue- and stage-specific fashion. We anticipate that GEMsplice will allow for the first time the generation of such models harnessing the full potential of RNA-Seq, and will facilitate in silico combinatorial experiments with RNA-Seq data. In fact, such omic-informed models can now effectively integrate information on the expression level of splice isoforms, to date largely ignored.
Acknowledgements
The author would like to thank Dr Jim Liu for discussions on Cancer RNA-Seq Nexus, and Dr Syed Haider for discussions on splice isoforms.
References
- [1] Zachary D Stephens, Skylar Y Lee, Faraz Faghri, Roy H Campbell, Chengxiang Zhai, Miles J Efron, Ravishankar Iyer, Michael C Schatz, Saurabh Sinha, and Gene E Robinson. Big data: astronomical or genomical? PLoS Biol, 13(7):e1002195, 2015.
- [2] Zhen Qi and Eberhard O Voit. Inference of cancer mechanisms through computational systems analysis. Molecular BioSystems, 13(3):489–497, 2017.
- [3] Qun Pan, Ofer Shai, Leo J Lee, Brendan J Frey, and Benjamin J Blencowe. Deep surveying of alternative splicing complexity in the human transcriptome by high-throughput sequencing. Nature genetics, 40(12):1413–1415, 2008.
- [4] Natalie C Duarte, Scott A Becker, Neema Jamshidi, Ines Thiele, Monica L Mo, Thuy D Vo, Rohith Srivas, and Bernhard Ø Palsson. Global reconstruction of the human metabolic network based on genomic and bibliomic data. Proceedings of the National Academy of Sciences, 104(6):1777–1782, 2007.
- [5] Jae Yong Ryu, Hyun Uk Kim, and Sang Yup Lee. Reconstruction of genome-scale human metabolic models using omics data. Integrative Biology, 7(8):859–868, 2015.
- [6] Nicholas Wong, Diane Ojo, Judy Yan, and Damu Tang. Pkm2 contributes to cancer metabolism. Cancer letters, 356(2):184–191, 2015.
- [7] Thomas Pfau, Maria Pires Pacheco, and Thomas Sauter. Towards improved genome-scale metabolic network reconstructions: unification, transcript specificity and beyond. Briefings in bioinformatics, 17(6):1060–1069, 2016.
- [8] Keren Yizhak, Barbara Chaneton, Eyal Gottlieb, and Eytan Ruppin. Modeling cancer metabolism on a genome scale. Molecular systems biology, 11(6):817, 2015.
- [9] Jun Geng and Jens Nielsen. In silico analysis of human metabolism: reconstruction, contextualization and application of genome-scale models. Current Opinion in Systems Biology, 2:28–37, 2017.
- [10] Jan Schellenberger, Richard Que, Ronan MT Fleming, Ines Thiele, Jeffrey D Orth, Adam M Feist, Daniel C Zielinski, Aarash Bordbar, Nathan E Lewis, Sorena Rahmanian, et al. Quantitative prediction of cellular metabolism with constraint-based models: the COBRA Toolbox v2.0. Nature protocols, 6(9):1290–1307, 2011.
- [11] Livnat Jerby, Lior Wolf, Carsten Denkert, Gideon Y Stein, Mika Hilvo, Matej Oresic, Tamar Geiger, and Eytan Ruppin. Metabolic associations of reduced proliferation and oxidative stress in advanced breast cancer. Cancer research, 72(22):5712–5720, 2012.
- [12] JR Li, CH Sun, W Li, RF Chao, CC Huang, XJ Zhou, and CC Liu. Cancer RNA-Seq Nexus: a database of phenotype-specific transcriptome profiling in cancer cells. Nucleic acids research, 44(D1):D944–51, 2016.
- [13] Elke Katrin Markert and Alexei Vazquez. Mathematical models of cancer metabolism. Cancer & metabolism, 3(1):1–13, 2015.
- [14] Otto Warburg, Franz Wind, and Erwin Negelein. The metabolism of tumors in the body. The Journal of general physiology, 8(6):519–530, 1927.
- [15] Adam D Richardson, Chen Yang, Andrei Osterman, and Jeffrey W Smith. Central carbon metabolism in the progression of mammary carcinoma. Breast cancer research and treatment, 110(2):297–307, 2008.
- [16] Lifang Yang, Sriram Venneti, and Deepak Nagrath. Glutaminolysis: A hallmark of cancer metabolism. Annual Review of Biomedical Engineering, 19(1), 2017.
- [17] Ben Langmead, Cole Trapnell, Mihai Pop, and Steven L Salzberg. Ultrafast and memory-efficient alignment of short dna sequences to the human genome. Genome biology, 10(3):R25, 2009.
- [18] Jennifer Harrow, Adam Frankish, Jose M Gonzalez, Electra Tapanari, Mark Diekhans, Felix Kokocinski, Bronwen L Aken, Daniel Barrell, Amonida Zadissa, Stephen Searle, et al. Gencode: the reference human genome annotation for the encode project. Genome research, 22(9):1760–1774, 2012.
- [19] Adam Roberts and Lior Pachter. Streaming fragment assignment for real-time analysis of sequencing experiments. Nature methods, 10(1):71–73, 2013.
- [20] Bo Li and Colin N Dewey. RSEM: accurate transcript quantification from rna-seq data with or without a reference genome. BMC bioinformatics, 12(1):323, 2011.
- [21] Damian Smedley, Syed Haider, Steffen Durinck, Luca Pandini, Paolo Provero, James Allen, Olivier Arnaiz, Mohammad Hamza Awedh, Richard Baldock, Giulia Barbiera, et al. The biomart community portal: an innovative alternative to large, centralized data repositories. Nucleic Acids Research, 43(W1):W589–W598, 2015.
- [22] Daniel Machado and Markus Herrgård. Systematic evaluation of methods for integration of transcriptomic data into constraint-based models of metabolism. PLoS Comput. Biol, 10:e1003580, 2014.
- [23] Supreeta Vijayakumar, Max Conway, Pietro Lió, and Claudio Angione. Seeing the wood for the trees: a forest of methods for optimization and omic-network integration in metabolic modelling. Briefings in Bioinformatics, bbx053, 2017.
- [24] C Angione and P Lió. Predictive analytics of environmental adaptability in multi-omic network models. Scientific Reports, 5:15147, 2015.
- [25] Jingyi Jessica Li, Peter J Bickel, and Mark D Biggin. System wide analyses have underestimated protein abundances and the importance of transcription in mammals. PeerJ, 2:e270, 2014.
- [26] Marko Jovanovic, Michael S Rooney, Philipp Mertins, Dariusz Przybylski, Nicolas Chevrier, Rahul Satija, Edwin H Rodriguez, Alexander P Fields, Schraga Schwartz, Raktima Raychowdhury, et al. Dynamic profiling of the protein life cycle in response to pathogens. Science, 347(6226):1259038, 2015.
- [27] Idit Kosti, Nishant Jain, Dvir Aran, Atul J Butte, and Marina Sirota. Cross-tissue analysis of gene and protein expression in normal and cancer tissues. Scientific reports, 6, 2016.
- [28] Jason W Locasale, Alexandra R Grassian, Tamar Melman, Costas A Lyssiotis, Katherine R Mattaini, Adam J Bass, Gregory Heffron, Christian M Metallo, Taru Muranen, Hadar Sharfi, et al. Phosphoglycerate dehydrogenase diverts glycolytic flux and contributes to oncogenesis. Nature genetics, 43(9):869–874, 2011.
- [29] RL Elliott, XP Jiang, and JF Head. Mitochondria organelle transplantation: introduction of normal epithelial mitochondria into human cancer cells inhibits proliferation and increases drug sensitivity. Breast cancer research and treatment, 136(2):347–354, 2012.
- [30] Michael J Gonzalez, Jorge R Miranda Massari, Jorge Duconge, Neil H Riordan, Thomas Ichim, Ana I Quintero-Del-Rio, and Norma Ortiz. The bio-energetic theory of carcinogenesis. Medical hypotheses, 79(4):433–439, 2012.
- [31] H Kacser, JA Burns, and DA Fell. The control of flux. Biochemical Society Transactions, 23(2):341–366, 1995.
- [32] Virginia Goss Tusher, Robert Tibshirani, and Gilbert Chu. Significance analysis of microarrays applied to the ionizing radiation response. Proceedings of the National Academy of Sciences, 98(9):5116–5121, 2001.
- [33] Huaiyu Mi, Sagar Poudel, Anushya Muruganujan, John T Casagrande, and Paul D Thomas. Panther version 10: expanded protein families and functions, and analysis tools. Nucleic acids research, 44(D1):D336–D342, 2016.
- [34] Anissa Belkaid, Ian B Copland, Duna Massillon, and Borhane Annabi. Silencing of the human microsomal glucose-6-phosphate translocase induces glioma cell death: potential new anticancer target for curcumin. FEBS letters, 580(15):3746–3752, 2006.
- [35] Yoko Ohashi, Saori J Kaneko, Tommy E Cupples, and S Robert Young. Ubiquinol cytochrome c reductase (uqcrfs1) gene amplification in primary breast cancer core biopsy samples. Gynecologic oncology, 93(1):54–58, 2004.
- [36] Antonio F Santidrian, Akemi Matsuno-Yagi, Melissa Ritland, Byoung B Seo, Sarah E LeBoeuf, Laurie J Gay, Takao Yagi, and Brunhilde Felding-Habermann. Mitochondrial complex i activity and nad+/nadh balance regulate breast cancer progression. The Journal of clinical investigation, 123(3):1068, 2013.
- [37] Edward Kent, Stefan Neumann, Ursula Kummer, and Pedro Mendes. What can we learn from global sensitivity analysis of biochemical systems? PloS one, 8(11):e79244, 2013.
- [38] J. Costanza, G. Carapezza, C. Angione, P. Lió, and G. Nicosia. Robust design of microbial strains. Bioinformatics, 28(23):3097–3104, 2012.
- [39] Max Conway, Claudio Angione, and Pietro Lió. Iterative multi level calibration of metabolic networks. Current Bioinformatics, 11(1):93–105, 2016.
- [40] Claudio Angione, Naruemon Pratanwanich, and Pietro Lió. A hybrid of metabolic flux analysis and Bayesian factor modeling for multi-omics temporal pathway activation. ACS Synthetic Biology, 4(8):880–889, 2015.
- [41] Claire Pecqueur, Lisa Oliver, Kristell Oizel, Lisenn Lalier, and François M Vallette. Targeting metabolism to induce cell death in cancer cells and cancer stem cells. International journal of cell biology, 2013, 2013.
- [42] Yin-Hsun Feng, Wei-Yu Chen, Yu-Hsuan Kuo, Chao-Ling Tung, Chao-Jung Tsao, Ai-Li Shiau, and Chao-Liang Wu. Elovl6 is a poor prognostic predictor in breast cancer. Oncology Letters, 12(1):207–212, 2016.
- [43] Frederic D Sigoillot, Severine M Sigoillot, and Hedeel I Guy. Breakdown of the regulatory control of pyrimidine biosynthesis in human breast cancer cells. International journal of cancer, 109(4):491–498, 2004.
- [44] Elena Doldo, Gaetana Costanza, Sara Agostinelli, Chiara Tarquini, Amedeo Ferlosio, Gaetano Arcuri, Daniela Passeri, Maria Giovanna Scioli, and Augusto Orlandi. Vitamin a, cancer treatment and prevention: the new role of cellular retinol binding proteins. BioMed research international, 2015, 2015.
- [45] Arvindhan Nagarajan, Parmanand Malvi, and Narendra Wajapeyee. Oncogene-directed alterations in cancer cell metabolism. Trends in Cancer, 2(7):365–377, 2016.
- [46] Y Sidi, C Panet, L Wasserman, A Cyjon, A Novogrodsky, and J Nordenberg. Growth inhibition and induction of phenotypic alterations in mcf-7 breast cancer cells by an imp dehydrogenase inhibitor. British journal of cancer, 58(1):61, 1988.
- [47] Jingmei Li, Keith Humphreys, Hatef Darabi, Gustaf Rosin, Ulf Hannelius, Tuomas Heikkinen, Kristiina Aittomäki, Carl Blomqvist, Paul DP Pharoah, Alison M Dunning, et al. A genome-wide association scan on estrogen receptor-negative breast cancer. Breast Cancer Research, 12(6):R93, 2010.
- [48] O Sukocheva and Carol Wadham. Role of sphingolipids in oestrogen signalling in breast cancer cells: an update. Journal of Endocrinology, 220(3):R25–R35, 2014.
- [49] Cristina Cadenas, Sonja Vosbeck, Eva-Maria Hein, Birte Hellwig, Alice Langer, Heiko Hayen, Dennis Franckenstein, Bettina Büttner, Seddik Hammad, Rosemarie Marchan, et al. Glycerophospholipid profile in oncogene-induced senescence. Biochimica et Biophysica Acta (BBA)-Molecular and Cell Biology of Lipids, 1821(9):1256–1268, 2012.
- [50] Danian Dai, Bo Chen, Bin Wang, Hailin Tang, Xing Li, Zhiping Zhao, Xuan Li, Xiaoming Xie, and Weidong Wei. Pretreatment tg/hdl-c ratio is superior to triacylglycerol level as an independent prognostic factor for the survival of triple negative breast cancer patients. Journal of Cancer, 7(12):1747, 2016.
- [51] Scott A Becker and Bernhard Ø Palsson. Context-specific metabolic networks are consistent with experiments. PLoS computational biology, 4(5):e1000082, 2008.
- [52] Traver Hart, H Kiyomi Komori, Sarah LaMere, Katie Podshivalova, and Daniel R Salomon. Finding the active genes in deep rna-seq gene expression studies. BMC genomics, 14(1):778, 2013.
- [53] Gunnar Schramm, Eva-Maria Surmann, Stefan Wiesberg, Marcus Oswald, Gerhard Reinelt, Roland Eils, and Rainer König. Analyzing the regulation of metabolic pathways in human breast cancer. BMC medical genomics, 3(1):39, 2010.
- [54] Claudio Angione, Max Conway, and Pietro Lió. Multiplex methods provide effective integration of multi-omic data in genome-scale models. BMC Bioinformatics, 17(4):257, 2016.
- [55] Pouyan Ghaffari, Adil Mardinoglu, Anna Asplund, Saeed Shoaie, Caroline Kampf, Mathias Uhlen, and Jens Nielsen. Identifying anti-growth factors for human cancer cell lines through genome-scale metabolic modeling. Scientific reports, 5, 2015.