Phase components in Zr7Ni10 and Hf7Ni10 binary alloys; investigations by perturbed angular correlation spectroscopy and first principles calculations
Abstract
Intermetallic compounds Zr7Ni10 and Hf7Ni10 have been studied by perturbed angular correlation (PAC) spectroscopy considering the fact that Zr7Ni10 has application as hydrogen storage material in fuel cell. In stoichiometric Zr7Ni10, the phase Zr2Ni7 is found to be dominant (38%) while a fraction of 25% is found for the Zr7Ni10 phase at room temperature. In this compound, a phase due to Zr8Ni21 (10%) is found from room temperature up to 773 K but, this is not found at 873 K and above. In the stoichiometric Hf7Ni10 sample, the phase due to Hf7Ni10 is found as a minor phase (22%) at room temperature. In this system, no phase of Hf2Ni7 is observed but, a different phase due to HfNi3 is found to be dominant (62%). It is found that the site fraction of Hf7Ni10 enhances with temperature at the expense of HfNi3 and this phase becomes predominant (57%) at 673 K and above. The change of phase fractions of HfNi3 and Hf7Ni10 with temperature is found to be reversible. The phase components in Zr7Ni10 and Hf7Ni10 have been determined also from X-ray powder diffraction (XRD) and transmission electron microscopy/selected area electron diffraction (TEM/SAED) measurements. Ab-initio calculations using the all electron full potential (linearized) augmented plane wave [FP-(L)APW] method, within the framework of the density functional theory (DFT), have been performed to determine the electric field gradients at the 181Ta impurity sites and therefrom to assign the different components observed from PAC measurements. Present experimental and calculated results of EFG support the space group for both Zr7Ni10 and Hf7Ni10 compounds.
keywords:
A. intermetallic compounds; C. ab initio calculations; C. X-ray diffraction; D. crystal structure; D. electronic structure1 Introduction
The alloys based on Zr-Ni system have numerous technological applications. These are used as an integral part to form high temperature eutectics [1], bulk glassy alloys [2, 3], corrosion resistant material [4, 3], shape memory alloys [5], superalloys [6, 7], superconductors [8]. Magnetic properties in the transition metal based Zr9Ni11 alloy was found earlier [9]. Some of the Zr-Ni binary alloys, viz. Zr8Ni21, Zr7Ni10, ZrNi and Zr9Ni11 [11, 12, 14, 13, 15, 16, 10] have received considerable attention due to their ability to absorb large amount of gaseous hydrogen and reversibility in hydrogen dissociation process. These alloys form metal hydrides (MH) after hydrogen absorption and these MHs are used as negative electrodes in Ni-MH rechargeable batteries. The Ni-MH batteries have been widely used in hybrid electric vehicles (HEV) due to their high energy density. Electrochemical capacity is found to be maximum for Zr7Ni10 among Zr-Ni binary alloys [14]. Recently, it has been found that the hydrogenation property of TiFe alloy is improved due to the addition of small fraction of Zr7Ni10 [17]. Another recent study [18] reported improvement in hydrogenation kinetics and capacity of Ti-V-Cr body centered cubic (BCC) solid solutions when Zr7Ni10 was used as an additive. The Hf-Ni alloys also have many technological applications. The alloys of Ni-Ti-Hf exhibit shape memory behavior [19]. Intermetallic compounds of Hf and transition metals (Fe, Co, Pd, Pt) have also hydrogen storage properties [20], with high H/M ratio at room temperature.
Considering the above technological applications of these compounds, Zr7Ni10 and Hf7Ni10 binary alloys have been studied by perturbed angular correlation (PAC) spectroscopy to determine the phase components produced in the stoichiometric samples and their stabilities with temperature. To the best of our knowledge, no previous investigation in Zr7Ni10 was done by PAC spectroscopy. In Hf7Ni10, however, PAC measurements were carried out by Gil et al. [21]. These authors found five electric quadrupole frequencies from PAC measurements. But, the components were not assigned by comparing with DFT calculations.
The crystal structure of Zr7Ni10 was first reported to be a non-centrosymmetric orthorhombic structure with space group by Kirkpatrick et al. [22]. Later on, Joubert et al. [23] corrected the crystal structure to be centrosymmetric orthorhombic structure with space group . The compound Hf7Ni10 is reported to be isostructural with Zr7Ni10 [23, 22, 24].
The perturbed angular correlation is an useful nuclear technique to study the structural properties, phase transitions, crystalline defects and magnetic ordering in intermetallic compounds [39]. In this technique, the angular correlation of a suitable - cascade of the probe nucleus is perturbed by hyperfine interaction. The nuclear moments (electric quadrupole moment/magnetic dipole moment) of the probe nucleus interact with hyperfine fields (electric field gradient/magnetic field) present at the probe site in the investigated sample. The electric field gradient (EFG) at the probe site is created by the surrounding charge distribution with a non-cubic symmetry and it is sensitive to the change of local electron density. Production of multiple phases in intermetallic alloys can be identified by this technique from the observation of different EFGs in the sample. Phase stability of compounds can be observed from temperature dependent PAC measurements. Internal magnetic field of a ferromagnetic material can be determined through the measurement of Larmor precession frequency. Using this technique, EFGs and magnetic ordering in Hf/Zr-Ni systems were studied earlier [25, 26, 61, 28, 29, 30, 32, 33, 31]. Recently we have studied two Zr-Ni compounds which have hydrogen storage properties. These are Zr8Ni21 [34], Zr9Ni11 [36]. In the present report, studies in another hydrogen absorbing material viz. Zr7Ni10 and its Hf analogue compound have been carried out by PAC, X-ray diffraction (XRD) and transmission electron microscopy/selected area electron diffraction (TEM/SAED) techniques.
Present investigations have been carried out to determine the phases components in these alloys. Temperature dependent PAC measurements in the range 77-1073 K have been carried out to determine the phase stability. Assignment of phases and site preference of the probe atom have been done by comparing the measured values of EFG with the calculated results by density functional theory.
2 Experimental details
The intermetallic alloys Zr7Ni10 and Hf7Ni10 were prepared by arc-melting high purity Hf, Zr and Ni metals in stoichiometric amounts in an argon atmosphere. These metals were procured from Alfa Aesar. The purity of Zr was 99.2% excluding Hf (maximum Hf concentration 4.5 wt%) and the purity of Hf was 99.95% excluding Zr (maximum Zr concentration 3 wt%). The purity of Ni used was 99.98%. For preparation of Zr7Ni10, stoichiometric amounts of Zr and Ni were taken and melted homogeneously in the arc furnace by repeated melting. A shiny globule of Zr7Ni10 was formed which was then remelted with a tiny piece (1 at%) of natural Hf metal wire. The sample was then activated to 181Hf by irradiating with thermal neutrons using a flux of 1013/cm2/s at Dhruba reactor, Mumbai. For preparation of Hf7Ni10, a tiny Hf metal (1 at%) was first activated to 181Hf. The active Hf metal sample was then remelted with the sample Hf7Ni10, prepared in the arc furnace. The probe 181Hf resides at the Zr sites for Zr7Ni10 sample due to their chemical and structural similarity. In Hf7Ni10, the probe replaces identical Hf atoms. These samples were then sealed in evacuated quartz tubes for PAC measurements at high temperatures. Inactive samples of Zr7Ni10 and Hf7Ni10 were prepared separately in the arc furnace in a similar manner for XRD and TEM/SAED measurements. The XRD measurements were carried out by TTRAX-III x-ray diffractometer (Rigaku, Japan) using the Cu Kα radiation. Transmission electron microscopy (TEM) measurements were carried out using FEI, Tecnai G2 F30, S-Twin microscope equipped with a high angle annular dark-field (HAADF) detector, a scanning unit and a energy dispersive X-ray spectroscopy (EDX) unit to perform the scanning transmission electron microscopy (STEM-HAADF-EDX).
In the PAC technique, the probe 181Hf undergoes a decay (=42.4 d) to 181Ta and emits two successive -rays of energy 133 keV and 482 keV passing through an intermediate level (482 keV) with =10.8 ns and spin angular momentum [37]. The angular correlation of 133-482 keV - cascade is perturbed by the interaction of electric quadrupole moment (=2.36 b [38]) of the intermediate level and the surrounding EFG.
The perturbation function for = 5/2 in a polycrystalline sample is given by [39, 40, 41],
| (1) |
The frequencies are the transition frequencies between the three sublevels of the intermediate level arising due to hyperfine splitting. The parameters depend on the asymmetry of the electric field gradient and these are expressed as a polynomial in asymmetry parameter (). Due to lattice strain or defects present in a real crystal, the probe may get displaced from the actual lattice site. Different probes are thus subjected to slightly different electronic and ionic environment in the same phase of the crystal. This effect is considered by an exponential (Lorntzian) distribution function where is mean frequency distribution width. A least squares fitting to eqn. (1) determines the quadrupole frequency () through the observed transition frequencies , and . In the principal axis system, the EFG tensor has zero off-diagonal elements. Conventionally, the largest component of the EFG tensor is designated as which is related to quadrupole frequency by
| (2) |
The principal EFG components (, and ) obey the Laplace’s equation
| (3) |
The symmetry of the EFG is determined by the asymmetry parameter , defined as
| (4) |
Therefore, EFG can be determined from only two parameters and . For , the perturbation function becomes periodic and harmonic, and the quadrupole frequency is related to the transition frequencies () by
| (5) |
When 0, the perturbation function remains periodic but not harmonic. The relations between and become more complex and can be found in the reference [41].
Present PAC measurements have been carried out using a four detector BaF2-BaF2 or a four detector LaBr3(Ce)-BaF2 PAC set up. The crystal sizes were 38.1(dia) 25.4(ht) mm2 for LaBr3(Ce) and 50.8(dia) 50.8(ht) mm2 for BaF2. In the LaBr3(Ce)-BaF2 setup, the 133 keV -rays were selected in the LaBr3(Ce) detector. Standard slow-fast coincidence assemblies were formed to collect data at 180∘ and 90∘ [42]. Typical prompt time resolutions (FWHM) of 1 ns and 790 ps were obtained at 181Hf energy window settings for the BaF2-BaF2 and LaBr3(Ce)-BaF2 setup, respectively. Details of experimental set up and data analysis can be found in reference [42].
| Temperature (K) | Component | (Mrad/s) | () | () | Specification | |
| 77 | 1 | 77.9(3) | 0.36(2) | 0.9(6) | 34(3) | Zr2Ni7 |
| 2 | 63.8(3) | 0.52(1) | 0 | 38(3) | Zr7Ni10 | |
| 3 | 8.0(4) | 0 | 0 | 28(3) | ||
| 298 | 1 | 72.7(3) | 0.12(4) | 1.1(7) | 38(3) | Zr2Ni7 |
| 2 | 58.9(3) | 0.71(1) | 0 | 25(3) | Zr7Ni10 | |
| 3 | 77.1(9) | 0.81(2) | 0 | 11(3) | Zr8Ni21 | |
| 4 | 8.0(7) | 0 | 0 | 17(3) | ||
| 5 | 33(1) | 0 | 0 | 9(3) | ||
| 373 | 1 | 70.7(5) | 0.23(5) | 0 | 25(3) | Zr2Ni7 |
| 2 | 57.9(3) | 0.70(2) | 0 | 21(3) | Zr7Ni10 | |
| 3 | 79(1) | 0.81(5) | 0 | 13(3) | Zr8Ni21 | |
| 4 | 6.7(3) | 0 | 0 | 28(3) | ||
| 5 | 32.7(8) | 0 | 0 | 13(3) | ||
| 473 | 1 | 69.4(2) | 0.20(3) | 0 | 21(3) | Zr2Ni7 |
| 2 | 56.6(2) | 0.74(1) | 0 | 19(3) | Zr7Ni10 | |
| 3 | 80(1) | 0.82(4) | 0 | 10(3) | Zr8Ni21 | |
| 4 | 5.7(2) | 0 | 0 | 32(3) | ||
| 5 | 32.3(5) | 0 | 0 | 17(3) | ||
| 573 | 1 | 67.4(2) | 0.12(4) | 0 | 34(3) | Zr2Ni7 |
| 2 | 54.4(3) | 0.80(1) | 0 | 26(3) | Zr7Ni10 | |
| 3 | 80(1) | 0.82(4) | 0 | 7(3) | Zr8Ni21 | |
| 4 | 7.7(5) | 0 | 0 | 24(3) | ||
| 5 | 34(1) | 0 | 0 | 9(3) | ||
| 673 | 1 | 65.4(2) | 0 | 0 | 31(3) | Zr2Ni7 |
| 2 | 52.5(5) | 0.85(2) | 0 | 21(3) | Zr7Ni10 | |
| 3 | 77(1) | 0.87(4) | 0 | 7(3) | Zr8Ni21 | |
| 4 | 5.9(3) | 0 | 0 | 30(3) | ||
| 5 | 32.9(9) | 0 | 0 | 11(3) | ||
| 773 | 1 | 63.0(2) | 0 | 1.2(4) | 29(3) | Zr2Ni7 |
| 2 | 47.9(4) | 0.86(1) | 0 | 19(3) | Zr7Ni10 | |
| 3 | 77(1) | 0.96(7) | 0 | 8(3) | Zr8Ni21 | |
| 4 | 5.3(2) | 0 | 0 | 29(3) | ||
| 5 | 31.7(5) | 0 | 0 | 15(3) | ||
| 873 | 1 | 62.4(2) | 0.18(4) | 0 | 37(3) | Zr2Ni7 |
| 2 | 44.7(9) | 0.93(9) | 0 | 18(3) | Zr7Ni10 | |
| 3 | 5.5(3) | 0 | 0 | 31(3) | ||
| 4 | 30(1) | 0 | 0 | 13(3) | ||
| 973 | 1 | 61.5(2) | 0.12(6) | 0 | 27(3) | Zr2Ni7 |
| 2 | 44.7(7) | 0.84(4) | 0 | 24(3) | Zr7Ni10 | |
| 3 | 4.0(2) | 0 | 0 | 31(3) | ||
| 4 | 28.4(8) | 0 | 0 | 17(3) | ||
| 1073 | 1 | 62.7(1) | 0.14(3) | 0 | 31(3) | Zr2Ni7 |
| 2 | 46.0(5) | 0.88(3) | 0 | 18(3) | Zr7Ni10 | |
| 3 | 4.6(1) | 0 | 0 | 35(3) | ||
| 4 | 29.9(5) | 0 | 0 | 15(3) | ||
| 298∗ | 1 | 73.1(3) | 0.12(7) | 0 | 35(3) | Zr2Ni7 |
| 2 | 59.8(7) | 0.65(4) | 0 | 31(3) | Zr7Ni10 | |
| 3 | 74(1) | 0.79(5) | 0 | 10(3) | Zr8Ni21 | |
| 4 | 7.3(6) | 0 | 0 | 17(3) | ||
| 5 | 32(2) | 0 | 0 | 6(3) |
∗ After measurement at 1073 K

3 Results and discussion
3.1 Zr7Ni10
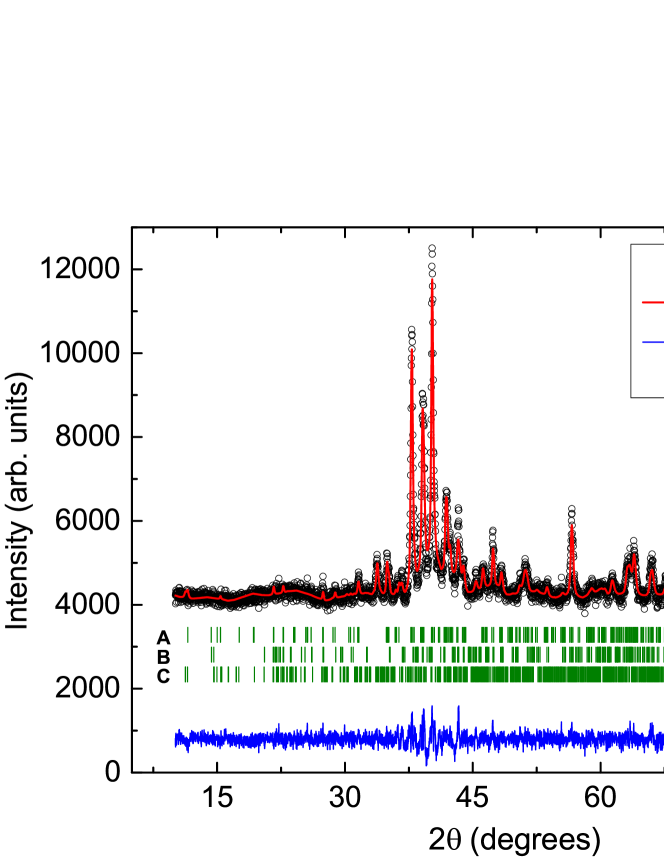
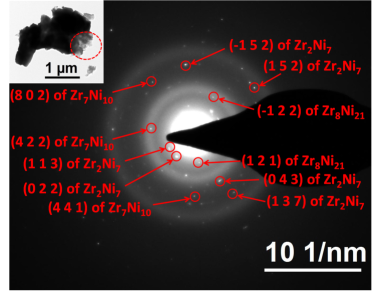
The XRD powder pattern obtained in stoichiometric Zr7Ni10 sample is shown in Figure 1. Peaks were first identified using ICDD database. The presence of orthorhombic Zr7Ni10 ([23], PDF Card No.: 01-072-3501), triclinic Zr8Ni21 ([43], PDF Card No.: 01-071-2622) and monoclinic Zr2Ni7 ([44], PDF Card No.: 01-071-0543) phases have been found from XRD analysis. The x-ray intensity profile has been fitted using FullProf software package [45]. The presence of Zr7Ni10, Zr2Ni7 and Zr8Ni21 phases in this stoichiometric sample of Zr7Ni10 have been observed from TEM/SAED measurement also (Figure 2). The SAED pattern obtained from a region marked by a dotted circle in the stoichiometric sample of Zr7Ni10 is shown in Figure 2. The interplaner spacing () is obtained by measuring the distance () of a particular spot from the central bright spot using the formula . Few of the measured from the SAED pattern are 1.47(4) Å, 2.26(4) Å and 1.81(4) Å. These measured interplaner spacings are very close to the (8 0 2), (4 2 2) and (4 4 1) inter-planer spacings of orthorhombic Zr7Ni10 (ICDD PDF Card No.:01-072-3501), respectively. This further confirms the presence of Zr7Ni10 phase in the sample. Some of the measured from the SAED pattern are 1.39(4) Å, 1.49(4) Å, 2.73(4) Å, 3.39(4) Å, 1.83(4) Å and 1.36(4) Å which are very close to the (-1 5 2), (1 5 2), (1 1 3), (0 2 2), (0 4 3) and (1 3 7) inter-planer spacings of monoclinic Zr2Ni7 (JCPDS 65-2321), respectively. The presence of Zr2Ni7 phase in the sample is thus confirmed. Few of the measured interplaner spacings from the SAED pattern, 2.34(4) Å and 3.38(4) Å, are found to be very close to the (-1 2 2) and (1 2 1) inter-planer spacing of triclinic Zr8Ni21 (ICDD PDF Card No.: 01-071-2622), respectively, which confirms the presence of Zr8Ni21 phase in the stoichiometric sample of Zr7Ni10.
The PAC spectrum in the stoichiometric Zr7Ni10 sample at room temperature is shown in Figure 3. The spectrum is found to be best fitted by considering five quadrupole frequencies. Texture effects are observed in the sample which indicates that the EFGs produced at the probe sites are not randomly oriented and it is not a perfect polycrystalline sample. Therefore, the spectrum is analyzed using free (=0,1,2,3) parameters. At room temperature, a major component ( 38%) is found with values of = 72.7(3) Mrad/s, = 0.12(4) and = 1.1(7)%. This component can be assigned to Zr2Ni7 by comparing with the results found in Zr2Ni7 [31]. In the stoichiometric ZrNi3 [35] and ZrNi5 [32] alloys also, the phase Zr2Ni7 was produced as a major component.
The second major component (Table 1) with values of = 58.9(3) Mrad/s, = 0.71(1) is attributed to Zr7Ni10 phase by comparing the result with our DFT calculation (discussed later). A minor component (11%) was found to be present with values of = 77.1(9) Mrad/s, = 0.81(2). This component has been identified as Zr8Ni21 by comparing the result with our recent PAC investigation in Zr8Ni21 [34] for Zr(1) crystallographic site. Apart from these components, two other minor frequency components (Table 1) have been found. These two components are attributed to defects. Since the activation of the sample was done after preparing the sample, crystalline defects can be produced by neutron irradiation [46]. From the Zr-Ni phase diagram, it is found that the phase Zr2Ni7 melts congruently and Zr8Ni21 phase is formed peritectically from Zr2Ni7 and liquid melt (L+Zr2Ni Zr8Ni21) at 1453 K [47]. The phases Zr7Ni10 and Zr8Ni21 are formed from liquid alloy by an eutectic reaction (LZr8Ni21+Zr7Ni10) [47] at 1333 K. The phase Zr7Ni10 is also formed by peritectic reaction from Zr9Ni11 and liquid melt (L + Zr9Ni Zr7Ni10) at 1393 K [48].
At 77 K, the Zr2Ni7 and Zr7Ni10 phases were found only (Table 1). All the three Zr-Ni phases, viz. Zr2Ni7, Zr8Ni21 and Zr7Ni10 are present in the temperature range 298-773 K (Table 1). At 873 K and above, the component due to Zr8Ni21 does not appear. The phases Zr2Ni7 and Zr7Ni10, however, remain stable up to 1073 K. The phase Zr2Ni7 is found to be predominant in the whole temperature range (77-1073 K) among the Zr-Ni binary phases that are produced in the stoichiometric sample of Zr7Ni10. The frequency values for the fourth and fifth components show anomalous temperature dependence (Table 1). This further indicates that these components are irregular defect components. A re-measurement is carried at room temperature after measurement at 1073 K. Here, all the three Zr-Ni phases, viz. Zr2Ni7, Zr7Ni10 and Zr8Ni21 produced with almost same fractions reversibly.
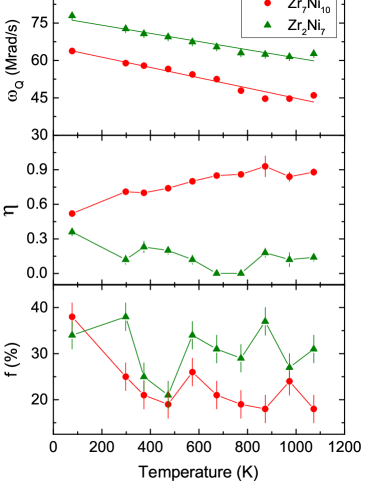
Temperature evolution of quadrupole frequency, asymmetry parameter and site fraction for two Zr-Ni phases, viz. Zr2Ni7 and Zr7Ni10 present in the stoichiometric sample of Zr7Ni10 are shown in Figure 4. The asymmetry parameter of Zr7Ni10 phase is found to increase with temperature. The quadrupole frequencies for both the components decrease linearly with temperature. The values of quadrupole frequencies obtained for Zr2Ni7 and Zr7Ni10 phases in the temperature range 77-1073 K have been fitted with the following relation
| (6) |
The fitted results give (0) = 65(1) Mrad/s ( = 7.3(2)1021 V/m2), = 3.1(3)10-4 K-1 for Zr7Ni10 component. For the Zr2Ni7 component, the results are (0) = 77(1) Mrad/s ( = 8.6(2)1021 V/m2), = 2.1(2)10-4 K-1. The linear temperature dependence of quadrupole frequency was observed in many intermetallic compounds [25, 50, 49, 52, 53, 51, 54].


3.2 Hf7Ni10
The XRD powder pattern in the Hf7Ni10 sample is shown in Figure 5. The peaks were identified using ICDD database, 2009. Presence of the hexagonal -HfNi3 ([55], PDF Card No.: 01-071-0475), orthorhombic Hf7Ni10 [22], and triclinic Hf8Ni21 ([56], PDF Card No.: 01-071-0476) phases are found in the stoichiometric Hf7Ni10 sample. Fitting of the XRD intensity profile has been carried out using FullProf software package [45]. The space group for Hf7Ni10 has been considered due to its isostructurality with Zr7Ni10 [22, 24]. Selected area electron diffraction (SAED) pattern obtained from a region marked by a dotted circle in the stoichiometric sample of Hf7Ni10 is shown in Fig. 6. Some of the measured interplaner spacing from the SAED pattern are 1.41(4) Å, 2.27(4) Å and 2.01(4) Å which are found to be very close to the (2 0 12), (2 0 1) and (2 0 5) inter-planer spacings of hexagonal -HfNi3 (JCPDS 71-0475). This further confirms the presence of HfNi3 phase in the sample. Few of the interplaner spacing from the SAED pattern are 1.70(4) Å and 1.82(4) Å. These are found to be very close to the (0 3 4) and (-2 -2 2) interplaner spacings of triclinic Hf8Ni21 (JCPDS 71-0476). The phase Hf7Ni10 could not be identified from SAED pattern in the stoichiometric sample of Hf7Ni10 due to non-availability of x-ray diffraction data of interplaner spacings () and corresponding crystallographic planes () for Hf7Ni10.
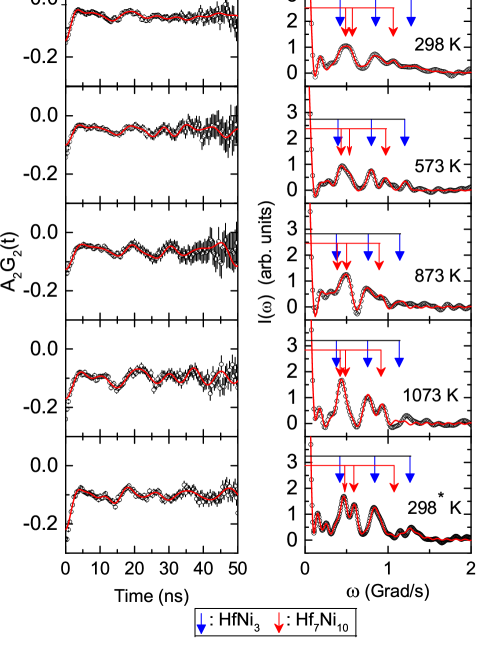
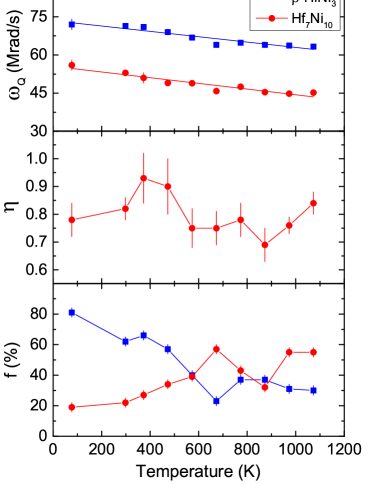
The PAC spectrum at room temperature in the stoichiometric Hf7Ni10 sample is shown in Figure 7. Fitting of the spectrum shows the presence of three quadrupole frequency components. Analysis of the spectrum has been carried out using free (=0,1,2,3) parameters as the sample is found to have texture effects. The predominant component ( 62%) produces values of = 71.4(9) Mrad/s, = 0, = 11(2)%. This component has been assigned to -HfNi3 by comparing the values with the results from our recent PAC investigation in HfNi3 sample [35] for Hf(3) crystallographic site. The second component produces values of = 53(1) Mrad/s, = 0.82(4) with site fraction 22%. This component has been assigned to Hf7Ni10 by comparing the values with the results found in the analogous Zr7Ni10 phase (Table 1) and with the results from DFT calculations (discussed later). A minor component (16%) with values of = 32(1) Mrad/s, = 0 was also found to be present. The value of quadrupole frequency for this component varies with temperature in an irregular manner and suggests that this is a crystalline defect produced during sample preparation. In the PAC sample, however, no component due to Hf8Ni21 was observed. In the Hf-Ni phase diagram, it is found that Hf2Ni7 and HfNi are congruently melting phases. The HfNi3 has two polymorphs, one is high temperature phase (-HfNi3) which is stable above 1473 K and the other is low temperature phase (-HfNi3) which is stable below 1473 K [57]. The phase HfNi3 is produced by peritectic reaction of liquid melt with Hf2Ni7 (L+Hf2NiHfNi3) at 1573 K. It was reported [58] that the phase Hf7Ni10 is produced by peritectic reaction L + Hf9Ni Hf7Ni10 [58] at 1563 K.
| Temperature (K) | Component | (Mrad/s) | () | () | Specification | |
| 77 | 1 | 72(2) | 0 | 11(3) | 81(3) | -HfNi3 |
| 2 | 56(2) | 0.78(6) | 0 | 19(3) | Hf7Ni10 | |
| 298 | 1 | 71.4(9) | 0 | 11(2) | 62(3) | -HfNi3 |
| 2 | 53(1) | 0.82(4) | 0 | 22(3) | Hf7Ni10 | |
| 3 | 32(1) | 0 | 0 | 16(3) | ||
| 373 | 1 | 71(1) | 0 | 7(2) | 66(3) | -HfNi3 |
| 2 | 51(2) | 0.93(9) | 0 | 27(3) | Hf7Ni10 | |
| 3 | 38(4) | 0 | 0 | 7(3) | ||
| 473 | 1 | 69(1) | 0 | 8(3) | 57(3) | -HfNi3 |
| 2 | 49(1) | 0.9(1) | 0 | 34(3) | Hf7Ni10 | |
| 3 | 33(3) | 0 | 0 | 9(3) | ||
| 573 | 1 | 66.8(6) | 0 | 0 | 40(3) | -HfNi3 |
| 2 | 48.9(9) | 0.75(7) | 0 | 39(3) | Hf7Ni10 | |
| 3 | 42(2) | 0 | 0 | 21(3) | ||
| 673 | 1 | 64.0(8) | 0 | 0 | 23(3) | -HfNi3 |
| 2 | 45.8(6) | 0.75(6) | 0 | 57(3) | Hf7Ni10 | |
| 3 | 45(2) | 0 | 0 | 20(3) | ||
| 773 | 1 | 64.8(7) | 0 | 0 | 37(3) | -HfNi3 |
| 2 | 47.5(7) | 0.78(6) | 0 | 43(3) | Hf7Ni10 | |
| 3 | 39(2) | 0 | 0 | 20(3) | ||
| 873 | 1 | 64.0(1) | 0 | 0 | 37(3) | -HfNi3 |
| 2 | 45.4(6) | 0.69(6) | 0 | 32(3) | Hf7Ni10 | |
| 3 | 40(2) | 0 | 0 | 30(3) | ||
| 973 | 1 | 63.7(4) | 0 | 0 | 31(3) | -HfNi3 |
| 2 | 44.8(4) | 0.76(3) | 0 | 55(3) | Hf7Ni10 | |
| 3 | 16(3) | 0 | 0 | 14(3) | ||
| 1073 | 1 | 63.3(4) | 0 | 0 | 30(3) | -HfNi3 |
| 2 | 45.2(5) | 0.84(4) | 0 | 55(3) | Hf7Ni10 | |
| 3 | 10(1) | 0 | 0 | 15(3) | ||
| 298∗ | 1 | 70.5(4) | 0 | 7(1) | 58(3) | -HfNi3 |
| 2 | 53.9(4) | 0.76(1) | 0 | 25(3) | Hf7Ni10 | |
| 3 | 15.9(9) | 0 | 0 | 16(3) |
∗ After measurement at 1073 K
At 77 K, the phase fraction of -HfNi3 component enhances to 81%. The site fraction of Hf7Ni10 increases while the site percentage of -HfNi3 phase decreases up to 673 K (Figure 8) with the increase of temperature. However, the phase -HfNi3 was found to be predominant up to 573 K (Table 2). The Hf7Ni10 phase becomes predominant (57%) and the phase fraction of -HfNi3 decrease to 23% at 673 K. In the temperature range 773-873 K, the phase fraction of Hf7Ni10 decreases and -HfNi3 increases to 37%. Major contribution (55%) in the PAC spectrum at 973 K and 1073 K was found due to the Hf7Ni10 phase and -HfNi3 phase fraction reduces to 30%. The PAC measurement was carried out at room temperature after measurement at 1073 K. Similar results of phase fractions of -HfNi3 and Hf7Ni10 at initial room temperature and after 1073 K (Table 2) show phase reversibility of the two phases.
Variation of quadrupole frequency (), asymmetry parameter () and phase fraction with temperature for -HfNi3 and Hf7Ni10 phases are shown in Figure 8. The quadrupole frequency for -HfNi3 and Hf7Ni10 phases decrease linearly with temperature following the Eqn. 6. Similar temperature dependence of was found in Zr7Ni10 which shows isostructurality of Zr7Ni10 and Hf7Ni10. The fitted results are (0) = 55.9(9) Mrad/s (=6.2(2)1021 V/m2), = 2.0(2)10-4 K-1 for the Hf7Ni10 phase. For -HfNi3 phase, the fitted results are (0) = 73.5(9) Mrad/s (=8.2(2)1021 V/m2), = 1.5(1)10-4 K-1.
4 DFT calculations and results
Zr7Ni10 and Hf7Ni10 crystallize in the orthorhombic base-centered centrosymmetric type structure (space group number 64) with lattice parameters =12.381 Å, =9.185 Å and =9.221 Å for Zr7Ni10 [23] and =12.275 Å, =9.078 Å, =9.126 Å for Hf7Ni10 [24]. This structure contains 34 atoms in the unit cell and possesses 7 non-equivalent crystallographic positions; 4 non-equivalent positions for Zr (or Hf) and 3 non-equivalent positions for Ni.
First we have optimized these structural parameters. The first-principles density functional theory (DFT) calculations were performed to compare with the experimental results. All the calculations were done using the full potential (linearized) augmented plane waves method [FP-(L)APW], as implemented in WIEN2k [59]. The energy convergence has been achieved by expanding the basis function up to =7, where is the smallest atomic sphere radius in the unit cell and gives the magnitude of the largest vector in the plane wave expansion. In our calculations the muffin-tin radii for Zr, Ni and Hf(Ta) were 2.2, 2.1 and 2.15 a. u., respectively. The valence wave functions inside the spheres are expanded up to =10 while the charge density is Fourier expanded up to =16. The energy to separate core and valence states was set to -7 Ry. Electronic exchange-correlation energy was treated with generalized gradient approximation (GGA) parametrized by Perdew-Burke-Ernzerhof (PBE) [60]. Taking into consideration both the accuracy and the efficiency of the calculations, we have selected a 888 point mesh to sample the entire Brillouin-zone (BZ), yielding 143 points in the irreducible Brillouin-zone. The structure was relaxed according to Hellmann-Feynman forces calculated at the end of each self-consistent cycle, until the forces acting on all atoms were less than 0.068 eV/Å (5 mRy/a.u.). The relaxation method is described in Ref. [61]. In our calculations the self-consistency was achieved by demanding the convergence of the integrated charge difference between last two iterations to be smaller than 10-5e. All the calculations refere to zero temperature.
The theoretically optimized lattice parameters , and , and fractional coordinates of atoms together with the present and previous experimental values [23, 24] are presented in Table 4. From Table 4 it can be seen that our calculated parameters are in very good agreement with the experimental results. After obtaining the optimized structural parameters, we replaced one of the host sites; i.e. one of the 4 non-equivalent positions of Zr (or Hf) by a Ta atom (preserving the point group symmetry around original atom), in order to simulate a dopant in the crystal lattice. This substitutional structures have been marked as X1-Ta, X2-Ta, X3-Ta and X4-Ta; X=Zr, Hf. For each case of the substitutional structure, we have repeated calculations again, keeping all parameters and charge convergence criteria same as in the case of the pure compounds. For example, to simulate PAC measurements at Zr1 position, we replaced one atom at position (0, 0.31359, 0.18707) with Ta atom. We checked that the two Ta atoms are sufficiently far from each other (8 Å) to avoid significant impurity-impurity interactions. The calculated electric field gradients (EFGs) in the pure compounds as well as at Ta probe positions in the Zr7Ni10 and Hf7Ni10 structures along with the values of asymmetry parameter , are given in Table 4. The sign of EFG () can not be determined from PAC measurement. Thus, absolute values of measured EFG (extrapolated to 0 K) and asymmetry parameter (at 77 K) for Zr7Ni10 and Hf7Ni10 have been compared with the theoretical results in the Table 4. The calculation of EFG were performed by using the method developed in Ref. [62]; which is implemented in WIEN2k code. All the calculations refer to zero temperature.
We see that the calculated result for EFG at the Ta probe site replacing Zr3 atom (6.991021 V/m2) with asymmetry parameter 0.54 is in excellent agreement with the measured value of EFG extrapolated to 0 K (7.3(2)1021 V/m2) and (77 K)=0.52(1) for the component Zr7Ni10, thus confirming that the mentioned component of the measured PAC spectra originates from Zr7Ni10. Similarly, the calculated result for EFG at the Ta probe site replacing Hf3 atom (6.371021 V/m2 ) with asymmetry parameter 0.77 is in excellent agreement with the measured value of EFG extrapolated to 0 K (6.2(2)1021 V/m2) and (77 K)=0.78(6) for the component Hf7Ni10, thus confirming that the mentioned component of the measured PAC spectra originates from Hf7Ni10.
| Present calculated results | Experimental results [23], [24] | Present experimental | |
| (WIEN2k) | (XRD) | results (XRD) | |
| Zr7Ni10 | |||
| 12.365 | 12.381 | 12.374 | |
| 9.172 | 9.185 | 9.173 | |
| 9.197 | 9.221 | 9.213 | |
| Zr1 | 0 0.31359 0.18707 | 0 0.31219 0.18847 | |
| Zr2 | 1/4 0.25466 1/4 | 1/4 0.25466 1/4 | |
| Zr3 | 0.30754 0 0 | 0.30634 0 0 | |
| Zr4 | 0 0 0 | 0 0 0 | |
| Ni1 | 0.14438 0.01115 0.20822 | 0.14438 0.01115 0.20822 | |
| Ni2 | 0.35507 0.29157 0.00833 | 0.35507 0.29157 0.00833 | |
| Ni3 | 0 0.10655 0.39553 | 0 0.10755 0.39423 | |
| Hf7Ni10 | |||
| 12.281 | 12.275 | 12.279 | |
| 9.062 | 9.078 | 9.071 | |
| 9.151 | 9.126 | 9.120 | |
| Hf1 | 0 0.31439 0.1867 | 0 0.31219 0.18847 | |
| Hf2 | 1/4 0.25504 1/4 | 1/4 0.25466 1/4 | |
| Hf3 | 0.30645 0 0 | 0.30634 0 0 | |
| Hf4 | 0 0 0 | 0 0 0 | |
| Ni1 | 0.14391 0.00998 0.20874 | 0.14438 0.01115 0.20822 | |
| Ni2 | 0.35507 0.29111 0.00665 | 0.35507 0.29157 0.00833 | |
| Ni3 | 0 0.10699 0.39569 | 0 0.10755 0.39423 |
| Probe | Lattice Site | calculated | calculated | Measured | Measured |
|---|---|---|---|---|---|
| site | EFG | EFG | (77 K) | ||
| Zr7Ni10 | |||||
| no probe | Zr1 | 1.11 | 0.63 | ||
| (pure compound) | Zr2 | 4.05 | 0.10 | ||
| Zr3 | -3.02 | 0.37 | |||
| Zr4 | -3.38 | 0.41 | |||
| 181Ta | Zr1-Ta | 1.33 | 0.77 | ||
| Zr2-Ta | 10.11 | 0.10 | |||
| Zr3-Ta | -6.99 | 0.54 | 7.3(2) | 0.52(1) | |
| Zr4-Ta | -10.75 | 0.25 | |||
| Hf7Ni10 | |||||
| no probe | Hf1 | -1.15 | 0.33 | ||
| (pure compound) | Hf2 | 9.48 | 0.18 | ||
| Hf3 | -4.96 | 0.82 | |||
| Hf4 | -8.94 | 0.32 | |||
| 181Ta | Hf1-Ta | 1.87 | 0.25 | ||
| Hf2-Ta | 9.75 | 0.10 | |||
| Hf3-Ta | -6.37 | 0.77 | 6.2(2) | 0.78(6) | |
| Hf4-Ta | -10.68 | 0.22 |
5 Conclusion
In stoichiometric Zr7Ni10 sample, the phases Zr2Ni7, Zr7Ni10 and Zr8Ni21 are produced where Zr2Ni7 is found as a major phase and a minor phase due to Zr8Ni21 is found at room temperature. In the stoichiometric Hf7Ni10 sample, the phases -HfNi3 and Hf7Ni10 are produced where the phase -HfNi3 is predominant at room temperature. The phase fraction of Hf7Ni10 increases with temperature at the expense of -HfNi3. At temperatures 400∘C, the phase Hf7Ni10 becomes predominant which indicates that it is a high temperature phase. However, these phase fractions are found to be reversible with temperature. Similar values of quadrupole frequency and asymmetry parameter indicate isostructurality of Zr7Ni10 and Hf7Ni10 phases. In both Zr7Ni10 and Hf7Ni10, four non-equivalent crystallographic sites of Zr/Hf have been found. Our experimental results of EFG and are in excellent agreement with the values of EFG at 181Ta sites corresponding to Zr3/Hf3 positions calculated by the first-principles density functional theory based on the full potential (linearized) augmented plane waves method [FP-(L)APW]. The origin of observed EFG in these materials can thus be explained.
Acknowledgement
The authors thankfully acknowledge Mr. A. Karmahapatra of Saha Institute of Nuclear Physics, Kolkata for X-ray diffraction measurements. The present work is supported by the Department of Atomic Energy, Government of India through the Grant no. 12-RD-SIN-5.02-0102 and by The Ministry of Education, Science and Technological Department of the Republic of Serbia through the Grant no. 171001.
References
- [1] Chandrasekhar Tiwary, Vilas V. Gunjal, Dipankar Banerjee, and Kamanio Chattopadhyay, MATEC Web of Conferences 14 (2014) 01005.
- [2] Y. Yokoyama, K. Fujita, A.R. Yavari and A. Inoue, Philosophical Magazine Letters 89 (2009) 322.
- [3] S.J. Pang, T. Zhang, K. Asami, Mat. Trans. 43 (2002) 1771.
- [4] Daniela Zander, Uwe Kster, Materials Science and Engineering A 375-377 (2004) 53.
- [5] Matthew Carl, Jesse D. Smith, Brian Van Doren and Marcus L. Young, Metals 7 (2017) 511.
- [6] J. Zhang and R.F. Singer, Metallurgical and Materials Transactions A 35A (2004) 1337.
- [7] V. Ivanchenko, T. Kosorukova, M. Samohin, S. Samohin, Yu. Butenko, Patent of Ukraine on useful model 26254 (2007).
- [8] Saad Alzahrani and Mahmud Khan, AIP Advances 7 (2017) 055706.
- [9] V. Provenzano, R.D. Shull, R.M. Waterstrat, L.H. Bennett, E. Della Torre and H. Seyoum, IEEE Trans. Magnetics 46 (2010) 502.
- [10] J.-M. Joubert, M Latroche, A. Percheron-Guégan, J. Alloys Compd. 231 (1995) 494.
- [11] F.C. Ruiz, E.B. Castro, S.G. Real, H.A. Peretti, A. Visintin, W.E. Triaca, Int. J. Hydrogen Energy 33 (2008) 3576.
- [12] J. Nei, K. Young, R. Regmi, G. Lawes, S.O. Salley, K.Y.S. Ng, Int. J. Hydrogen Energy 37 (2012) 16042.
- [13] Kwo Young, Taihei Ouchi, Michael A. Fetcenko, Willy Mays, Benjamin Reichman, Int. J. Hydrogen Energy 34 (2009) 8695.
- [14] Kwo-hsiung Young and Jean Nei, Materials 6 (2013) 4574.
- [15] F.C. Ruiz, E.B. Castro, H.A. Peretti, A. Visitin, Int. J. Hydrogen Energy 35 (2010) 9879.
- [16] K. Young, J. Nei, T. Ouchi, M.A. Fetcenko, J. Alloys Compd. 509 (2011) 2277.
- [17] Pragya Jain, N. Skryabina, D Fruchart, J. Huot, J Alloys Compd 636 (2015) 375.
- [18] Amol Kamble, Pratibha Sharma, Jacques Huot, Int. J. Hydrogen Energy 43 (2018) 7424-7429.
- [19] X.L. Meng, Y.D. Fu, W. Cai, Q.F. Li and L.C. Zhao, Phil. Mag. Lett. 89 (2009) 431.
- [20] A. Baudry, P. Boyer, L.P. Pontonnier, J. Phys. Conden. Matt. 4 (1992) 5025.
- [21] J.M. Gil, B. Costa, P. de Rango, D. Fruchart, S. Miraglia, N. Skryabina, Solid State Phenomena 170 (2011) 293.
- [22] M.E. Kirkpatrick, J.F. Smith, W.L. Larsen, Acta Cryst., 15 (1962) 894.
- [23] J.-M. Joubert, R. Černý, K. Yvon, M. Latroche, A. Percheron-Guégan, Acta Crystallogr. C 53 (1997) 1536.
- [24] P. Nash, A. Nash, Bulletin of Alloy Phase Diagrams 4 (1983) 250.
- [25] B. Wodniecka, M. Marszałek, P. Wodniecki, A.H. Hrynkiewicz, Hyperfine Interact. 80 (1993) 1039.
- [26] A.N. Poynor, S.E. Cumblidge, R.L. Rasera, G.L. Catchen, A.T. Mota, Hyperfine Interact. 136/137 (2001) 549.
- [27] A. Umícevíc, B. Cekíc, V. Ivanovski, V Koteski, J. Beloević-avor, M. iljegovíc, S. Pavlovíc, J. Alloys Compd. 475 (2009) 38.
- [28] B. Cekíc, A. Umícevíc, V. Ivanovski, V. Koteski, J. Beloević-avor, S. Pavlovíc, J. Alloys Compd. 480 (2009) 40.
- [29] M. Marszałek, H. Saitovitch, P.R.J. Silva, Z. Naturforsch. 55a (2000) 49.
- [30] P.R.J. Silva, H. Saitovitch, J.T. Cavalcante, M. Forker, J. Magn. Magn. Mater. 322 (2010) 1841.
- [31] C.C. Dey, S.K. Srivastava, Physica B 427 (2013) 126.
- [32] C. C. Dey, J. Mag. Mag. Materials 342 (2013) 87.
- [33] C.C. Dey, Rakesh Das, S.K. Srivastava, J. Phys. Chem. Solids 82 (2015) 10.
- [34] S.K. Dey, C.C. Dey, S. Saha, J. Beloević-avor, Intermetallics 84 (2017) 112.
- [35] S.K. Dey, C.C. Dey, S. Saha, J. Beloević-avor, D. Toprek, J. Alloys Compd. 723 (2017) 425.
- [36] S.K. Dey, C.C. Dey, S. Saha, J. Beloević-avor, D. Toprek (Communicated, Arxiv Id: 2100990).
- [37] R. B. Firestone, V. S. Shirley (Eds.), Table of Isotopes, 8th ed., John Wiley and Sons, New York, 1996.
- [38] T. Butz, A. Lerf, Phys. Lett. A 97 (1983) 217.
- [39] G. Schatz, A. Weidinger, Nuclear condensed matter physics, Nuclear Methods and Application, John Wiley and Sons, Chichester, New York, Brisbane, Toronto, Singapore, 1996, p. 63 (chapter 5).
- [40] R. Béraud, I. Berkes, J. Danire, G. Marest and R. Rougny, Nuclear Instruments and Methods, 69 (1969) 41-44.
- [41] M. Zacate and H. Jaeger, Defect Diffus. Forum 311 (2011) 3.
- [42] C. C. Dey, Pramana 70 (2008) 835.
- [43] J.-M. Joubert, R. Černý, K. Yvon, M. Latroche, A. Percheron-Guégan, Z. Krist. New Cryst. Struct. 213 (1998) 227.
- [44] F.R. Eshelman, J.F. Smith, Acta Cryst. B28 (1972) 1594.
- [45] J. Rodríguez-Carvajal, Phys. B 192 (1993) 55.
- [46] Cong Dai, Peyman Saidi, Zhongwen Yao, Mark R. Daymond, Acta Materialia, 140 (2017) 56.
- [47] P. Nash, C.S. Jayanth, Bulletin of Alloy Phase Diagrams 5 (1984) 144.
- [48] T. Kosorukova, V. Ivanchenko, G. Firstov and H. Noël, Solid State Phenomena, 194 (2012) 14.
- [49] P. Wodniecki, B. Wodniecka, A. Kulińska, M. Uhrmacher, K.P. Lieb, Journal of Alloys and Compounds 312 (2000) 17-24.
- [50] B. Wodniecka, M. Marszałek, P. Wodniecki, H. Saitovitch, P.R.J. da Silva, A.Z. Hrynkiewicz, J. Alloys Comp. 219 (1995) 132.
- [51] P. Wodniecki, B. Wodniecka, M. Marszałek, A.Z. Hrynkiewicz, Z. Naturforsch. 51a (1996) 437. ̵́
- [52] P. Wodniecki, B. Wodniecka, A. Kulińska, A.Z. Hrynkiewicz, Z. Naturforsch. 53a (1997) 355. ̵́
- [53] P. Wodniecki, A. Kulińska, B. Wodniecka, A.Z. Hrynkiewicz, Z. Naturforsch. 53a (1997) 349.
- [54] H.M. Petrilli, M. Marszałek, H. Saitovitch, Z. Naturforsch. 51 (1996) 437.
- [55] Lars Bsenko, Acta Cryst. B34 (1978) 3201.
- [56] Lars Bsenko, Acta Cryst. B34 (1978) 3204.
- [57] Lars Bsenko, J. Less-Common Metals, 63 (1979) 171.
- [58] Z. Kejun, J. Zhanpeng, J. Less-Common Met. 166 (1990) 21.
- [59] P. Blaha, K. Schwarz, G.K.H. Madsen, D. Kvasnicka and J. Luitz, WIEN2k an Augmented Plane Wave Plus Local Orbitals Program for Calculating Crystal Properties, Vienna University of Technology, Vienna, Austria, 2001.
-
[60]
(a) J.P. Perdew, K. Burke and M. Ernzerhof, Generalized Gradient Approximation Made Simple, Phys. Rev. Lett. 77 (1996) 3865.
(b) J.P. Perdew, K. Burke and M. Ernzerhof, Generalized Gradient Approximation Made Simple, Phys. Rev. Lett. 77 (1996) 3865. Erratum Phys. Rev. Lett. 78 (1997) 1396
(c) Y. Zhang and W. Yang, Phys. Rev. Lett. 80 (1998) 890. - [61] J. Beloević-avor, V. Koteski and J. Radaković, Solid State Communications 152 (2012) 107-1075.
- [62] P. Blaha, K. Schwarz and P. Herzig, Phys. Rev. Lett. 54 (1985) 1192.