Mass, radius, and composition of the transiting planet 55 Cnc e :
using interferometry and correlations
— a quick update
††journal: RNAAS
1 Introduction
In a recent paper (Crida et al., 2018, accepted on April 19, hereafter C18), we presented a method to derive the mass and radius of a transiting exoplanet and their intrinsic correlation. Measuring the stellar radius by interferometry and the stellar density by analysis of the transit lightcurve allows the derivation of the stellar mass, independently of any stellar evolution model. The planetary mass and radius are derived through their ratios with the stellar ones, given by the transit depth and the amplitude of the radial velocity signal , whose uncertainties degrade the correlation. We wrote : “More precise observations of the transit would be very useful in this particular case and would allow to increase significantly the gain on the [planetary] density precision.”
Three months later, Bourrier et al. (2018, hereafter B18) published new observations of the system. Additionally, Gaia’s DR2 was released on April 25, 2018. The purpose of this note is solely to implement these great new data in our pipeline to provide an up-to-date result of our model.
2 New derived stellar parameters
Gaia’s DR2 catalog (Gaia Collaboration et al., 2018) provides pc, making the distance used before ( pc) inaccurate.
B18 provide from their analysis of the transit lightcurve and day, from which we can derive (Seager & Mallén-Ornelas, 2003) , times more precise than what we used before ().
This gives
a bigger star than we thought ( and in C18). The mass-radius correlation is now versus in C18, due to the amazing precision on , thus on .
3 Planetary parameters
Using these new stellar parameters together with m/s and (B18) instead of m/s and in C18, we find
with a correlation and
instead of , , and .
The joint PDF of and is shown in the inset of Fig. 1 as black plain line contours. For comparison, the ones from C18 and B18 are shown as blue long-dashed and red dash-dotted contours respectively.
The other planetary parameters are derived using the model I by Dorn et al. (2017) as in our previous paper in the case OCA. Their PDFs are shown in Fig. 1. Here, we have used a more restricted prior on the gas metallicity ( ) that excludes hydrogen-dominated gas a priori. We find :
| log10(/Mp) | = | |
| = | ||
| log10() | = | |
| /Rp | = | |
| /Rp | = | |
| / | = | |
| = | ||
| = |
These values, using the most up-to-date observations of the system, should replace the ones published in our previous paper. As expected, more precise stellar distance (thanks to Gaia, Gaia Collaboration et al., 2016), transit depth and stellar density (thanks to B18) allow us to refine our estimate of all the planetary parameters. The almost twice better mass-radius correlation in particular doubles the precision on , which reaches uncertainty.
4 Discussion and conclusion
We do not find the same planetary mass and radius as B18, although we use their transit and radial velocity parameters.111For reference, Bourrier et al. (2018) give : , (uncorrelated) and . This is because they use the stellar radius and mass given by von Braun et al. (2011) based on the Hipparcos distance and stellar evolution models, while we use Ligi et al. (2016)’s angular diameter and Gaia’s parallax for the radius, and the measured stellar density for the mass. Another difference lies in the models used for the internal structure (model I from Dorn et al. (2017) here, and II in B18), but this only has a minor impact on the gas layer thickness.
The method developed in C18 proves very powerful for exoplanets transiting bright stars : observational data provide directly the mass, radius and density of 55 Cnc e, with a precision that allows to constrain significantly its internal structure. The observations by Gaia and B18 being at the best possible precision to date, our numbers can hardly be improved.
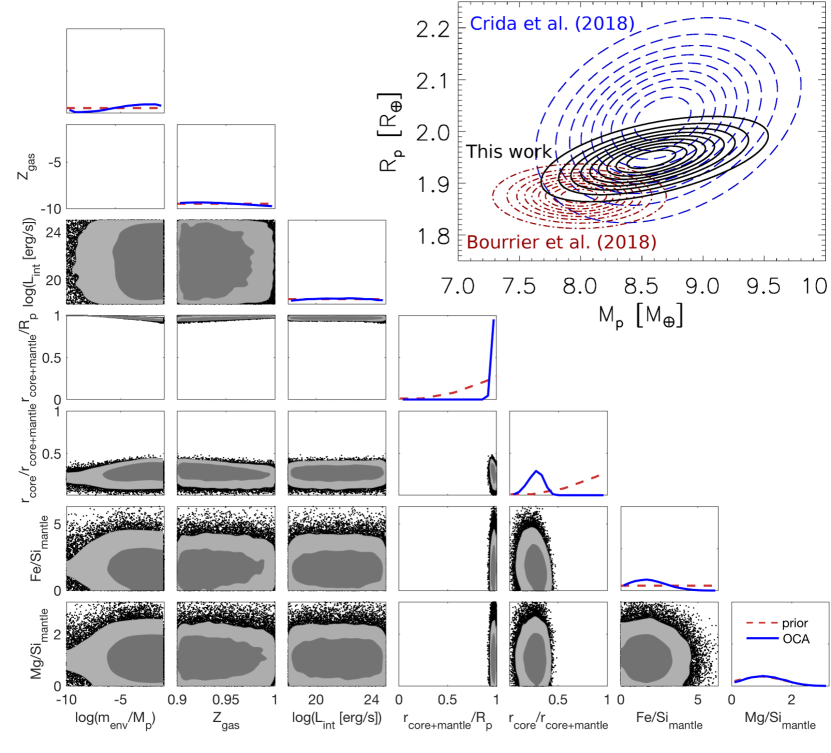
Other plots : Sampled two and one-dimensional marginal posterior for all interior parameters, same as figure 5 of C18.
References
- Bourrier et al. (2018) Bourrier, V., Dumusque, X., Dorn, C., et al. 2018, ArXiv e-prints. https://arxiv.org/abs/1807.04301
- Crida et al. (2018) Crida, A., Ligi, R., Dorn, C., & Lebreton, Y. 2018, ApJ, 860, 122, doi: 10.3847/1538-4357/aabfe4
- Dorn et al. (2017) Dorn, C., Venturini, J., Khan, A., et al. 2017, A&A, 597, A37, doi: 10.1051/0004-6361/201628708
- Gaia Collaboration et al. (2018) Gaia Collaboration, Brown, A. G. A., Vallenari, A., et al. 2018, ArXiv e-prints. https://arxiv.org/abs/1804.09365
- Gaia Collaboration et al. (2016) Gaia Collaboration, Prusti, T., de Bruijne, J. H. J., et al. 2016, A&A, 595, A1, doi: 10.1051/0004-6361/201629272
- Ligi et al. (2016) Ligi, R., Creevey, O., Mourard, D., et al. 2016, A&A, 586, A94, doi: 10.1051/0004-6361/201527054
- Seager & Mallén-Ornelas (2003) Seager, S., & Mallén-Ornelas, G. 2003, ApJ, 585, 1038, doi: 10.1086/346105
- von Braun et al. (2011) von Braun, K., Boyajian, T. S., ten Brummelaar, T. A., et al. 2011, ApJ, 740, 49, doi: 10.1088/0004-637X/740/1/49