A study of X-ray emission of galaxies hosting molecular outflows (MOX sample).
Abstract
We have carried out an extensive X-ray spectral analysis of a sample of galaxies exhibiting molecular outflows (MOX sample), to characterize the X-ray properties and investigate the effect of AGN on the dynamical properties of the molecular outflows. We find that the X-ray bolometric correction () of these sources ranges from to , with of the sources below , implying a weak X-ray emission relative to the AGN bolometric luminosity (). However, the upper limit on the luminosity () obtained from m flux, following the correlation derived by Asmus et al., are orders of magnitude larger than the values estimated using X-ray spectroscopy, implying a possibility that the MOX sources host normal AGN (not X-ray weak), and their X-ray spectra are extremely obscured. We find that both , and correlates strongly with the molecular outflow velocity as well as the mass outflow rates (), implying that the central AGN plays an important role in driving these massive outflows. However, we also find statistically significant positive correlations between the starburst emission and MO mass outflow rate, vs , and vs , which implies that starbursts can generate and drive the molecular outflows. The correlations of MO velocity and with AGN luminosities are found to be stronger compared to those with the starburst luminosities. We conclude that both starbursts and AGN play crucial role in driving the large scale MO.
Subject headings:
galaxies: Seyfert, X-rays: galaxies, AGN, Molecular outflows, X-ray, Galaxies, Feedback.1. INTRODUCTION
The tight correlation between the mass of the central super massive black hole (SMBH) and the stellar bulge velocity distribution points to a coevolution of black hole and its host galaxy over cosmological times (Ferrarese & Merritt, 2000; Gebhardt et al., 2000). However, the exact nature of the interaction is still not clearly understood. Energetic outflows detected in absorption and emission in different wavelength bands have been postulated to be important mechansims responsible for galaxy SMBH co-evolution (see for e.g., Fabian, 2012, and references therein).
With the advent of high spatial resolution IR and radio telescopes in the last couple of decades, we have made rapid progress in understanding the nature of the molecular outflows (MO), which are outflows detected using the broad CO(I-J) emission lines, OH absorption lines, HCN and SiO emission lines, and several other molecular tracers (Sturm et al., 2011; Aalto et al., 2012; Veilleux et al., 2013; Brusa et al., 2015; Feruglio et al., 2015; Stone et al., 2016; Brusa et al., 2018). In several cases where the host galaxies can be spatially resolved, the outflows have been found to extend to a few , and these are believed to be one of the most powerful mechanisms by which the SMBH deposits matter onto its host galaxy. The relation between the SMBH and MO, as well as the mechanism through which MO would interact with and deposit energy into the interstellar medium (ISM) are still poorly understood.
The effect of the central AGN on the scale MO is still debated. Several investigations (see for e.g., Sturm et al., 2011; Veilleux et al., 2013; Cicone et al., 2014) have revealed that the presence of an AGN in the host galaxy boosts the power of the MO. However, we still do not have a consensus on how the AGN interacts with the host galaxy molecular clouds and drives the outflows at scale. Tombesi et al. (2015) and Feruglio et al. (2015) have suggested that the ultra fast outflows (UFOs) detected in X-rays may interact with the ISM of the host galaxy and generate MO in an energy conserving way (Faucher-Giguère & Quataert, 2012; Zubovas & King, 2012). A more recent study by Fiore et al. (2017) have found tight correlations between the bolometric luminosity of the AGN with the mass outflow rates of molecular outflows.
X-ray emission from active galactic nuclei (AGN) probes the innermost energetic regions where matter is accreted onto a central SMBH. The emission from the accretion process for an SMBH of mass peaks in the UV, and these photons get inverse Comptonised by a corona in AGN to yield a powerlaw spectrum which extends into the hard X-rays. X-ray photons being less obscured by dust, is a good probe of the SMBH activity. In this work we carry out a systematic study of the X-ray spectral properties of the sources exhibiting molecular outflows (MOX sample hereafter). The main aim in this work is to characterise the X-ray properties of the MOX sample and investigate the effect of AGN on the dynamical properties of the MO. Several sources in the MOX sample are luminous in infra-red (See Section 2 for details). Previous studies on ultra luminous infra-red galaxies (ULIRGs) revealed that these galaxies are under-luminous in X-rays (Imanishi & Terashima, 2004). A recent hard X-ray survey of six nearby ULIRGS using NuSTAR data (Teng et al., 2015) revealed similar findings. The unabsorbed luminosity for these sources when compared with the bolometric luminosity of the AGN or the mid-IR [O IV] line luminosity, are found lower than that for Seyfert 1 galaxies. However, there are a few studies which have pointed out that the ULIRGs are not actually X-ray faint, but are extremely obscured. For example, a recent work on an ULIRG UGC 5101 (Oda et al., 2017) with NuSTAR and Swift BAT telescopes have revealed that the intrinsic luminosity of the source is , which is times larger than those obtained by previous estimates using X-ray spectra only up to . The new value of luminosity of UGC 5101 when compared with the luminosity of the m forbidden emission lines of [O IV], were found to be similar to Seyfert galaxies indicating that the source is not X-ray weak. Ricci et al. (2017) in a sample study of LIRGs and ULIRGs found that these sources are heavily obscured by dust and almost of the sources in their sample were Compton thick. We should clearly note that estimating the intrinsic X-ray luminosity in these massive dusty galaxies is not straight forward due to the largely unknown obscuration column density, and the unknown geometry and composition of the obscurer.
This paper aims at addressing the following important questions:
-
1.
Are the AGN in the galaxies hosting molecular outflows intrinsically X-ray weak?
-
2.
Is AGN the main driver of the large scale molecular outflows?
The paper is organized as follows: Section 2 describes the sample selection. It also includes the bolometric luminosity, the luminosity, and molecular outflow properties of the MOX sample. Section 3 describes the X-ray observations for the MOX sample. Section 4 describes the methods employed for data analysis. Section 5 describes the correlation analysis. Section 6 discusses the results from the extensive X-ray analysis, followed by conclusions in Section 7.
2. Sample description
We have selected a sample of 47 galaxies from published literature, which have exhibited molecular outflows, as on 20th October 2016. Table 1 lists the sources, their redshift and spectral classification based on previous optical and X-ray studies. Table 2 lists the MO velocity and the mass outflow rates (). These 47 sources define the MOX sample.
The molecular outflows detected in the MOX sample are either in the form of OH absorption lines at or CO rotational-vibrational emission line at GHz, CO(1-0), using several state-of-the-art IR and radio telescopes such as VLT-SINFONI, Herschel-PACS, ALMA, Noema, and IRAM-PDBI. For the sources IRAS 172080014 and NGC 1433, the MO properties were derived using the transitions CO(2-1) and CO(3-2) respectively (See Table 2 and Section 2.1 for details).
From Table 2 we find that four sources have CO as well as OH detections of MO. In all cases the velocity measured by the two different outflows are consistent within errors, except for the source IRAS 17208-0014, where the CO measured a velocity of while OH measured a velocity of . We consider only the highest velocity outflow in this case, which measures the maximum impact of the central engine on the host galaxy ISM. We should note that the OH absorption and the CO emission lines may be probing entirely different clumps of molecular gas at different locations in the host galaxy. However, we find that the distributions of MO velocity and mass outflow rates () estimated using OH absorption features or the CO emission lines are similar for the sources in the MOX sample. Hence, we treat the velocity and obtained using OH and CO methods on equal footings.
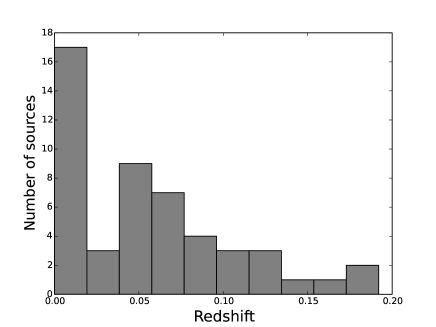
The MOX sample is not complete and can be biased towards infra-red bright objects as most of these are ULIRGS or LIRGs. Figure 1 left panel shows the distribution of the redshift of the galaxies in the sample, and we find that they are all in the local Universe ().
2.1. Molecular outflow properties of the sample.
As noted earlier, Table 2 lists the molecular outflow properties of the sources along with the references from which they have been derived. We briefly describe in this section the methods used by different authors to estimate the MO properties and the threshold they have set for detecting a MO.
Sturm et al. (2011) detected the MO using the OH absorption lines at and observed using Herschel-PACS telescope. The average error on the velocity estimated by the authors is . Veilleux et al. (2013) detected the MO using the OH absorption line observed using Herschel-PACS telescope. The average error on the velocity estimated by the authors is . The authors define a wind as an OH absorption profile whose median velocity () is more negative than with respect to the systemic velocity. In our work, we use the quantity as the outflow velocity. is the velocity above which of the absorption of the OH profile takes place. Cicone et al. (2014) studied the MO in a sample of galaxies using CO(1-0) emission lines at 115.271 GHz, observed by the IRAM-PDBI telescope. The authors have relied on the simultaneous detection of OH absorption as well as CO emission lines for a given galaxy to detect MO. In a few cases the authors could only put upper limits on velocity and hence could not effectively constrain the mass outflow rates. Stone et al. (2016) carried out a blind search for MO in a sample of 52 local Seyfert galaxies using the OH m absorption line with Herschel-PACS data, and detected MO in three sources.
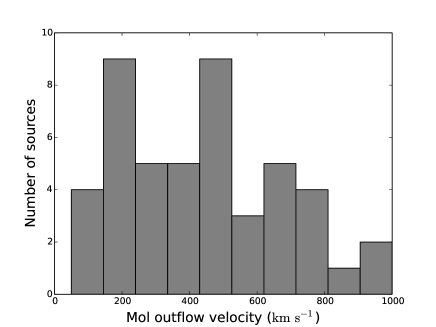
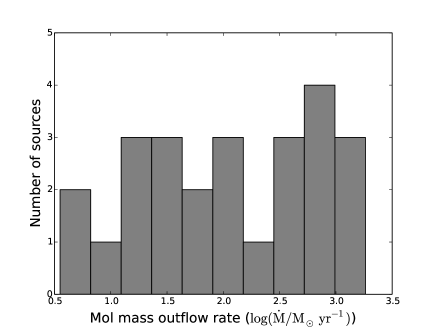
The MO velocities range from and the mass outflow rates . Figure 2 left panel shows the distribution of MO velocity and right panel shows the distribution of mass outflow rates. From Table 2 we note that the mass outflow rates of the MO are reported only for the first 27 sources, and for other sources they could not be calculated by the authors due to the lack of distance estimates, because of insufficient spatial resolution.
2.2. The bolometric luminosity of the sample.
The total bolometric luminosity of the host galaxies along with the references are listed in Table 7. The values of include the AGN as well as the stellar contribution from the host galaxies calculated using the integrated infra-red luminosity () and following the scaling relation (Cicone et al., 2014; Veilleux et al., 2013). We also list the AGN fraction, , for each source calculated using the IR flux ratios, (Veilleux et al., 2013). The bolometric luminosity of the central AGN is calculated as . The starburst luminosity from the galaxies are calculated using .
2.3. The 12 m luminosity of the sample
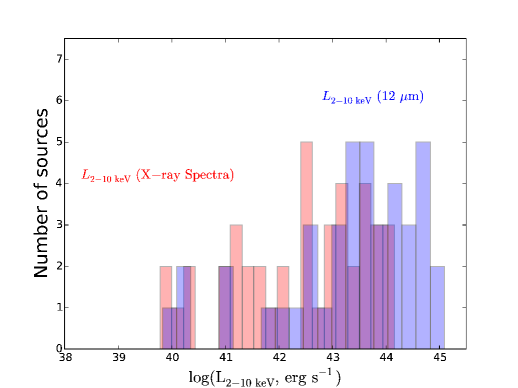
Gandhi et al. (2009) have found a strong correlation between the m luminosity from the inner core of active galaxies and the AGN X-ray luminosity (), indicating the effects of dust being heated by the central AGN which then re-emits in the IR. Thus the m luminosity can be used as a probe for the AGN emission for the MOX sources. However, obtaining the m flux of the spatially resolved inner core of the MOX galaxies is beyond the scope of the paper. Hence we use the m values quoted in NASA Extragalactic database (NED) obtained using the Infrared Astronomical Satellite (IRAS) observatory. Since this is the emission from the whole galaxy, we must remember that the m luminosity can have contributions from both the AGN and stellar emission. In order to obtain an estimate of the AGN contribution to the m emission we multiply the values obtained from NED by as described in the last section, and then use this quantity in the correlation in Asmus et al. (2015), given by, . However, we note that the obtained using this method is possibly an upper limit to the intrinsic AGN emission as there can be other mechanisms in the host galaxy contributing to the m flux (See Section 6.1 for a discussion). Table 6 lists the values of the obtained using this method. See Figure 3 left and right panels for a comparison of the estimated using the m luminosity and that directly measured via X-ray spectroscopy.
3. X-ray observations and data reduction
We have used broadband X-ray spectra from XMM-Newton EPIC-pn and Chandra ACIS CCD telescopes which give an energy coverage of and respectively. For sources where there are multiple observations, we have considered only the longest observation to maximize the signal to noise ratio irrespective of the flux or spectral state of the source. Table 3 shows the list of X-ray observations used for the MOX sample. All the data used in this work are publicly available in the XMM-Newton and Chandra archives.
The XMM-Newton EPIC-pn data were downloaded and reduced using the standard Scientific-Analysis-System (SAS) software, version 15. Calibrated and concatenated event lists for the EPIC-pn camera were generated using the SAS task epchain. Good time intervals for the accumulation of scientific products were defined as those with particle background count rate above . The source region was selected using a circle of radius 40 arcsec with the centre of the circle fixed to the RA and Dec of the source obtained from NED (NASA extragalactic database). The background regions were selected from regions away from the source but from the same CCD. There was no photon pile up for any of the sources, which we checked using the command epatplot.
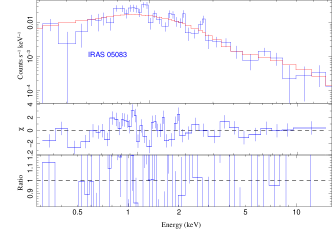
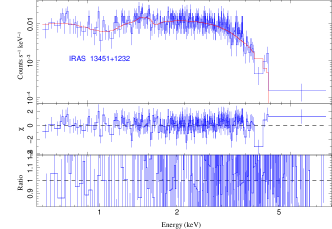
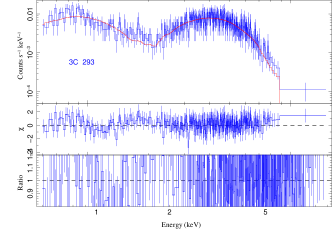
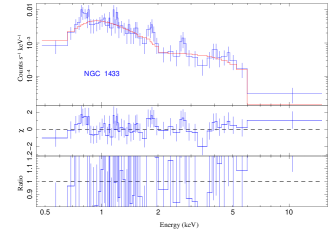
The Chandra data were reprocessed using the software ciao, version 4.7.1. The source regions were extracted from circles of radius 2.5 arc-secs with the centre of the circle fixed to the RA and Dec of the source. The background regions were selected from regions away from the source but from the same CCD. The command specextract was used to extract the source+background spectra, the background spectra, the effective area (ARF) and the redistribution matrix (RMF). In the MOX sample there are 16 sources for which we have used Chandra observations. Appendix A lists the X-ray spectra, the best fit models, and the residuals of the MOX sources. In Appendix B we describe the previous studies of the sources in the MOX sample, as well as we list the details of the X-ray spectral modelling carried out in this work.
4. X-ray spectral analysis
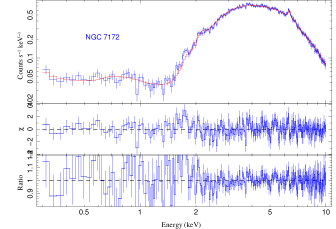
For the 39 out of 47 sources where the total photon count is (see Table 3) we have used a combination of mostly phenomenological models, step by step, to fit the spectra. The signal to noise ratio (SNR) of several sources in the MOX sample is not sufficiently high to obtain statistically meaningful results with complex models. The simple baseline model consists of a power law absorbed by Galactic extinction (Kalberla et al., 2005). A further intrinsic absorber (ztbabs) was added if the source exhibited obscuration. The model APEC (Smith et al., 2001) was used to describe emission in the soft X-rays. In a few cases two APEC models were necessary to describe the soft X-ray emission. A simple black body model was used in two sources (I ZW 1 and NGC 7172) where the APEC did not give a good fit. For sources with higher SNR, Gaussian profiles were used to describe the emission lines in soft as well as hard X-ray, specially the Fe K features in the band. These narrow soft emission lines arise mostly due to photo-ionisation of the plasma by the central source, or reprocessing of the nuclear high-energy primary continuum by optically thick matter. The diskline profile was used to model the broad Fe K profile, wherever present.
The XMM-Newton EPIC-pn data were grouped using specgroup command in Scientific Analysis System (SAS), by which we ensured that each data bin has at least 20 counts and there are at most 5 data bins per resolution element. The Chandra observation were grouped by a minimum signal to noise ratio of . We used statistics to fit the data. All errors quoted on the fitted parameters reflect the confidence interval for one interesting parameter corresponding to (Lampton et al., 1976). The Interactive Spectral Interpretation System (ISIS) software (Houck & Denicola, 2000) was used in fitting the spectra.
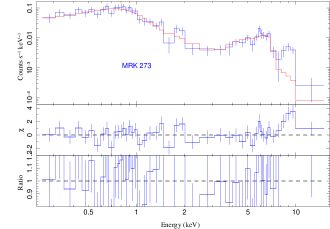
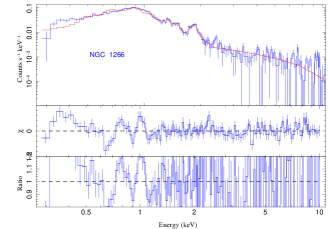
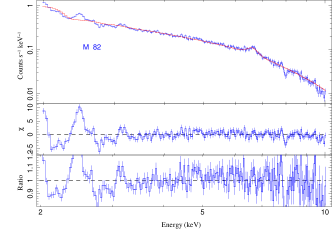
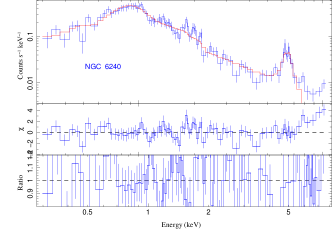
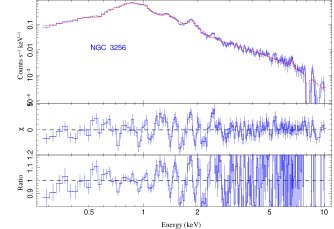
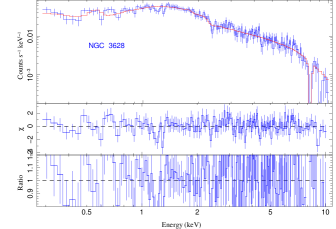
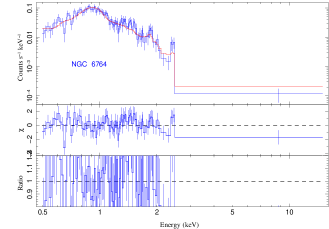
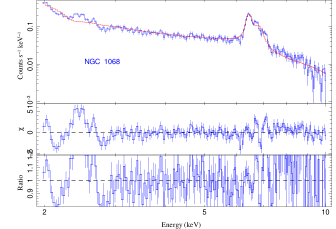
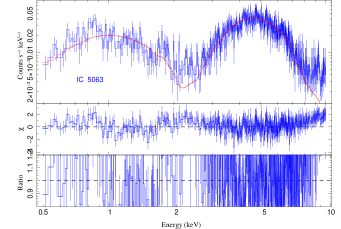
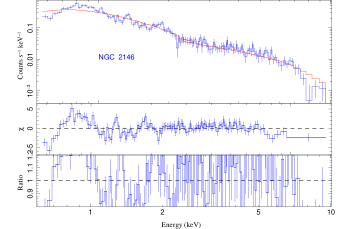
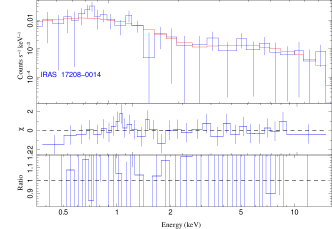
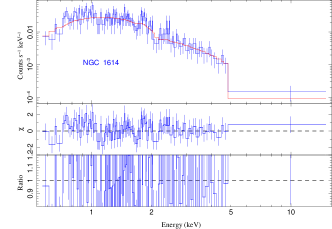
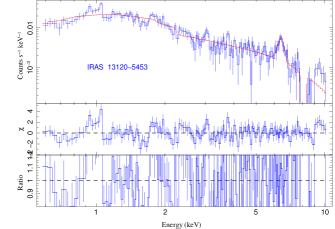
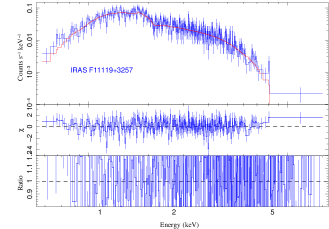
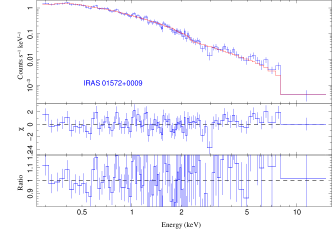
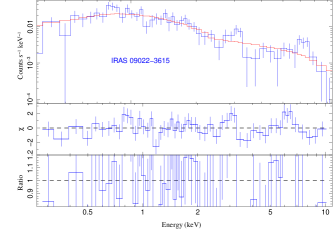
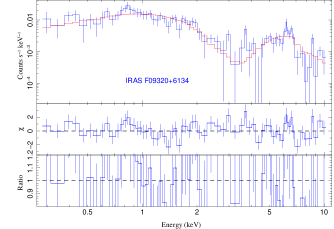
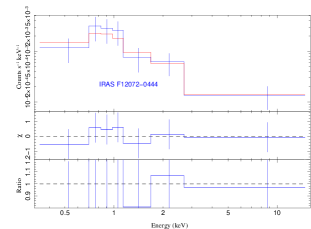
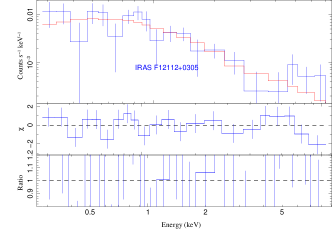
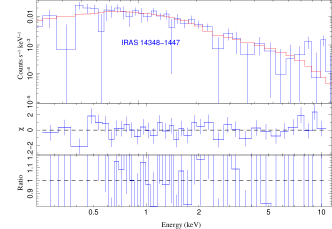
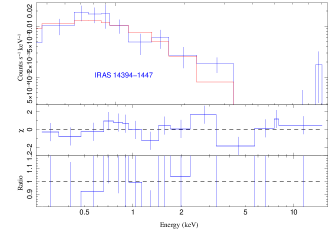
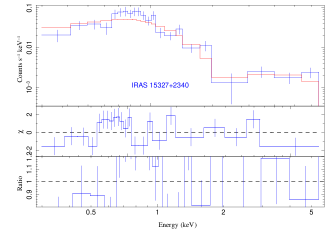
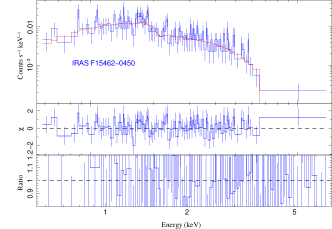
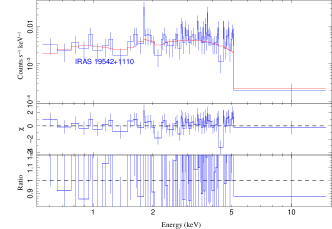
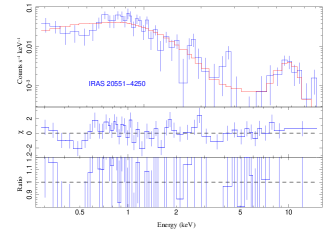
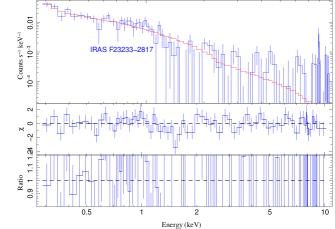
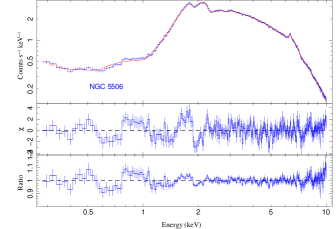
Table 4 lists the best fit parameters along with the and absorption-corrected flux and luminosity. The luminosity quoted in the table is from the model APEC only and not the integrated continuum flux. We assume hereafter that the model APEC describes the thermal emission in the soft X-rays mostly arising from supernova remnants and star-bursts (see for e.g., Mitsuishi et al., 2013; Ducci et al., 2013). The best fit temperatures of APEC lie in the range . In most cases the AGN continuum is absorbed below , and from Table 4 we find that almost all the sources with sufficient SNR have a neutral intrinsic column density of . However, as a caveat we should note that in some cases the soft X-rays may also contain contributions from the reprocessed emission from the central AGN, such as ionized disk reflection, and can mimic thermal emission. Figures 10-13 show the data and the best fit model in the upper panels, and the residuals in the lower panels. Note that for the two sources M 82 and NGC 1068, the soft X-ray spectra were extremely complex and could not be fit using the simple baseline model.
For the sources where the SNR does not permit us to constrain simultaneously the powerlaw slope and the neutral absorption column, we fix the slope to a value , typical of Seyfert galaxies, and calculate the corresponding fluxes and absorption column. See Table 4 for details. For the six Compton thick sources (NGC 6240, NGC 1068, NGC 1377, IRAS F08572+3915, IRAS F20551-4250, IRASF14348-1447, IRAS 13120-5453) in our sample identified from previous studies, we have multiplied the observed with a factor of 100 to obtain the intrinsic while carrying out the correlation analysis (see for e.g., Lamastra et al., 2009; Puccetti et al., 2016). See Table 5 for the final values of these sources and Section 4.1 for details.
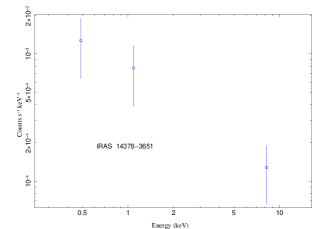
For eight sources in the MOX sample, having total counts , we have used the luminosity from previous studies who have employed hardness ratio method (e.g., Teng & Veilleux, 2010). The hardness ratio is defined as HR=(H-S)/(H+S), where H and S are the number of counts in the hard () and soft () bands respectively. The hardness ratios calculated from the data were then compared with hardness ratios generated with an absorbed power law model to estimate the model parameters (Teng et al., 2005).
4.1. Assembling the best values of estimated using X-ray spectroscopy
As inferred from Sec. 4, most of the sources in the MOX sample are probably obscured by the intervening host galaxy dust and gas and therefore the luminosity estimated from the X-ray spectral analysis of XMM-Newton and Chandra may not give us the real picture. A better glimpse of the unobscured luminosities can be obtained by analysing spectra at energies where the hard X-ray photons have lesser probability to get absorbed. NuSTAR operates in the energy range and gives us the unique opportunity of such an intrinsic view of the luminosity. In this section we discuss how we selected the best estimate of available to us by different X-ray spectral analysis methods.
We assigned the highest preference to the unabsorbed values estimated using NuSTAR, whenever available. Only 23 sources in the MOX sample have been observed by NuSTAR either as targets or serendipitously. We carried out a literature search on the analysis of NuSTAR data of these sources and found that out of these 23, only 10 sources have enough SNR to carry out a spectral study in the broad band . For e.g., the NuSTAR observations of the sources IRASF08572+3915 and IRASF10565+2448 found no detectable X-ray signatures in the energy band (Teng et al., 2015). The intrinsic values for the 10 sources obtained with NuSTAR have been quoted in Table 5, along with the references from where they have been derived. For a list of the MOX sources not observed by NuSTAR see Appendix C. For the rest of the MOX sources we use the estimated from the XMM-Newton and Chandra spectroscopy and the HR method enumerated in Section 4. For sources which have been previously identified as C-thick and have not been studied by NuSTAR, we have multiplied the values obtained using the XMM-Newton and Chandra spectroscopy by a factor of 100 (see for e.g., Lamastra et al., 2009; Puccetti et al., 2016), to obtain an estimate of the intrinsic unabsorbed luminosity.
Table 5 column 3 lists the values obtained using XMM-Newton and Chandra spectroscopy, while column 4 lists the values obtained using NuSTAR. The last column of Table 5 lists the best values of we use in the rest of this work for analysis, which we refer to as . In Table 6 we compare the finally selected values with those estimated using the m flux (). Fig 3 left panel shows the distribution of the best estimated above and the estimated using m flux. The right panel of Figure 3 shows the ratio plotted against the bolometric luminosity of the AGN ().
The bolometric corrections () corresponding to the two sets of values are listed in Table 7. Figure 4 left and right panels show the bolometric corrections of the MOX sources with and values respectively, plotted against the bolometric luminosity of the AGN. In the left panel of Fig. 4 we have plotted in yellow triangles the bolometric corrections of the sources for which the were obtained using NuSTAR broad band spectroscopy. NuSTAR provides an accurate estimate of the intrinsic luminosity and hence the bolometric corrections obtained using those estimates are more reliable.
5. Correlations
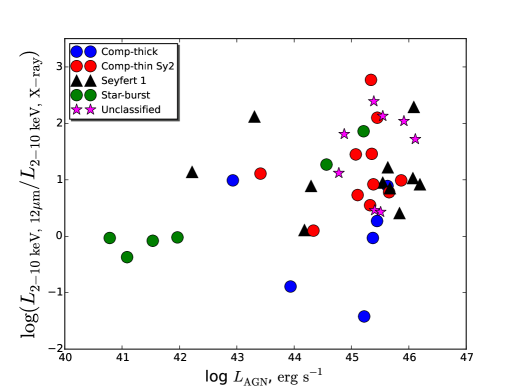
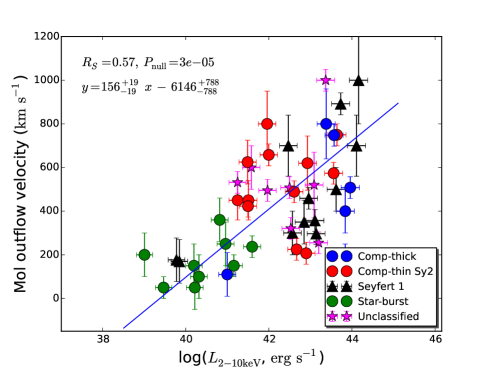
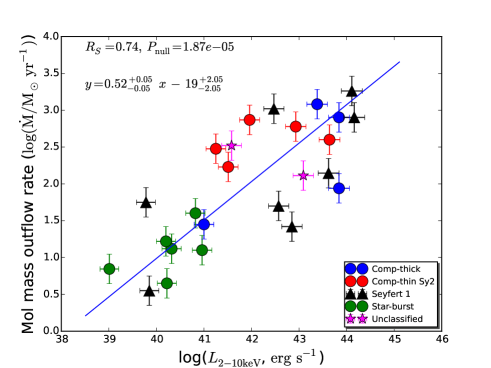
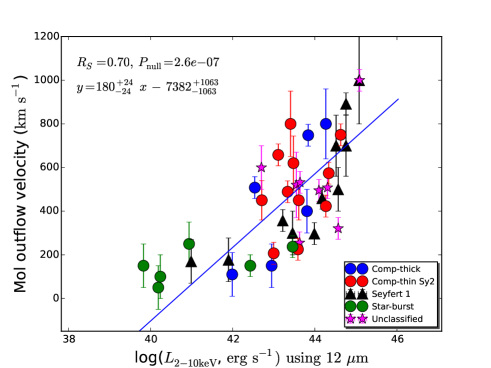
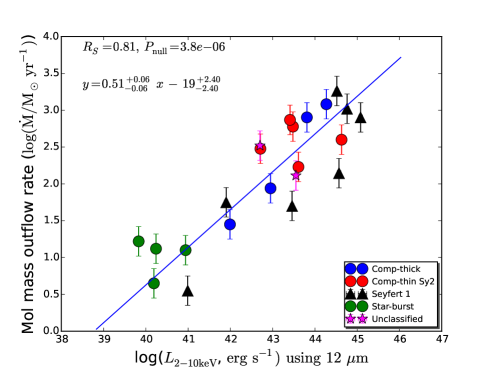
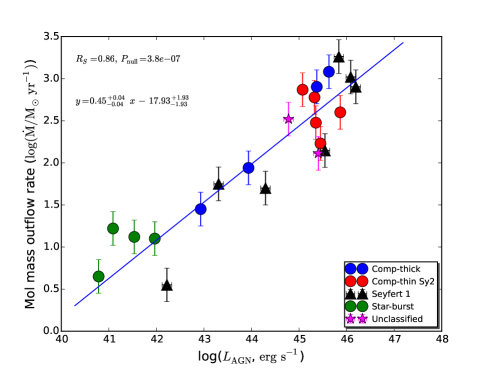
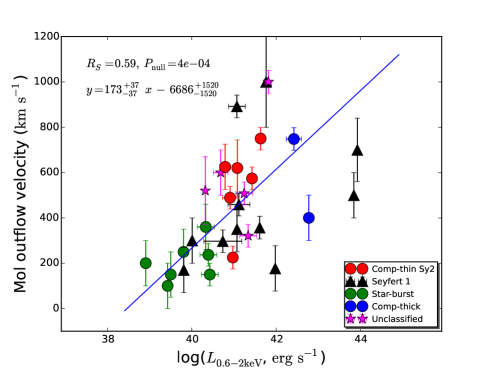
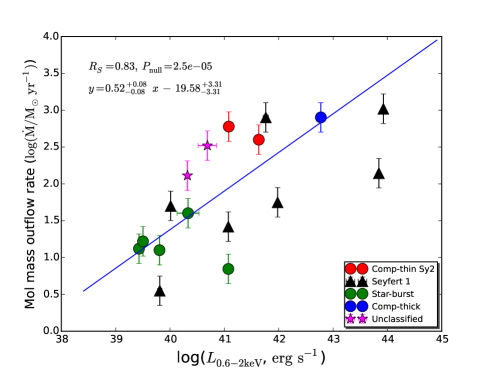
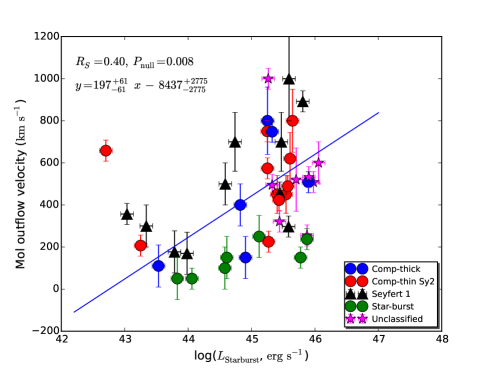
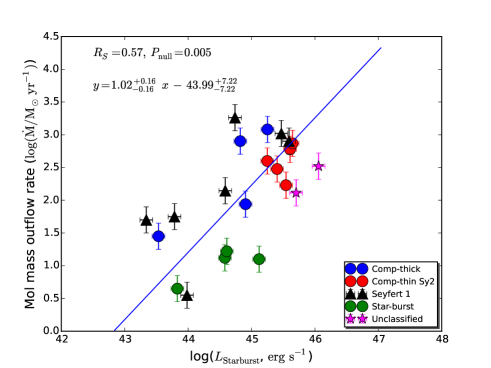
To test the dependence of molecular outflow kinematics on AGN activity, we have correlated the X-ray luminosity in the two energy bands, (APEC) and , as well as the AGN bolometric luminosity with the MO velocity and mass outflow rates (). We have also correlated the starburst luminosity, , with MO velocity and mass outflow rates. Table 8 lists the non-parametric Spearman rank coefficient, the null hypothesis probability, as well as the linear regression slope and intercept for these correlations. The number of data points involved in each correlation are also quoted in Table 8. The difference in the number of data points arises due to the fact that some of the sources in the MOX sample do not have mass outflow rate estimates, and also for a few sources we do not have an estimate of the (APEC) and . Figures 5-9 show the correlation between the (APEC), , the and the luminosities with the MO dynamical parameters ( and ). The starburst galaxies are plotted in green circles, and they occupy the phase space of lowest X-ray and AGN luminosity and lowest MO velocity as well as the mass outflow rates. The black triangles, red circles, and the blue circles denote the Seyfert 1 galaxies, Compton-thin Seyfert 2 galaxies, and the Compton-thick galaxies respectively. The magenta stars denote the unclassified sources.
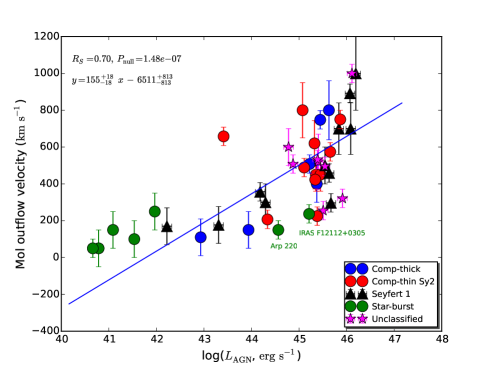
From Figures 5 and 6 we find that the luminosities of the MOX sources, and respectively, show strong correlation with MO velocity and , with a confidence . In both the figures we find that the mass outflow rate correlates better than that of the MO velocity. Similarly, Figure 7 shows that both the MO velocity and strongly correlate with the AGN bolometric luminosity, with a confidence . From Figures 8 and 9 we find that the and correlates with the MO velocity and with a confidence , but the correlations are not as strong as those with the AGN X-ray and bolometric luminosity. We discuss the implications of these results in Section 6
We have used the freely available Python code by Nemmen et al. (2012) using the BCES technique (Akritas & Bershady, 1996) to carry out the linear regression analysis between the quantities mentioned above. In this method the errors in both variables defining a data point are taken into account, as is any intrinsic scatter that may be present in the data, in addition to the scatter produced by the random variables. The strength of the correlation analysis was tested using the non-parametric Spearman rank correlation method.
6. Results and discussion
We have carried out a uniform X-ray spectral analysis of a sample of 47 sources exhibiting molecular outflows and obtained the best estimates of values using X-ray spectroscopy. We have also estimated the luminosity using m flux. As a caveat we note that estimating the intrinsic X-ray luminosity in these massive dusty galaxies is not straight forward due to large uncertainties in the obscuration along the line of sight, and most estimates are based on several assumptions. In this section we discuss the main results.
6.1. Are the AGN in the MOX sources X-ray weak?
The MOX sources are bright in IR and hence it is possible that large columns of neutral gas and dust obscures our line of sight and we do not observe the intrinsic for most of the galaxies. In this section we therefore investigate whether the MOX sources are extremely Compton thick or the AGN at the centre of the galaxies are indeed X-ray weak.
The NED classification of the MOX sources as listed in Table 1 shows that 33 out of 47 sources are ULIRGs or LIRGs, implying that they have large columns of gas and dust emitting in the infra-red. A systematic study of the ULIRGs in the X-rays using the broad band Chandra and XMM-Newton data were carried out by Teng & Veilleux (2010), and the authors noted that possibly in the ULIRGs we are capturing the nascent stages of AGN activity (Sanders et al., 1988), in which case the central AGN emission could be weak and starburst emission dominates the total power. In a more recent study by Teng et al. (2015) using NuSTAR observations of six ULIRGs, the authors conclude that these sources are indeed X-ray weak and not obscured. The typical example is that of MRK 231, which is a merger remnant containing both intense starburst as well as a luminous AGN at its centre. MRK 231 which was earlier thought to be a Compton thick AGN, was found by the authors to be intrinsically X-ray weak using the NuSTAR spectra (Teng et al., 2014). The X-ray bolometric correction () estimated by the authors for the six sources in their sample were found in the range from to indicating that the AGN at the centre of these sources are X-ray weak. Particularly for the two sources MRK 231 and IRAS 08572+3915 they are remarkably low, at and respectively. Normally for Seyfert galaxies these values lie in the range (see for e.g., Elvis et al., 1994; Vasudevan et al., 2009, 2010, and references therein). The authors rule out obscuration as the cause for the X-ray weakness. They conclude that possibly the AGN is accreting at super Eddington rates, in which case the UV bump dominates, or else the presence of large scale outflows may have quenched the X-ray emission in the AGN.
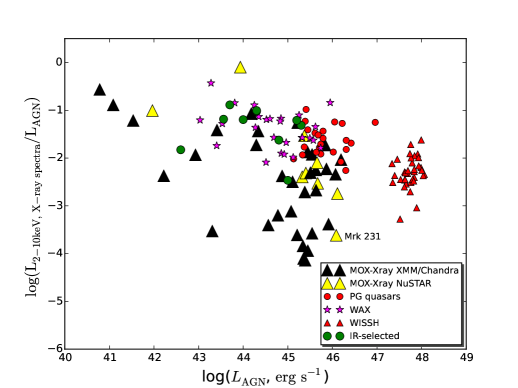
From Figure 4 left panel and Table 7, we find that the distribution of the bolometric correction () of the MOX sample ranges from to , with of the sources having X-ray bolometric correction below . To compare the bolometric correction of the MOX sources with Seyfert and quasars we selected four AGN samples at different redshift ranges and well studied in X-rays: 1. The warm absorbers in X-rays (WAX) sample, Laha et al. (2014). This sample consists of 26 nearby () Seyfert 1 galaxies, with an X-ray luminosity of . 2) ‘Palomar Green (PG) quasars’, Laor et al. (1994), consists of quasars in a redshift range , with an X-ray luminosity of , 3) The WISSH quasar sample (Martocchia et al., 2017), consisting of WISE-SDSS selected high redshift quasars () with an X-ray luminosity of . 4) The m selected AGN sample by Brightman & Nandra (2011), for which we have used a subsample of 10 sources which are type-1 AGN having well estimated values of and (Vasudevan & Fabian, 2009). The type-1 constraint on these IR bright sources ensures that we obtain an unobscured view of the central engine. In Figure 4 left panel we have over-plotted the bolometric correction () vs of these comparison samples along with the MOX sample. We find that the X-ray bolometric corrections of most of the MOX sources are orders of magnitude lower than that of the Seyfert galaxies and the quasars. We also find that the NuSTAR estimates of the bolometric correction for the MOX sources (plotted as yellow triangles) are nearly similar to the Seyfert galaxies and quasars except for the source Mrk 231, which has a correction of . Therefore, it may be possible that most of the MOX sources are not X-ray weak, instead they are heavily obscured.
The broad absorption line quasars (BAL) have also been found to be extremely X-ray weak. A study of two BAL quasars, PG 1004+130 (radio loud) and PG 1700+518 (radio quiet), by Luo et al. (2013), using NuSTAR data has revealed that although they are among the optically brightest BAL quasars, their luminosity is 16-120 times weaker as compared to typical quasars. Another study by Luo et al. (2014) of six optically bright BAL quasars using NuSTAR and Chandra revealed that the luminosity of the sources are almost times fainter than normal Seyfert galaxies, while the overall hard X-ray luminosity is consistently weak for all the six sources. Extreme Compton thick absorption () is ruled out from the analysis of the stacked Chandra spectra, confirming the sources to be bonafide X-ray weak. One possibility for the X-ray weakness of the BAL quasars is the failed winds, which are ionised clouds which do not get enough radiative push to get out of the gravitational field of the SMBH and falls back on the central engine. These failed winds obscure substantial fraction of the AGN luminosity in the X-rays making them X-ray weak. Another possibility is that the BAL outflows remove the feeding gas near the SMBH thereby quenching the central AGN. The latter possiblity can hold true for molecular outflows. Observations by Cicone et al. (2014) have shown that MO kinetic energy can be as large as of the AGN bolometric luminosity, which according to feedback models (Hopkins & Elvis, 2010) is enough to blow away the gases in the host galaxies. Martocchia et al. (2017) studied the X-ray properties of a sample of hyper luminous quasars () at redshift of . They found that the X-ray bolometric correction for these sources lies in the range , which are orders of magnitude lower than low luminosity AGN. They conjecture that possibly the X-ray weakness could be due to the powerful high ionization emission line driven winds which perturb the X-ray corona and weaken their emission. On a similar vein we find that although the MOX sources have a wide range of X-ray bolometric corrections, on an average they are mostly lower compared to the other quasar samples, and possibly the molecular outflows are responsible for their lower X-ray bolometric corrections.
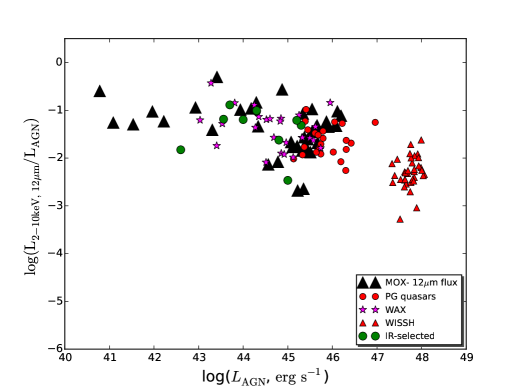
It is not very straight forward to understand why the AGN at the centre of the MOX galaxies can be X-ray weak, given the fact that the AGN bolometric luminosities of these galaxies are comparable to local Seyfert galaxies and quasars (). The X-ray coronal emission is very unlikely to be affected by molecular outflows because the AGN corona is confined to a location while the MO are detected at distances of scales. Therefore, a direct link between the molecular outflows and quenching of X-ray emission does not seem feasible. In the light of this argument we probe in detail the possibility of extreme Compton thick obscuration of the MOX galaxies. In the scenario where the X-ray photons find it hard to escape out of the dust, the m flux gives us an approximate upper limit on the luminosity (See Section 2.3). Figure 4 right panel shows the bolometric correction () vs the bolometric luminosity , where the values have been calculated using the m luminosity. We find that the range of the bolometric corrections calculated using m flux are similar with those of local Seyfert galaxies, and also the MOX galaxies follow the trend of having a lower bolometric correction for sources with higher bolometric luminosity, as also detected in Seyfert galaxies and quasars (See for e.g., Martocchia et al., 2017, and references therein). The values estimated using m flux may therefore be good indicators of the intrinsic luminosity as it shows that the AGN central engine at the centre of the MOX sources functions similarly as that of the Seyfert galaxies and quasars. From Figure 3 right panel we find that the ratio between the of the MOX sources obtained using the m flux and using X-ray spectroscopy ranges from , indicating that these estimates differ by orders of magnitude. The possible reasons behind this discrepancy could be any or all of the following: 1. The X-ray spectra does not give us the correct estimate of intrinsic X-ray luminosity due to uncertainties in the obscuring column, 2. The m flux can contain emission from polycyclic aromatic hydrocarbon (PAH) from the host galaxy (see for e.g., Hernán-Caballero et al., 2015, , and the references therein), which mostly affects the mid-IR energy band, 3. The AGN emission factor may have an intrinsic uncertainty leading to uncertainties in the estimates of . In a future work we intend to address these uncertainties with a more comprehensive multi-wavelength approach.
In summary, we find that on an average the AGN at the centres of the MOX sources may not actually be X-ray weak. The apparent X-ray weakness could be due to the large obscuration column of the intervening dust and gas. The NuSTAR estimates as well as the m estimates of the bolometric corrections of the MOX sources mostly lie in the range spanned by Seyfert galaxies and quasars. Therefore, the AGN at the heart of these galaxies may be functioning similar to that of the local Seyfert galaxies and quasars, and the X-ray emission is weak due to obscuration. As a caveat we must remember that the estimated using m flux is an indirect measurement and there can be other contributors to the m flux apart from the AGN and the starburst processes, such as the PAH emission from galaxies.
6.2. Is the AGN the main driver of molecular outflows?
Figure 5 left panel shows the correlation between the and MO velocity in the MOX sample while the right panel shows the correlation between and MO mass outflow rate. The correlations are statistically significant (See Table 8) and the positive slope indicates that a stronger AGN emission drives faster and more powerful MO. We find that the correlations between and MO dynamical quantities become stronger when we use the estimated using m flux (See Figure 6). Figure 7 shows that the MO outflow velocity and the mass outflow rates correlate very strongly with the AGN bolometric luminosity. In the left panel of Figure 7 we find that two SB dominated sources Arp 220 and IRASF12112+0305 have larger AGN luminosity, , compared to other SB galaxies, although their AGN fraction is small, and respectively (See Table 7). However, the MO velocity in those sources are , comparable with the other SB galaxies. From the right panel of Figure 7 we find a tight correlation between the and the MO mass outflow rate with a probability . A recent study by Fiore et al. (2017) found similar strong correlations not only between the molecular outflows and , but also with ionised outflows and . The linear regression slope derived by them for vs is for molecular winds. We find a more flat slope of probably due to the fact that the SB dominated galaxies skewes the correlation. We note from Figures 5-7 that the starburst dominated sources (in green circles) have the lowest MO velocity and . These results indicate that the central AGN plays a dominant role in driving these large scale molecular outflows.
Sturm et al. (2011) in a sample of six galaxies detected molecular outflows and found that the MO velocity scales positively with the strength of the AGN. They concluded that the central AGN plays a definitive role in driving these large scale outflows. Moreover, the authors predicted that we can distinguish between an AGN driven MO with a SB driven by noting the velocity of the outflow. Typically AGN driven flows are faster while the SB driven outflows are slower . More recent studies by Cicone et al. (2014) on a sample of 19 sources with molecular outflows show that the molecular mass outflow rates increases with the strength of the central AGN. The starburst dominated sources on the other hand harbour outflows with lower mass outflow rates. These point to the fact that the central AGN plays a dominant role in driving these outflows.
Although we find that the presence of an AGN boosts the MO velocity and , yet, the physical nature of the interaction between the central AGN and the MO is still not clear. One possibility investigated by previous studies is the effect of highly ionised high velocity outlfows (UFOs) striking the inter-stellar medium (ISM). Feruglio et al. (2015) detected the presence of ultra-fast outflows (UFO) as well as molecular outflow in the galaxy MRK 231. The MO extends to , which the authors conjectured could be driven by the UFOs by transferring the kinetic energy to the inter-stellar medium. Tombesi et al. (2015) found similar trends of energy conserving interactions of the faster UFOs and the slower MO for the source IRAS F11119+3257, suggesting that the UFOs could be the mechanism generating large molecular outflows at scale. This theory is however, still debated (Veilleux et al., 2017). Moreover, except for two MOX sources, MRK 231 and IRAS F11119+3257, no other sources exhibit simultaneous detections of MO and UFO, which can also be due to low SNR in the spectral range of where the UFOs are found. Another mechanism that may produce large scale molecular outflows is the radiative thrust from the central AGN, much similar to UV line driven disk winds (Proga & Kallman, 2004). The presence of dust enhances the possibility of coupling the AGN radiation with the inter-stellar matter and thereby transfering the radiative thrust onto the gas leading to the MO. However, it is not clear how the AGN emission from radial distance influences molecular gas clouds at scales and what physical mechanism tranfers momentum and energy efficiently in the region of the host galaxy.
The question therefore remains, whether the presence of an AGN is necessary to generate and drive a MO? Geach et al. (2014) have detected molecular outflows in a compact massive starburst galaxy at a redshift of which are mainly driven by stellar radiation pressure. The authors demonstrated that nuclear bursts of star formation can eject large amounts of cold gas from the centre of the galaxies which truncates the star formation and affects their evolution. Similarly, Sell et al. (2014) in a sample of 12 massive galaxies, at , exhibiting signs of rapid quenching of star formation rate, have shown that the quenching is happening likely due to feedback from the fast outflows generated by star formation rather than AGN. For 9/12 galaxies the authors rule out the presence of any AGN at the centre of the galaxies. Diamond-Stanic et al. (2012) in a sample of starburst galaxies at also find that radiation pressure from massive stars and ram pressure from supernova and stellar winds is sufficient to produce high velocity outflows and the presence of an AGN is not needed in such cases. Theoretical studies by Sharma & Nath (2013) have also suggested that starbursts can play an active role in driving massive galactic winds.
From Table 7 we find that more than (27 out of 47) of the sources in the MOX sample have an AGN fraction of , implying that the total galactic emission is dominated by star bursts in more than half of the sources. Very interestingly we also find statistically significant positive correlations between the soft X-ray APEC luminosity and MO velocity and . In this work we assume APEC luminosity in the energy range probes the strength of starburst (SB) activity. As a caveat we note that this may not be true for a few sources where the primary or the reflected emission from AGN may also contribute to the luminosity. We also find statistically strong positive correlations between vs MO velocity and vs (See Figure 9). These correlations indicate that SB also can play a significant role in generating and driving the molecular outflows. The SB emission arises from extended regions of the galaxies (compared to the size of the central AGN) and are sometimes cospatial with the MO (), and hence has a good probability to generate the MO. However, we should note that the correlations of the molecular outflow velocity and with the and are weaker compared to those of the AGN X-ray and bolometric luminosities. It is possible that both star bursts and AGN generate and drive these massive MO.
In summary we confirm that the AGN power is well correlated with the power of the MO. However, the fact that the powerful MO are also found in sources whose contribution to the AGN bolometric luminosity is small, and the strong correlations between vs , and vs indicate that powerful star bursts are equally probable to generate and drive the large scale MO.
7. Conclusions
We have carried out an extensive X-ray spectral analysis of a sample of 47 galaxies exhibiting molecular outflows (the MOX sample), using observations from Chandra and XMM-Newton. Below we list the main conclusions:
-
•
From the X-ray spectra of the MOX sources we find that they are generally X-ray weak, with an X-ray bolometric correction ranging from to , with of the sources below . Possibly the MOX sources have AGN with weaker X-ray emission compared to local Seyfert galaxies and quasars. However it is not physically clear why and how should the X-ray emission be selectively quenched relative to the overall AGN bolometric luminosity.
-
•
We obtain an upper limit on the emission from the AGN () in the MOX sources using the m flux emitted from the galaxies, following the correlation by Asmus et al., . The factor ensures that we consider the m flux from the central AGN only. The values obtained using this method are orders of magnitude larger than the values obtained using X-ray spectroscopy. Moreover, the values are consistent with local Seyfert galaxies and quasars. Speculatively we can say that the AGN at the heart of the MOX sources may have similar as local Seyfert galaxies and quasars, but their weak X-ray emission is due to the high column of obscuration along the line of sight. As a caveat we must note that the galactic PAH emission also contributes to the m flux which are unaccounted for, and hence we refer to the obtained using the m flux as an upper limit on the emission from the AGN.
-
•
The relation () vs of the MOX sources also shows a similar trend as that of the local Seyfert galaxies and quasars, that is, with increasing bolometric luminosity of AGN () the X-ray bolometric correction decreases. This may imply that at the heart of these galaxies the AGN functions similarly as that of the quasars, and their apparent X-ray weakness is due to extreme obscuration.
-
•
We find statistically significant positive correlations between and with the molecular outflow velocity and in the MOX sample, indicating that the presence of an AGN boosts the molecular outflow velocity and power.
-
•
We find that the starburst emission in the host galaxies of the MOX sample, correlates strongly with the molecular outflow velocity and . The starburst emission, measured in the soft X-rays () with the model APEC, also shows significant correlation with the MO velocity and . These correlations points to the fact that starburst has the potential to generate and drive the molecular outflows. The starburst emission arises from regions that are more extended (compared to the size of AGN central engine) and hence may sometimes be co-spatial with the molecular outflows, and therefore can play more important role in driving the outflows. Supporting our claim above, we also find that 27 of the 47 sources in the MOX sample have an AGN fraction , implying that the starburst are dominant in these galaxies, and they drive can these large scale molecular outflows. However, we should note that the correlations of the molecular outflow velocity and with the and are weaker compared to those of the AGN X-ray and bolometric luminosities. It is possible that although starburst can drive massive molecular outflows, the presence of an AGN always boosts the power of the outflows.
| Index | Source | Other names | z | R.A. | Dec. | ClassificationA | Galaxy B | RefC | ||
|---|---|---|---|---|---|---|---|---|---|---|
| activity | mJy | |||||||||
| 1 | 2 | 3 | 4 | 5 | 6 | 7 | 8 | 9 | 10 | |
| 1 | IRAS F08572+3915 | - | 0.0583 | 09h00m25.3s | +39d03m54.4s | ULIRG | CT | 1,2 | ||
| 2 | IRAS F10565+2448 | - | 0.0431 | 10h59m18.1s | +24d32m34s | ULIRG | OA | 2 | ||
| 3 | IRAS 23365+3604 | - | 0.0645 | 23h39m01s | +36d21m08s | ULIRG | OA/LINER | 1 | ||
| 4 | Mrk 273 | - | 0.0377 | 13h44m42.1s | +55d53m13s | ULIRG | Sy2/OA | 2 | ||
| 5 | Mrk 876 | - | 0.129 | 16h13m57.2s | +65d43m10s | - | Sy1 | |||
| 6 | I Zw 1 | UGC 00545 | 0.0589 | 00h53m34.9s | +12d41m36s | Sy1 | NLSy1 | |||
| 7 | MrK 231 | - | 0.0421 | 12h56m14.2s | +56d52m25s | ULIRG/RL | Sy1/SB | 2 | ||
| 8 | NGC 1266 | - | 0.0072 | 03h16m00.7s | -02d25m38s | Sy | AGN | 3 | ||
| 9 | M 82 | - | 0.0006 | 09h55m52.7s | +69d40m46s | - | SB | 4 | ||
| 10 | NGC 1377 | - | 0.0059 | 03h36m39.1s | -20d54m08s | - | NC | 5,6 | ||
| 11 | NGC 6240 | - | 0.0244 | 16h52m58.9s | +02d24m03s | LIRG | CT/GM/SB | 1 | ||
| 12 | NGC 3256 | - | 0.0093 | 10h27m51.3s | -43d54m13s | LIRG | SB | 7 | ||
| 13 | NGC 3628 | - | 0.0028 | 11h20m17.0s | +13d35m23s | RL | SB | 8 | ||
| 14 | NGC 253 | - | 0.0008 | 00h47m33.1s | -25d17m18s | - | Variable SB | 9 | ||
| 15 | NGC 6764 | - | 0.0081 | 19h08m16.4s | +50d56m00s | - | AGN+SB | 10 | ||
| 16 | NGC 1068 | - | 0.0038 | 02h42m40.7s | -00d00m48s | LIRG | CT/Sy2 | 11 | ||
| 17 | IC 5063 | - | 0.0113 | 20h52m02.3s | -57d04m08s | Sy1/RL | NLSy2 | 12 | ||
| 18 | NGC 2146 | - | 0.0029 | 06h18m37.7s | +78d21m25s | LIRG | SB | 13 | ||
| 19 | IRAS 17208-0014 | - | 0.0428 | 17h23m21.9s | -00d17m01s | ULIRG/LINER | ULIRG | 2 | ||
| 20 | NGC 1614 | - | 0.0159 | 04h33m59.8s | -08d34m44s | LIRG/SB | SB | 14 | ||
| 21 | IRAS 05083+7936 | VII Zw 031 | 0.0536 | 05h16m46.1s | +79d40m13s | LIRG | OA | - | ||
| 22 | Iras 13451+1232 | 4C +12.50 | 0.1217 | 13h47m33.3s | +12d17m24s | ULIRG/RL | Sy2 | 2 | ||
| 23 | 3C 293 | UGC 08782 | 0.0450 | 13h52m17.8s | +31d26m46s | Sy/RL | NC | 15 | ||
| 24 | NGC 1433 | 0.0035 | 03h42m01.5s | -47d13m19s | SB | NC | - | |||
| 25 | IRAS 13120-5453 | WKK 2031 | 0.0308 | 13h15m06.3s | -55d09m23s | ULIRG | NC | 16 | ||
| 26 | IRASF 14378-3651 | - | 0.0676 | 14h40m59s | -37d04m32s | ULIRG | Sy2 | 1 | ||
| 27 | IRAS F11119+3257 | B2 1111+32 | 0.1890 | 11h14m38.9s | +32d41m33s | ULIRG | NC | 17 | ||
| 28 | IRAS F01572+0009 | MRK 1014 | 0.1631 | 01h59m50.2s | +00d23m41s | ULIRG/Sy 1.5 | NC | 18 | ||
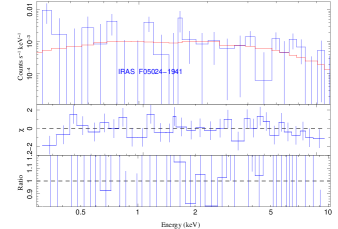
| 29 | IRAS F05024-1941 | - | 0.1920 | 05h04m36.5s | -19d37m03s | ULIRG | NC | 2 | ||
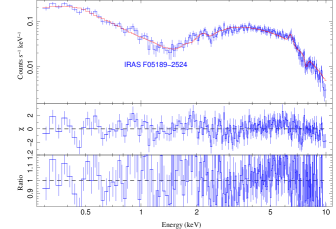
| 30 | IRAS F05189-2524 | - | 0.0425 | 05h21m45s | -25d21m45s | ULIRG | Sy2 | 2 | ||
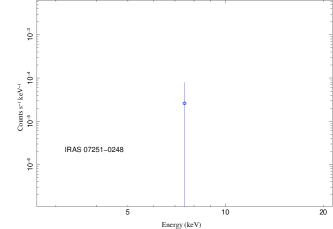
| 31 | IRAS 07251-0248 | - | 0.0875 | 07h27m37.5s | -02d54m55s | ULIRG | Faint src | 1 | ||
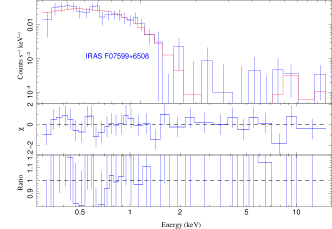
| 32 | IRAS F07599+6508 | - | 0.1483 | 08h04m33.1s | +64d59m49s | ULIRG | NC | 2 | ||
| 33 | IRAS 09022-3615 | - | 0.0596 | 09h04m12.7s | -36d27m01s | ULIRG | AGN | 1 | ||
| 34 | IRAS F09320+6134 | UGC 05101 | 0.0393 | 09h35m51.6s | +61d21m11s | ULIRG | OA | 1 | ||
| 35 | IRAS F12072-0444 | - | 0.1284 | 12h09m45.1s | -05d01m14s | ULIRG/Sy2 | NC | 2 | ||
| 36 | IRAS F12112+0305 | - | 0.0733 | 12h13m46.0s | +02d48m38s | ULIRG | SB | 1 | ||
| 37 | IRAS F14348-1447 | - | 0.0830 | 14h37m38.4s | -15d00m20s | ULIRG | CT/SB | 1 | ||
| 38 | IRAS F14394+5332 | - | 0.1045 | 14h41m04.4s | +53d20m09s | ULIRG | NC | - | ||
| 39 | IRAS F15327+2340 | ARP 220 | 0.0181 | 15h34m57.2s | +23d30m11s | ULIRG/Sy | OA | 2 | ||
| 40 | IRAS F15462-0450 | - | 0.0997 | 15h48m56.8s | -04d59m34s | ULIRG/NLSy1 | NC | 2 | ||
| 41 | IRAS F19297-0406 | - | 0.0857 | 19h32m21.2s | -03d59m56s | ULIRG | NC | 1 | ||
| 42 | IRAS 19542+1110 | - | 0.0649 | 19h56m35.4s | +11d19m03s | ULIRG | OA | 1 | ||
| 43 | IRAS F20551-4250 | ESO 286IG019 | 0.0429 | 20h58m26.8s | -42d39m00s | ULIRG | CT | 1 | ||
| 44 | IRAS F23233+2817 | - | 0.1140 | 23h25m49.4s | +28d34m21s | ULIRG/Sy2 | NC | - | ||
| 45 | NGC 5506 | - | 0.0062 | 14h13m14.9s | -03d12m27s | Sy | NC | 19 | ||
| 46 | NGC 7479 | - | 0.0079 | 23h04m56.6s | +12d19m22s | SB/Sy1.9 | NC | 20 | ||
| 47 | NGC 7172 | 0.0087 | 22h02m01.9s | -31d52m11s | Sy2 | NC | 21 |
A The classification as obtained from NED.
B The galaxy activity as identified by previous X-ray and optical studies: CT= Compton thick, CL=Changing Look, OA=Obscured AGN, LINER= Low ionisation nuclear emission line region, Sy2= Seyfert 2, NLSy1= Narrow line Seyfert 1, SB= starburst, GM=Galaxy mergers , NC=Not classified.
C The references to the previous X-ray studies: 1=Iwasawa et al. (2011), 2=Teng & Veilleux (2010), 3= Alatalo et al. (2015), 4=Liu et al. (2014), 5= Costagliola et al. (2016),6=Aalto et al. (2016),7=Lehmer et al. (2015), 8=Tsai et al. (2012), 9=Krips et al. (2016), 10=Croston et al. (2008), 11=Marinucci et al. (2016), 12= Cicone et al. (2014), 13=Inui et al. (2005), 14= Herrero-Illana et al. (2014), 15=Lanz et al. (2015), 16=Teng et al. (2015), 17=Tombesi et al. (2015), 18=Ricci et al. (2014), 19=Guainazzi et al. (2010), 2-= Akylas & Georgantopoulos (2009) , 21=Guainazzi et al. (1998)
D The m monochromatic flux of the galaxies obtained from NASA Extragalactic Database.
| Index | Source | Method | ReferenceB | Outflow velocityC | SFR | ||
|---|---|---|---|---|---|---|---|
| used | log() | [] | |||||
| 1 | IRAS F08572+3915A | CO(1-0) | 1 | 3.082 | 20 | ||
| ” | OH | 2 | 2.98 | - | |||
| 2 | IRAS F10565+2448 | CO(1-0) | 1 | 2.477 | 95 | ||
| 3 | IRAS 23365+3604 | CO(1-0) | 1 | 2.230 | 137 | ||
| 4 | Mrk 273 | CO(1-0) | 1 | 2.778 | 139 | ||
| 5 | Mrk 876 | CO(1-0) | 1 | 6.5 | |||
| 6 | I Zw 1 | CO(1-0) | 1 | 36 | |||
| 7 | MrK 2311 | CO(1-0) | 1 | 234 | |||
| ” | OH | 2 | 3.07 | - | |||
| 8 | NGC 1266 | CO(1-0) | 1,3 | 1.6 | |||
| 9 | M 82 | CO(1-0) | 1,4 | 10 | |||
| 10 | NGC 1377 | CO(1-0) | 1,5 | 0.9 | |||
| 11 | NGC 6240 | CO(1-0) | 1,6 | 2.903 | 16 | ||
| 12 | NGC 3256 | CO(1-0) | 1,7 | 36 | |||
| 13 | NGC 3628 | CO(1-0) | 1,8 | 1.8 | |||
| 14 | NGC 2531 | CO(1-0) | 1,9 | 3 | |||
| ” | OH | 2 | - | - | |||
| 15 | NGC 6764 | CO(1-0) | 1,10 | 2.6 | |||
| 16 | NGC 1068 | CO(1-0) | 1,11 | 1.924 | 18 | ||
| 17 | IC 5063 | CO(1-0) | 1,12 | 0.6 | |||
| 18 | NGC 2146 | CO(1-0) | 1,13 | 12 | |||
| 19 | IRAS 17208-00141 | CO(2-1) | 14 | - | |||
| ” | OH | 2 | - | ||||
| 20 | NGC 1614 | CO(1-0) | 14 | - | |||
| 21 | IRAS 05083+7936 | CO(1-0) | 15 | - | - | ||
| 22 | IRAS 13451+1232 | CO(1-0) | 16 | - | |||
| 23 | 3C 293 | CO(1-0) | 17 | - | |||
| 24 | NGC 1433 | CO(3-2) | 18 | 0.845 | - | ||
| 25 | IRAS 13120-5453 | OH | 2 | 2.113 | - | ||
| 26 | IRAS 14378-3651 | OH | 2 | 2.869 | - | ||
| 27 | IRAS F11119+3257 | OH | 19 | - | |||
| 28 | IRAS F01572+0009 | OH | 20 | - | - | ||
| 29 | IRAS F05024-1941 | OH | 20 | - | - | ||
| 30 | IRAS F05189-2524 | OH | 20 | - | - | ||
| 31 | IRAS 07251-0248 | OH | 20 | - | - | ||
| 32 | IRAS F07599+6508 | OH | 20 | - | - | ||
| 33 | IRAS 09022-3615 | OH | 20 | - | - | ||
| 34 | IRAS F09320+6134 | OH | 20 | - | - | ||
| 35 | IRAS F12072-0444 | OH | 20 | - | - | ||
| 36 | IRAS F12112+0305 | OH | 20 | - | - | ||
| 37 | IRAS F14348-1447 | OH | 20 | - | - | ||
| 38 | IRAS F14394+5332 | OH | 20 | - | - | ||
| 39 | IRAS F15327+2340 | OH | 20 | - | - | ||
| 40 | IRAS F15462-0450 | OH | 20 | - | - | ||
| 41 | IRAS F19297-0406 | OH | 20 | - | - | ||
| 42 | IRAS 19542+1110 | OH | 20 | - | - | ||
| 43 | IRAS F20551-4250 | OH | 20 | - | - | ||
| 44 | IRAS F23233+2817 | OH | 20 | - | - | ||
| 45 | NGC 5506 | OH | 21 | - | - | ||
| 46 | NGC 7479 | OH | 21 | - | - | ||
| 47 | NGC 7172 | OH | 21 | - | - |
A Sources which have been observed both by CO and OH molecules.
B References: 1= Cicone et al. (2014), 2= Sturm et al. (2011), 3= Alatalo et al. (2011), 4= Walter et al. (2002), 5= Aalto et al. (2012), 6=Feruglio et al. (2013), 7= Sakamoto et al. (2006), 8=Tsai et al. (2012), 9=Mauersberger et al. (1996), 10=Sanders & Mirabel (1985), 11=Maiolino et al. (1997), 12=Wiklind et al. (1995), 13= Tsai et al. (2006), 14=García-Burillo et al. (2015), 15=Leroy et al. (2015), 16=Dasyra et al. (2014), 17=Labiano et al. (2014), 18=Combes et al. (2013), 19=Tombesi et al. (2015), 20=Veilleux et al. (2013), 21=Stone et al. (2016)
C Different authors have used +ve and -ve notations to denote outflow velocities (blue shifted) with respect to the systemic velocity. To avoid confusion and maintain uniformity, we have considered the modulus of the velocities
| Index | Source | Telescope | observation | Observation | Exposure | Net Exposure | Total |
|---|---|---|---|---|---|---|---|
| ID | Date | (ks) | (ks) | counts | |||
| 1 | IRAS F08572+3915 | XMM-Newton | 0200630101 | 13-04-2004 | 29 | 14 | 2.28e+02 |
| 2 | IRAS F10565+2448 | XMM-Newton | 0150320201 | 17-06-2003 | 32 | 25 | 1.307e+03 |
| 3 | IRAS 23365+3604 | Chandra | 4115 | 03-02-2003 | 10 | 10 | 74 |
| 4 | Mrk 273 | XMM-Newton | 0722610201 | 04-11-2013 | 23 | 6 | 9.81e+02 |
| 5 | Mrk 876 | XMM-Newton | 0102040601 | 14-11-2002 | 13 | 0.1 | 3.06e+02 |
| 6 | I Zw 1 | XMM-Newton | 0743050301 | 19-01-2015 | 141 | 20 | 1.81e+05 |
| 7 | MrK 231 | XMM-Newton | 0770580501 | 28-05-2015 | 26 | 21 | 3.63e+03 |
| 8 | NGC 1266 | XMM-Newton | 0693520101 | 23-07-2012 | 139 | 96 | 9.80e+03 |
| 9 | M 82 | XMM-Newton | 0206080101 | 21-04-2004 | 104 | 62 | 3.08e+05 |
| 10 | NGC 1377 | Chandra | 16086 | 10-12-2013 | 48 | 44 | 2.06e+02 |
| 11 | NGC 6240 | XMM-Newton | 0147420201 | 14-03-2003 | 42 | 4 | 2.61e+03 |
| 12 | NGC 3256 | XMM-Newton | 0300430101 | 06-12-2005 | 134 | 97 | 5.54e+04 |
| 13 | NGC 3628 | XMM-Newton | 0110980101 | 27-11-2000 | 65 | 38 | 6.29e+03 |
| 14 | NGC 253 | XMM-Newton | 0152020101 | 19-06-2003 | 141 | - | – |
| 15 | NGC 6764 | Chandra | 9269 | 20-01-2008 | 20 | 20 | 5.89e+02 |
| 16 | NGC 1068 | XMM-Newton | 0740060201 | 10-07-2014 | 64 | 44 | 5.26e+05 |
| 17 | IC 5063 | Chandra | 7878 | 15-06-2007 | 35 | 34 | 5.37e+03 |
| 18 | NGC 2146 | XMM-Newton | 0110930101 | 26-08-2001 | 27 | 12 | 6.34e+03 |
| 19 | IRAS 17208-0014 | XMM-Newton | 0081340601 | 19-02-2002 | 19 | 12 | 6.89e+02 |
| 20 | NGC 1614 | Chandra | 15050 | 21-11-2012 | 16 | 16 | 8.33e+02 |
| 21 | IRAS 05083+7936 | XMM-Newton | 009400101 | 11-09-2001 | 33 | 26 | 9.59e+02 |
| 22 | IRAS 13451+1232 | Chandra | 836 | 24-02-2000 | 28 | 25 | 1.42e+03 |
| 23 | 3C 293 | Chandra | 12712 | 16-11-2010 | 69 | 68 | 2.12e+03 |
| 24 | NGC 1433 | Chandra | 16345 | 04-03-2015 | 49 | 49 | 3.30e+02 |
| 25 | IRAS 13120-5453 | XMM-Newton | 0693520201 | 20-02-2013 | 129 | 85 | 6.15e+03 |
| 26 | IRAS 14378-3651 | Chandra | 7889 | 25-06-2007 | 14 | 14 | 1.05e+02 |
| 27 | IRAS F11119+3257 | Chandra | 3137 | 30-06-2002 | 19 | 18 | 2.89e+03 |
| 28 | IRAS F01572+0009 | XMM-Newton | 0101640201 | 29-07-2000 | 15 | 5 | 6.42e+03 |
| 29 | IRAS F05024-1941 | XMM-Newton | 0405950401 | 07-02-2007 | 42 | 26 | 6.89e+02 |
| 30 | IRAS F05189-2524 | XMM-Newton | 0722610101 | 02-10-2013 | 38 | 30 | 1.48e+04 |
| 31 | IRAS 07251-0248 | Chandra | 7804 | 01-12-2006 | 16 | 15 | 7.80e+01 |
| 32 | IRAS F07599+6508 | XMM-Newton | 0094400301 | 24-10-2001 | 23 | 16 | 7.12e+02 |
| 33 | IRAS 09022-3615 | XMM-Newton | 0670300401 | 23-04-2012 | 33 | 16 | 1.16e+03 |
| 34 | IRAS F09320+6134 | XMM-Newton | 0085640201 | 12-11-2001 | 35 | 26 | 1.49e+03 |
| 35 | IRAS F12072-0444 | Chandra | 4109 | 01-02-2003 | 10 | 10 | 7.3e+01 |
| 36 | IRAS F12112+0305 | XMM-Newton | 0081340801 | 30-12-2001 | 23 | 18 | 4.92e+02 |
| 37 | IRAS F14348-1447 | XMM-Newton | 0081341401 | 29-07-2002 | 22 | 15 | 7.97e+02 |
| 38 | IRAS F14394+5332 | XMM-Newton | 0651100301 | 06-07-2015 | 13 | 8 | 3.31e+02 |
| 39 | IRAS F15327+2340 | XMM-Newton | 0205510201 | 14-01-2005 | 35 | 6.3 | 5.09e+02 |
| 40 | IRAS F15462-0450 | Chandra | 10348 | 23-04-2009 | 15 | 15 | 6.08e+02 |
| 41 | IRAS F19297-0406 | Chandra | 7890 | 18-06-2007 | 17 | - | - |
| 42 | IRAS 19542+1110 | Chandra | 7817 | 10-09-2007 | 15 | 15 | 4.27e+02 |
| 43 | IRAS F20551-4250 | XMM-Newton | 0081340401 | 21-04-2001 | 22 | 11 | 1.07e+03 |
| 44 | IRAS F23233+2817 | XMM-Newton | 0553870101 | 15-12-2008 | 80 | 52 | 2.07e+03 |
| 45 | NGC 5506 | XMM-Newton | 0554170101 | 02-01-2009 | 90 | 61 | 7.94e+05 |
| 46 | NGC 7479 | XMM-Newton | 0301651201 | 24-06-2005 | 16 | 0.57 | 9.8e+01 |
| 47 | NGC 7172 | XMM-Newton | 0414580101 | 24-04-2007 | 58 | 28 | 9.81e+04 |
| Index | Source | |||||||||
| APEC | APEC | |||||||||
| 1 | IRAS F08572+3915 | – | – | – | – | – | – | – | – | – |
| 2 | IRAS F10565+2448 | – | – | 0 | ||||||
| 3 | IRAS 23365+3604 | – | – | – | – | – | – | – | – | – |
| 4 | Mrk 273 | – | - | |||||||
| 5 | Mrk 876 | – | – | 0 | ||||||
| 6 | I Zw 1 | – | – | |||||||
| 7 | MrK 231 | |||||||||
| 8 | NGC 1266 | |||||||||
| 9 | M 82 | – | – | |||||||
| 10 | NGC 13771 | – | – | – | – | – | – | – | – | – |
| 11 | NGC 6240 | – | ||||||||
| 12 | NGC 3256 | |||||||||
| 13 | NGC 3628 | – | ||||||||
| 14 | NGC 253 | – | – | – | – | – | – | – | – | – |
| 15 | NGC 6764 | – | ||||||||
| 16 | NGC 1068 | – | – | – | – | |||||
| 17 | IC 5063 | |||||||||
| 18 | NGC 2146 | – | ||||||||
| 19 | IRAS 17208-0014 | – | ||||||||
| 20 | NGC 1614 | – | ||||||||
| 21 | IRAS 05083+7936 | – | ||||||||
| 22 | IRAS 13451+1232 | – | ||||||||
| 23 | 3C 293 | |||||||||
| 24 | NGC 1433 | – | ||||||||
| 25 | IRAS 13120-5453 | – | ||||||||
| 26 | IRAS 14378-36511 | – | – | – | – | – | – | – | – | |
| 27 | IRAS F11119+3257 | – | ||||||||
| 28 | IRAS F01572+0009 | – | ||||||||
| 29 | IRAS F05024-1941 | – | ||||||||
| 30 | IRAS F05189-2524 | – | ||||||||
| 31 | IRAS 07251-0248 | – | – | – | – | – | – | – | – | – |
| 32 | IRAS F07599+6508 | |||||||||
| 33 | IRAS 09022-3615 | – | ||||||||
| 34 | IRAS F09320+6134 | – | ||||||||
| 35 | IRAS F12072-0444 | – | ||||||||
| 36 | IRAS F12112+0305 | – | ||||||||
| 37 | IRAS F14348-1447 | – | – | |||||||
| 38 | IRAS F14394+5332 | – | – | |||||||
| 39 | IRAS F15327+2340 | – | ||||||||
| 40 | IRAS F15462-0450 | – | ||||||||
| 41 | IRAS 19297-0406 | – | – | – | – | – | – | – | ||
| 42 | IRAS 19542+1110 | – | ||||||||
| 43 | IRAS F20551-4250 | – | ||||||||
| 44 | IRAS F23233+2817 | – | ||||||||
| 45 | NGC 5506 | – | – | |||||||
| 46 | NGC 7479 | – | – | – | – | – | – | – | – | – |
| 47 | NGC 7172 | – |
∗ Sources for which the powerlaw slope could not be constrained and hence fixed to .
| Index | Source | ||||
|---|---|---|---|---|---|
| (XMM/Chandra)1 | (NuSTAR)2 | Final selection5 | |||
| (1) | (2) | (3) | (4) | (5) | |
| 1 | IRAS F08572+3915(CT) | 43.38# | |||
| 2 | IRAS F10565+2448 | 41.25 | |||
| 3 | IRAS 23365+3604 | 41.51 | |||
| 4 | Mrk 273 | 42.93 | |||
| 5 | Mrk 876 | 44.11 | |||
| 6 | I Zw 1 | 43.62 | 43.62 | ||
| 7 | MrK 231 | 42.42 | 42.47 | ||
| 8 | NGC 1266 | 39.78 | 39.78 | ||
| 9 | M 82 | 40.32 | 40.32 | ||
| 10 | NGC 1377(CT) | 41.00# | |||
| 11 | NGC 6240(CT) | 42.28 | 43.84 | ||
| 12 | NGC 3256 | 40.96 | 40.96 | ||
| 13 | NGC 3628 | 40.22 | 40.22 | ||
| 14 | NGC 253 | 39.47 | |||
| 15 | NGC 6764 | 39.85 | 39.85 | ||
| 16 | NGC 1068(CT) | 40.95 | 43.84 | ||
| 17 | IC 5063 | 42.57 | 42.57 | ||
| 18 | NGC 2146 | 40.20 | 40.20 | ||
| 19 | IRAS 17208-0014 | 41.58 | 41.58 | ||
| 20 | NGC 1614 | 40.82 | 40.82 | ||
| 21 | IRAS 05083+7936 | 41.49 | 41.49 | ||
| 22 | IRAS 13451+1232 | 43.64 | 43.64 | ||
| 23 | 3C 293 | 42.85 | 42.85 | ||
| 24 | NGC 1433 | 39.01 | 39.01 | ||
| 25 | IRAS 13120-5453(CT) | 41.54 | 43.09 | ||
| 26 | IRAS 14378-3651 | 41.96 | |||
| 27 | IRAS F11119+3257 | 44.16 | 44.16 | ||
| 28 | IRAS F01572+0009 | 43.73 | 43.73 | ||
| 29 | IRAS F05024-1941 | 42.50 | 42.50 | ||
| 30 | IRAS F05189-2524 | 43.31 | 43.56 | ||
| 31 | IRAS 07251-0248 | 43.20 | |||
| 32 | IRAS F07599+6508 | 43.37 | 43.37 | ||
| 33 | IRAS 09022-3615 | 42.18 | 43.14 | ||
| 34 | IRAS F09320+6134 | 42.67 | 42.67 | ||
| 35 | IRAS F12072-0444 | 42.53 | 42.53 | ||
| 36 | IRAS F12112+0305 | 41.60 | 41.60 | ||
| 37 | IRAS F14348-1447(CT) | 41.96 | 43.96# | ||
| 38 | IRAS F14394+5332 | 41.97 | 41.97 | ||
| 39 | IRAS F15327+2340 | 41.16 | 41.16 | ||
| 40 | IRAS F15462-0450 | 45.96 | 42.96 | ||
| 41 | IRAS F19297-0406 | 41.25 | |||
| 42 | IRAS 19542+1110 | 42.62 | 42.61 | ||
| 43 | IRAS F20551-4250(CT) | 41.57 | 43.57# | ||
| 44 | IRAS F23233+2817 | 41.50 | 41.50 | ||
| 45 | NGC 5506 | 43.11 | 43.11 | ||
| 46 | NGC 7479 | 42.00 | |||
| 47 | NGC 7172 | 42.90 | 42.90 |
#The C-thick sources for which we multiplied the obtained in Column 3 by a factor of 100.
† The of the MOX sources estimated using the hardness ratio method.
Columns 1 & 2: The source indices and names.
Column 3: The values of the MOX sources obtained using X-ray spectral fits and HR method using XMM-Newton and Chandra observations.
References for HR method: a=Teng & Veilleux (2010), b=Iwasawa et al. (2011), c=Aalto et al. (2016), d=Krips et al. (2016), e=Iwasawa et al. (2011),f=Nardini & Risaliti (2011),g=Iwasawa et al. (2011)
Column 4: The intrinsic values obtained using NuSTAR observations.
References for NuSTAR observations: A=Teng et al. (2015), B=Teng et al. (2014); Reynolds et al. (2017), C=Puccetti et al. (2016), D=Lehmer et al. (2015), E=Lehmer et al. (2013),F=Marinucci et al. (2016), G=Teng et al. (2015), H=Teng et al. (2015), I=Luo et al. (2014), J=Oda et al. (2017)
Column 5: The final set of values of the MOX sources used in the correlations and analysis throughout this work.
∗ This was obtained using broad band X-ray spectroscopy using XMM-Newton observations by Brightman & Nandra (2011).
| Index | Source | ||
|---|---|---|---|
| m flux | |||
| () | () | ||
| 1 | IRAS F08572+3915 | 43.38 | |
| 2 | IRAS F10565+2448 | 41.25 | |
| 3 | IRAS 23365+3604 | 41.51 | |
| 4 | Mrk 273 | 42.93 | |
| 5 | Mrk 876 | 44.11 | |
| 6 | I Zw 1 | 43.62 | |
| 7 | MrK 231 | 42.47 | |
| 8 | NGC 1266 | 39.78 | |
| 9 | M 82 | 40.32 | |
| 10 | NGC 1377 | 41.00 | |
| 11 | NGC 6240 | 43.84 | |
| 12 | NGC 3256 | 40.96 | |
| 13 | NGC 3628 | 40.22 | |
| 14 | NGC 253 | 39.47 | – |
| 15 | NGC 6764 | 39.85 | |
| 16 | NGC 1068 | 43.84 | |
| 17 | IC 5063 | 42.57 | |
| 18 | NGC 2146 | 40.20 | |
| 19 | IRAS 17208-0014 | 41.58 | |
| 20 | NGC 1614 | 40.82 | – |
| 21 | IRAS 05083+7936 | 41.49 | – |
| 22 | IRAS 13451+1232 | 43.64 | |
| 23 | 3C 293 | 42.85 | – |
| 24 | NGC 1433 | 39.01 | – |
| 25 | IRAS 13120-5453 | 43.09 | |
| 26 | IRAS 14378-3651 | 41.96 | |
| 27 | IRAS F11119+3257 | 44.16 | |
| 28 | IRAS F01572+0009 | 43.73 | |
| 29 | IRAS F05024-1941 | 42.50 | |
| 30 | IRAS F05189-2524 | 43.56 | |
| 31 | IRAS 07251-0248 | 43.20 | |
| 32 | IRAS F07599+6508 | 43.37 | |
| 33 | IRAS 09022-3615 | 43.14 | |
| 34 | IRAS F09320+6134 | 42.67 | |
| 35 | IRAS F12072-0444 | 42.53 | |
| 36 | IRAS F12112+0305 | 41.60 | |
| 37 | IRAS F14348-1447 | 43.96 | |
| 38 | IRAS F14394+5332 | 41.97 | |
| 39 | IRAS F15327+2340 | 41.16 | |
| 40 | IRAS F15462-0450 | 42.96 | |
| 41 | IRAS F19297-0406 | 41.25 | |
| 42 | IRAS 19542+1110 | 42.61 | |
| 43 | IRAS F20551-4250 | 43.57 | |
| 44 | IRAS F23233+2817 | 41.50 | |
| 45 | NGC 5506 | 43.11 | |
| 46 | NGC 7479 | 42. | |
| 47 | NGC 7172 | 42.90 |
| Index | Source | References | |||||
|---|---|---|---|---|---|---|---|
| (in ) | for | ||||||
| 1 | IRAS F08572+3915 | 45.78 | 70.4 | 45.62 | 1 | -2.24 | -1.36 |
| 2 | IRAS F10565+2448 | 45.68 | 47.1 | 45.35 | 1 | -4.10 | -2.64 |
| 3 | IRAS 23365+3604 | 45.80 | 44.6 | 45.45 | 1 | -3.93 | -1.83 |
| 4 | Mrk 273 | 45.79 | 34.2 | 45.32 | 1 | -2.39 | -1.84 |
| 5 | Mrk 876 | 45.87 | 92.6 | 45.83 | 1 | -1.72 | -1.32 |
| 6 | I Zw 1 | 45.59 | 90.1 | 45.54 | 1 | -1.92 | -0.97 |
| 7 | MrK 231 | 46.18 | 80.5 | 46.08 | 1 | -3.62 | -1.32 |
| 8 | NGC 1266 | 43.91 | 25 | 43.30 | 2 | -3.52 | -1.40 |
| 9 | M 82 | 44.58 | 0.09 | 41.53 | 2 | -1.21 | -1.29 |
| 10 | NGC 1377 | 43.63 | 20 | 42.93 | 2 | -1.93 | -0.94 |
| 11 | NGC 6240 | 45.48 | 78 | 45.37 | 1 | -1.53 | -1.56 |
| 12 | NGC 3256 | 45.12 | 0.07 | 41.96 | 2 | -1.00 | -1.02 |
| 13 | NGC 3628 | 43.83 | 0.09 | 40.78 | 2 | -0.56 | -0.59 |
| 14 | NGC 253 | 44.06 | 0.04 | 40.66 | 2 | - | |
| 15 | NGC 6764 | 43.99 | 1.7 | 42.22 | 2 | -2.37 | -1.23 |
| 16 | NGC 1068 | 44.95 | 9.7 | 43.94 | 2 | -0.09 | -0.98 |
| 17 | IC 5063 | 44.34 | 90 | 44.29 | 2 | -1.72 | -0.83 |
| 18 | NGC 2146 | 44.61 | 0.03 | 41.08 | 2 | -0.88 | -1.25 |
| 19 | IRAS 17208-0014 | 46.08 | 5 | 44.77 | 1 | -3.19 | -2.07 |
| 20 | NGC 1614 | 45.34 | 0 | 0 | 4 | – | – |
| 21 | IRAS 05083+7936 | 45.63 | 0 | 0 | 1 | – | – |
| 22 | IRAS 13451+1232 | 45.96 | 80.6 | 45.87 | 1 | -2.23 | -1.26 |
| 23 | 3C 293 | - | - | - | - | – | – |
| 24 | NGC 1433 | - | - | - | - | – | – |
| 25 | IRAS 13120-5453 | 45.88 | 33.4 | 45.40 | 1 | -2.31 | -1.85 |
| 26 | IRAS 14378-3651 | 45.75 | 21.1 | 45.07 | 1 | -3.11 | -1.66 |
| 27 | IRAS F11119+3257 | 46.29 | 80 | 46.19 | 1 | -2.03 | -1.11 |
| 28 | IRAS F01572+0009 | 46.26 | 64.6 | 46.07 | 1 | -2.34 | -1.31 |
| 29 | IRAS F05024-1941 | 46.01 | 7.3 | 44.87 | 1 | -2.37 | -0.56 |
| 30 | IRAS F05189-2524 | 45.80 | 71.7 | 45.65 | 1 | -2.09 | -1.31 |
| 31 | IRAS 07251-0248 | 46.03 | 30.0 | 45.51 | 1 | -2.30 | -1.87 |
| 32 | IRAS F07599+6508 | 46.17 | 87.6 | 46.11 | 1 | -2.74 | -1.02 |
| 33 | IRAS 09022-3615 | 45.93 | 54.9 | 45.66 | 1 | -2.53 | -1.67 |
| 34 | IRAS F09320+6134 | 45.63 | 56.4 | 45.38 | 1 | -2.71 | -1.79 |
| 35 | IRAS F12072-0444 | 46.04 | 74.8 | 45.91 | 1 | -3.38 | -1.34 |
| 36 | IRAS F12112+0305 | 45.96 | 17.8 | 45.21 | 1 | -3.61 | -1.75 |
| 37 | IRAS F14348-1447 | 45.98 | 17.4 | 45.22 | 1 | -1.26 | -2.68 |
| 38 | IRAS F14394+5332 | 45.75 | 62.5 | 45.54 | 1 | -3.57 | -1.44 |
| 39 | IRAS F15327+2340 | 45.80 | 5.8 | 44.56 | 1 | -3.40 | -2.13 |
| 40 | IRAS F15462-0450 | 45.85 | 60.6 | 45.63 | 1 | -2.67 | -1.45 |
| 41 | IRAS F19297-0406 | 46.02 | 23.4 | 45.38 | 1 | -4.13 | -1.74 |
| 42 | IRAS 19542+1110 | 45.70 | 25.5 | 45.11 | 1 | -2.49 | -1.76 |
| 43 | IRAS F20551-4250 | 45.69 | 56.9 | 45.44 | 1 | -1.87 | -1.60 |
| 44 | IRAS F23233+2817 | 45.69 | 44.6 | 45.33 | 1 | -3.84 | -1.06 |
| 45 | NGC 5506 | 44.21 | 93.3 | 44.18 | 3 | -1.06 | -0.95 |
| 46 | NGC 7479 | 43.49 | 83.7 | 43.41 | 3 | -1.41 | -0.30 |
| 47 | NGC 7172 | 44.37 | 92.4 | 44.33 | 3 | -1.44 | -1.33 |
| Correlation | Dev() | Dev() | Data points | ||||
|---|---|---|---|---|---|---|---|
| vs MO vel | 47 | ||||||
| vs MO | 25 | ||||||
| vs MO vel | 43 | ||||||
| vs MO | 22 | ||||||
| vs MO vel | 31 | ||||||
| vs MO | 17 | ||||||
| vs MO vel | 43 | ||||||
| vs MO | 25 | ||||||
| vs MO vel | 43 | ||||||
| vs MO | 22 |
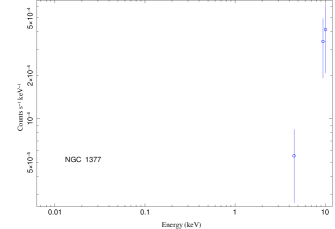
Appendix A A. The Best fit spectra and models
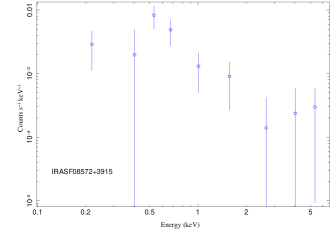
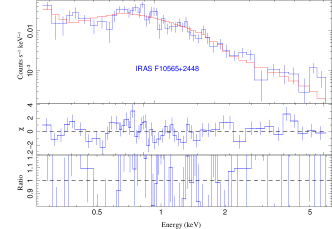
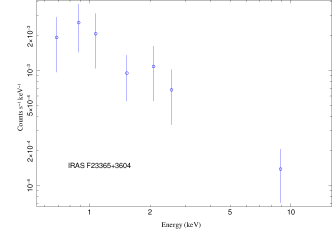
In this section we show the best fit data for the sources in the MOX sample, along with the best fit model and the residuals after the data have been fitted with the model. For sources with counts we have shown the spectra for viewing purpose only as we have used HR method to calculate the luminosity.
Appendix B B. Description of the individual sources in the MOX sample.
1. IRAS F08572+3915: This is a double nucleus ULIRG. The source has been identified as Compton thick (Teng & Veilleux, 2010), and the previous studies have estimated an absorption column density of . The powerlaw photon index is not constrained due to low counts. The authors classified this as a weak ULIRG. This source has also been studied by Iwasawa et al. (2011) using Chandra observations. The source luminosity estimated by the authors are and in the soft and the hard band respectively. Nustar hard X-ray studies were carried out by Teng et al. (2015) and the authors conclude that the source is X-ray weak and could not be detected in any of the NuSTAR energy bands. The molecular outflows in this source has been detected using IRAM PDBI telescope with the CO(1-0) emission line (Cicone et al., 2014).
In our analysis, we found that this source has very low counts and hence HR method was used to calculate the luminosity.
2. IRAS F10565+2448: This is a pair of interacting spiral galaxies, and is a heavily obscured source. Teng & Veilleux (2010) studied this source using Chandra observation and have estimated an absorption column density of , implying a Compton thin obscurer. The estimated powerlaw . Iwasawa et al. (2011) studied the Chandra observation of this source and have estimated a luminosity of and . The authors mention that the hard X-ray emission is point like but the soft X-ray emission is much more extended up to 7”. Nustar hard X-ray studies carried out by Teng et al. (2015) could not detect the source in any energy band of NuSTAR.
We could not constrain the intrinsic neutral absorption for this source. The best fit photon index is . In addition we required an absorption edge at .
3. IRAS 23365+3604:Iwasawa et al. (2011) studied the Chandra data of this source and found that it is a heavily obscured source. A faint X-ray source is present in the nucleus, which however could not be studied properly because of the short exposure of the observation (). The hard X-ray color HR=-0.22 points to the fact that this object is an AGN, which is Compton thick. This source was also studied by Teng et al. (2005), who found and an absorption column density of .
Due to lack of counts, HR method was used to calculate the luminosity .
4. MRK 273:Classified as Seyfert 2 (NED). Hernández-García et al. (2015) classified the candidate as a changing look candidate with both Compton thick and thin signatures available from different observations. Nustar hard X-ray studies were carried out by Teng et al. (2015) and an intrinsic luminosity of was derived.
In our study, we detected a broad Fe K line which was modeled by diskline profile. Soft X-ray emission lines were modeled using a Gaussian profile. We could not detect any neutral absorption intrinsic to the source. The powerlaw slope is very flat.
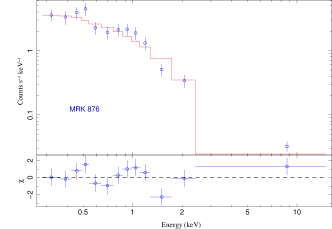
5. MRK 876: This is a Seyfert 1 galaxy and has a strong AGN at its centre. Early studies by Erkens et al. (1995) confirm the source to be variable in X-rays and UV. The Swift/XRT data studied by Bottacini et al. (2015) found a broad Fe K emission line. The Fe K line was also studied by de La Calle Pérez et al. (2010) using XMM-Newton data. Piconcelli et al. (2005) had studied this source as a part of a sample of PG quasars, and reported .
In our work, the data quality being poor, we could not constrain any intrinsic neutral absorption. The spectra just required an absorbed powerlaw, and the slope could be constrained. We derived similar X-ray luminosity as those of Piconcelli et al. (2005). The NuSTAR observation of this source is not yet made public.
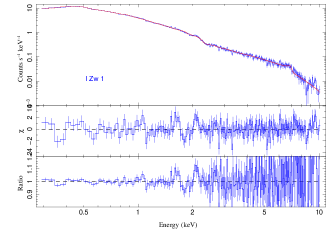
6. I Zw 1: This is a narrow line Sy 1 galaxy, and is highly variable. An extensive X-ray study of this source has been done by Gallo et al. (2007) and Piconcelli et al. (2005) studied the source as a part of a sample of PG quasars.
For this source we detected two components of warm absorbers. There was also the presence of a broad Fe K emission line and a neutral intrinsic absorption column.
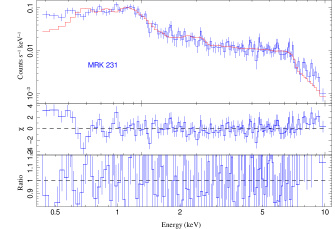
7. MRK 231: Obscured source with a strong AGN, studied by Teng & Veilleux (2010). A connection between MO and UFO is found in this source by Feruglio et al. (2015). The authors confirm an energy conserving mechanism responsible for creating the molecular outflows from the UFOs. Chandra imaging and spectroscopy has been carried out by Veilleux et al. (2014). A Nustar hard X-ray view of this source has been carried out by Teng et al. (2015). A separate study using Nustar data focussing only on this source has been carried out by Teng et al. (2014), and the authors measured an X-ray luminosity of . The authors concluded that this source is a Compton thin AGN.
We found that this source has a complex spectrum which required one component of warm absorber, one component of thermal emission (APEC), a neutral intrinsic absorption as well as a broad Fe K emission line. The powerlaw slope is flat and its lower value is pegged at .
8. NGC 1266: A nearby lenticular galaxy, harbouring an AGN which powers a massive MO detected in this source which harbours an AGN (Alatalo et al., 2015). Apart from extensive analysis of Chandra and XMM data, a multiwaveband study was carried out by the authors, weher they detected a soft emission from starburst, a powerlaw and Fe K line from the AGN. The intrinsic absorbtion column density estimated for this source from IR studies of (Alatalo et al., 2015) is , almost 3 orders of magnitude higher than that found using X-ray studies. Supression of Star formation in this S.B galaxy is studied by Alatalo et al. (2015). There is NuSTAR observation of this source but there is no published study.
In our study we found that this source has a complex spectrum which required a soft thermal component (APEC) along with a warm absorber, a neutral intrinsic absorber, and soft X-ray emission lines at and in the observer’s frame. The Fe K line was not detected due to poor SNR.
9. M 82: This is a starburst dominated galaxy. Liu et al. (2014) studied the nuclear region of the source with 500 ks Chandra data. Fe K line is detected, and most of the hard X-ray emission has a thermal origin. A weakly broadened Fe K line was detected by Caballero-García (2011).
The spectrum is complex with several discrete emission features in the soft X-ray band. We could not obtain a good statistical fit to the data with the baseline models used in this work. We detected narrow Fe K emission. A neutral intrinsic absorber has also been detected.
10. NGC 1377: Chandra and Swift data not published, hence no previous studies available for this source.
The source photon counts being weak, the HR method was used in our work.
11. NGC 6240: Mostly Compton thick galaxy merger. Puccetti et al. (2016) studied the source with Nustar data, and concluded that this source could be an early merger stage galaxy with two nuclei separated, and an intrinsic source luminosity of . Both active and obscured Compton thick material present. Wang et al. (2014) detected fast shock heated gas within 5 kpc of the central region. Nardini et al. (2013) and Feruglio et al. (2013) have studied the Chandra data and detected a soft X-ray halo, and also CO emission lines. Teng & Veilleux (2010) and Iwasawa et al. (2011) have studied the source in a sample. Netzer et al. (2005) have studied XMM-Newton observation of this source and found that starburst emission dominates the soft X-ray energy range.
In our study the X-ray spectra required a broad Fe K emission line, along with a soft X-ray emission line at . We could not constrain the intrinsic neutral absorption.
12. NGC 3256: Powerful starburst galaxy studied by Lehmer et al. (2015) with Chandra and Nustar data. Nature of X-ray emission is unclear as no obvious AGN signature was found. This galaxy was studied by Jenkins et al. (2004) and was referred to as starburst merger galaxy, and a hard X-ray bolometric correction was estimated to be . The has been estimated mostly from the ULXs and crowded X-ray sources, and not an AGN.
In our study we found that the X-ray spectrum is complex. It required two thermal components in the soft X-rays (APEC), one neutral intrinsic absorber, and three Gaussian emission lines for three Fe K emission lines at different ionisation states.
13. NGC 3628: Tsai et al. (2012) studied this starburst galaxy and found connection between MO and emission line plasma in X-rays. A study of the source was carried out by Strickland et al. (2001) using Chandra data, where they find a luminous X-ray source 20” away from the nucleus.
The spectrum required one thermal component (APEC), neutral intrinsic absorption and a high energy absorption in the Fe K band which was modeled using an inverted Gaussian. The powerlaw slope is pegged at .
14. NGC 253: A highly variable starburst galaxy studied by Nustar Lehmer et al. (2013). Nustar and Chandra data reveal that the nuclear region contains three bright X-ray point sources which are ULXs and not an AGN, and highly obscured with a column density of . The Fe K line complex was studied by Mitsuishi et al. (2011) and found several highly ionised Fe K emission lines.
Due to low photon counts, HR method was employed in our work.
15. NGC 6764: This is an AGN + Starburst galaxy and the chandra data is studied by Croston et al. (2008).
The hard X-ray band has very few counts, hence the powerlaw slope upperlimit could not be constrained, . The soft X-ray emission was modeled using Apec.
16. NGC 1068: Compton thick Sy 2 galaxy was studied by Nustar data by Bauer et al. (2015). Multi component X-ray reflectors were needed to fit the data. Kallman et al. (2014) studied the source with Chandra data, and found the amount of mass of gas necessary for the emission in X-rays is . Shu et al. (2011) studied the Fe K line emission of the source. Marinucci et al. (2016) studied the source using Nustar data unveiling the obscured source.
This source could not be modeled with the baseline model. The spectra shows a very uniqe broad Fe K emission line, typical of Compton thick objects.
17. IC 5063: Classified as narrow line Sy 2 radio galaxies and the Suzaku data are studied by Tazaki et al. (2011). There is a Nustar data but not published. Marinucci et al. (2012) also studied the source in a sample of Sy 2 sources which have exhibited broad Fe K line in reflected spectra. The source is classified as Compton thin by Marinucci et al. (2012).
Absorbed source with a concave spectra in the hard X-rays and diffuse soft X-ray emission. An absorbed powerlaw and a blackbody for the diffuse soft X-ray emission could fit the data. There could be X-ray contribution from radio jets.
18. NGC 2146: The Chandra observation of this starburst galaxy was carried out by Inui et al. (2005). There were 6 ultra-luminous point sources detected in the field of view.
In our work we found that the spectra can be modeled by an absorbed powerlaw only.
19. IRAS 17208-0014: Teng & Veilleux (2010) and Iwasawa et al. (2011) have studied this source. This is a luminous ULIRG.
In our work the powerlaw slope could not be constrained due to low photon counts.
20. NGC 1614: ULIRG, and a star forming galaxy studied in the multiwaveband by Herrero-Illana et al. (2014). This is also detected as a merger remnant by Saito et al. (2017) using ALMA data. The nature of the dominant emitting mechanism at the centre is still under debate, however AGN presence may not be needed to describe the spectral properties. Possibly a compact starburst () is present. The total IR luminosity is Armus et al. (2009); Herrero-Illana et al. (2014). An upper limit to AGN luminosity is given by the authors, .
In our study, the powerlaw slope could not be constrained due to low photon counts.
21. IRAS 05083+7936: This is an absorbed quasar. Ballo et al. (2014) had studied this absorbed quasar. Nustar hard X-ray studies carried out by Teng et al. (2015).
In our work, the powerlaw slope could not be constrained due to low photon counts.
22. IRAS 13451+1232: A Seyfert 2 galaxy. Jia et al. (2013), Teng & Veilleux (2010) and LaMassa et al. (2014) studied the source in X-rays.
We found that the hard X-ray photon count is poor, however, the powerlaw slope and the absorption column could be constrained.
23. 3C 293:Lanz et al. (2015) studied the Jet-ISM interaction of this radio loud source and states how the molecular gas is heated by the jets. Only Chandra data available for this source.
24. NGC 1433:Only Chandra data available which is not published.
In our study we found the source has very poor data counts. The powerlaw slope as well as the intrinsic neutral absorption column density were frozen to a value of and , as they could not be constrained.
25. IRAS 13120-5453: 129 ks XMM-Newton data is not published yet. Nustar hard X-ray studies carried out by Teng et al. (2015) who confirms it as Compton thick AGN.
We found that this source has a narrow Fe K emission line.
26. IRAS 14378-3651: Nustar hard X-ray studies carried out by Teng et al. (2015) and the authors do not detect any source X-ray flux beyond . The Chandra spectra have been studied by Iwasawa et al. (2011).
27. IRAS F11119+3257: Studied by Tombesi et al. (2015) who found strong molecular outflows in IR using Herschel PACS as well as ultrafast outflows in the Xrays using Suzaku telescope. Tombesi et al. (2017) observed this source with NuSTAR and detected a similar observed flux as ours.
We found that this is a bright source and could be modeled with a simple absorbed powerlaw and a very weak bbody for the soft emission.
28. IRAS F01572+0009: This source is also known as MRK 1014 alias PG0157+001. It has been studied by Ricci et al. (2014) and a luminosity of has been estimated using the same dataset used by us. The authors have detected reflection from distant matter and used the model Mytorus.
We found that this is a low count source which could be modeled with a simple absorbed powerlaw and a bbody for the soft emission. The data did not require a neutral intrinsic absorber.
29. IRAS F05024-1941: This is a ULIRG and was studied by Teng & Veilleux (2010) and the authors have used HR method to calculate the flux.
The source has very low photon counts. The powerlaw slope and the neutral absorber could not be constrained.
30. IRAS F05189-2524: A ULIRG studied by Teng & Veilleux (2010) and the authors found .
The soft emission was modeled using two bbody components. The spectra required two Gaussian emission lines for two Fe K complex. The spectra is concave indicating neutral absorption.
31. IRAS 07251-0248: This source is a ULIRG and has been studied by Iwasawa et al. (2011) as well as by Teng & Veilleux (2010) both of whom found the source to be Compton thin AGN. However, the source could not be detected in the X-rays (Chandra) by the authors (as well as by us) due to its weakness and obscuration. The X-ray flux of the source estimated from the infra-red analysis is (Nardini & Risaliti, 2011).
32. IRAS F07599+6508: This is a Compton thin absorbed ULIRG. Teng & Veilleux (2010) studied this source and calculated a luminosity of using HR method. Imanishi & Terashima (2004) studied a sample of four ULIRGs with detectable broad near-infrared-emission lines produced by AGN, one of the sources being IRAS F07599+6508. Using spectral analysis they could constrain the luminosity of the AGN .
Very low photon counts did not allow us to constrain the powerlaw slope or the of the intrinsic absorber.
33. IRAS 09022-3615: This is a LIRG and Iwasawa et al. (2011) calculated an X-ray luminosity of . The authors found that the hard X-ray source is marginally resolved.
Very low photon counts did not allow us to constrain the powerlaw slope or the of the intrinsic absorber.
34. IRAS F09320+6134: The alternative name of this source is UGC 05101 and was studied in a large sample of ULIRGs by U et al. (2012). The authors have also estimated the infrared luminosity for all the sources. The X-ray flux estimated is which is higher than our estimate of .
Very low photon counts did not allow us to constrain the powerlaw slope or the of the intrinsic absorber.
35. IRAS F12072-0444: This is a ULIRG and was studied by Teng & Veilleux (2010) who have calculated a luminosity of . Very low photon counts did not allow us to constrain the powerlaw slope or the of the intrinsic absorber.
36. IRAS F12112+0305: This is a ULIRG and was studied by Teng & Veilleux (2010) and Iwasawa et al. (2011) who have calculated a luminosity of and respectively.
Very low photon counts did not allow us to constrain the powerlaw slope or the of the intrinsic absorber.
37. IRAS F14348-1447: This is a ULIRG studied by Teng & Veilleux (2010) who estimated a luminosity of
Very low photon counts did not allow us to constrain the powerlaw slope or the of the intrinsic absorber.
38. IRAS F14394+5332: This source has not been studied before.
Very low photon counts did not allow us to constrain the powerlaw slope or the of the intrinsic absorber.
39. IRAS F15327+2340: This source is also known as ARP 220 and i a starburst galaxy. LaMassa et al. (2012) have worked on a sample of sources including this source where the authors have attempted to disentangle the AGN and starburst contribution of the sources in the soft X-ray band. Also studied by Teng & Veilleux (2010) and they calculated a luminosity of .
Very low photon counts did not allow us to constrain the powerlaw slope or the of the intrinsic absorber.
40. IRAS F15462-0450: ULIRG studied by Teng & Veilleux (2010) and they calculated a luminosity of using HR method. Very low photon counts did not allow us to constrain the powerlaw slope or the of the intrinsic absorber.
41. IRAS 19297-0406: This source is a very faint source in X-rays and studied as a part of C-goals by Iwasawa et al. (2011) who calculated an X-ray luminosity of using the HR method.
No significant counts. Hence we used previous studies to estimate the X-ray luminosity.
42. IRAS 19542+1110 : This source is a very faint source in X-rays and studied as a part of C-goals by Iwasawa et al. (2011) who calculated an X-ray luminosity of using the HR method.
Very low photon counts did not allow us to constrain the powerlaw slope or the of the intrinsic absorber.
43. IRAS F20551-4250: Also known as ESO 286-IG19 and studied by Iwasawa et al. (2011) who calculated an X-ray luminosity of .
Very low photon counts did not allow us to constrain the powerlaw slope or the of the intrinsic absorber.
44. IRAS F22491-1808: Both the papers Iwasawa et al. (2011) and Teng & Veilleux (2010) discuss this source and the luminosity calculated by them are and respectively.
Very low photon counts did not allow us to constrain the powerlaw slope or the of the intrinsic absorber.
45. NGC 5506: Guainazzi et al. (2010) studied the source which is an X-ray obscured Seyfert galaxy with a broad Fe K emission line. The maximum value of the luminosity quoted for this source is .
The source is an obscured Seyfert 1 galaxy.
46. NGC 7479: Akylas & Georgantopoulos (2009) studied the source in a sample of Sy1, Sy2 and Compton thick galaxies, where they infer an X-ray luminosity of . The source is a Seyfert 2 galaxy with significant obscuration.
No significant counts. Hence we used previous studies to estimate the X-ray luminosity.
47. NGC 7172: Guainazzi et al. (1998) studied this Seyfert 2 source and calculated a luminosity of . The source is an obscured Seyfert 1 galaxy.
Appendix C C. Sources in MOX sample without NuSTAR observations, as on December 2017.
In this section we list the 23 sources in the MOX sample which have not been observed by NuSTAR. The sources are:IRAS 23365+3604, IZw1, NGC 1377, NGC 3628, NGC 2146, NGC 6764, IRAS 17208-0014, NGC 1614, IRAS05083+7936, IRAS13451+1232, 3C293, NGC1433, IRASF01572+0009, IRASF05024-1941, IRAS07251-0248, IRAS 09022-3615, IRASF12112+0305, IRASF14348-1447, IRASF14394+5332, IRASF15462-0450, IRASF19297-0406, IRAS19542+1110, and IRASF23233+2817.
Author SL is grateful to Silvia Martocchia for supplying the X-ray bolometric corrections and AGN bolometric luminosities for the PG quasars and the high redshift bright quasar sample (WISSH). Author SL is also grateful to Daniel Stern, Sylvain Veilleux, Richard Mushotzky and Richard Rothschild for sharing interesting ideas involved in this work. This research has made use of the NASA/IPAC Extragalactic Database (NED) which is operated by the Jet Propulsion Laboratory, California Institute of Technology, under contract with the National Aeronautics and Space Administration.
References
- Aalto et al. (2012) Aalto, S., Muller, S., Sakamoto, K., Gallagher, J. S., Martín, S., & Costagliola, F. 2012, A&A, 546, A68
- Aalto et al. (2016) Aalto, S., et al. 2016, A&A, 590, A73
- Akritas & Bershady (1996) Akritas, M. G., & Bershady, M. A. 1996, ApJ, 470, 706
- Akylas & Georgantopoulos (2009) Akylas, A., & Georgantopoulos, I. 2009, A&A, 500, 999
- Alatalo et al. (2011) Alatalo, K., Blitz, L., Young, L. M., & Davis, T. A. 2011, ApJ, 735, 88
- Alatalo et al. (2015) Alatalo, K., et al. 2015, ApJ, 798, 31
- Armus et al. (2009) Armus, L., Mazzarella, J. M., Evans, A. S., Surace, J. A., & Sanders, D. B. 2009, PASP, 121, 559
- Asmus et al. (2015) Asmus, D., Gandhi, P., Hönig, S. F., Smette, A., & Duschl, W. J. 2015, MNRAS, 454, 766
- Ballo et al. (2014) Ballo, L., Severgnini, P., Della Ceca, R., Caccianiga, A., Vignali, C., Carrera, F. J., Corral, A., & Mateos, S. 2014, MNRAS, 444, 2580
- Bauer et al. (2015) Bauer, F. E., Arevalo, P., Walton, D. J., & Koss, M. J. . 2015, ApJ, 812, 116
- Bottacini et al. (2015) Bottacini, E., Orlando, E., Greiner, J., Ajello, M., Moskalenko, I., & Persic, M. 2015, ApJ, 798, L14
- Brightman & Nandra (2011) Brightman, M., & Nandra, K. 2011, MNRAS, 413, 1206
- Brusa et al. (2015) Brusa, M., Feruglio, C., Cresci, G., Mainieri, V., Sargent, M. T., Perna, M., & Santini, e. a. 2015, A&A, 578, A11
- Brusa et al. (2018) Brusa, M., et al. 2018, A&A, 612, A29
- Caballero-García (2011) Caballero-García, M. D. 2011, MNRAS, 418, 1973
- Cicone et al. (2014) Cicone, C., et al. 2014, A&A, 562, A21
- Combes et al. (2013) Combes, F., et al. 2013, A&A, 558, A124
- Costagliola et al. (2016) Costagliola, F., Herrero-Illana, R., Lohfink, A., Pérez-Torres, M., Aalto, S., Muller, S., & Alberdi, A. 2016, A&A, 594, A114
- Croston et al. (2008) Croston, J. H., Hardcastle, M. J., Kharb, P., Kraft, R. P., & Hota, A. 2008, ApJ, 688, 190
- Dasyra et al. (2014) Dasyra, K. M., Combes, F., Novak, G. S., Bremer, M., Spinoglio, L., Pereira Santaella, M., Salomé, P., & Falgarone, E. 2014, A&A, 565, A46
- de La Calle Pérez et al. (2010) de La Calle Pérez, I., et al. 2010, A&A, 524, A50
- Diamond-Stanic et al. (2012) Diamond-Stanic, A. M., Moustakas, J., Tremonti, C. A., Coil, A. L., Hickox, R. C., Robaina, A. R., Rudnick, G. H., & Sell, P. H. 2012, ApJ, 755, L26
- Ducci et al. (2013) Ducci, L., Sasaki, M., Haberl, F., & Pietsch, W. 2013, A&A, 553, A7
- Elvis et al. (1994) Elvis, M., et al. 1994, ApJS, 95, 1
- Erkens et al. (1995) Erkens, U., Wagner, S. J., Alloin, D., & Axon. 1995, A&A, 296, 90
- Fabian (2012) Fabian, A. C. 2012, ARAA, 50, 455
- Faucher-Giguère & Quataert (2012) Faucher-Giguère, C.-A., & Quataert, E. 2012, MNRAS, 425, 605
- Ferrarese & Merritt (2000) Ferrarese, L., & Merritt, D. 2000, ApJ, 539, L9
- Feruglio et al. (2013) Feruglio, C., et al. 2013, A&A, 549, A51
- Feruglio et al. (2015) —. 2015, A&A, 583, A99
- Fiore et al. (2017) Fiore, F., et al. 2017, A&A, 601, A143
- Gallo et al. (2007) Gallo, L. C., Brandt, W. N., Costantini, E., Fabian, A. C., Iwasawa, K., & Papadakis, I. E. 2007, MNRAS, 377, 391
- Gandhi et al. (2009) Gandhi, P., Horst, H., Smette, A., Hönig, S., Comastri, A., Gilli, R., Vignali, C., & Duschl, W. 2009, A&A, 502, 457
- García-Burillo et al. (2015) García-Burillo, S., et al. 2015, A&A, 580, A35
- Geach et al. (2014) Geach, J. E., et al. 2014, Nat, 516, 68
- Gebhardt et al. (2000) Gebhardt, K., et al. 2000, ApJ, 539, L13
- Guainazzi et al. (2010) Guainazzi, M., Bianchi, S., Matt, G., Dadina, M., Kaastra, J., Malzac, J., & Risaliti, G. 2010, MNRAS, 406, 2013
- Guainazzi et al. (1998) Guainazzi, M., Matt, G., Antonelli, L. A., Fiore, F., Piro, L., & Ueno, S. 1998, MNRAS, 298, 824
- Hernán-Caballero et al. (2015) Hernán-Caballero, A., et al. 2015, ApJ, 803, 109
- Hernández-García et al. (2015) Hernández-García, L., Masegosa, J., González-Martín, O., & Márquez, I. 2015, A&A, 579, A90
- Herrero-Illana et al. (2014) Herrero-Illana, R., Perez-Torres, M. Á., & Alonso-Herrero. 2014, ApJ, 786, 156
- Hopkins & Elvis (2010) Hopkins, P. F., & Elvis, M. 2010, MNRAS, 401, 7
- Houck & Denicola (2000) Houck, J. C., & Denicola, L. A. 2000, in Astronomical Society of the Pacific Conference Series, Vol. 216, Astronomical Data Analysis Software and Systems IX, ed. N. Manset, C. Veillet, & D. Crabtree, 591
- Imanishi & Terashima (2004) Imanishi, M., & Terashima, Y. 2004, aj, 127, 758
- Inui et al. (2005) Inui, T., Matsumoto, H., Tsuru, T. G., Koyama, K., Matsushita, S., Peck, A. B., & Tarchi, A. 2005, PASJ, 57, 135
- Iwasawa et al. (2011) Iwasawa, K., et al. 2011, A&A, 529, A106
- Jenkins et al. (2004) Jenkins, L. P., Roberts, T. P., Ward, M. J., & Zezas, A. 2004, MNRAS, 352, 1335
- Jia et al. (2013) Jia, J., Ptak, A., Heckman, T., & Zakamska, N. L. 2013, ApJ, 777, 27
- Kalberla et al. (2005) Kalberla, P. M. W., Burton, W. B., Hartmann, D., Arnal, E. M., Bajaja, E., Morras, R., & Pöppel, W. G. L. 2005, A&A, 440, 775
- Kallman et al. (2014) Kallman, T., Evans, D. A., Marshall, H., Canizares, C., Longinotti, A., Nowak, M., & Schulz, N. 2014, ApJ, 780, 121
- Krips et al. (2016) Krips, M., Martín, S., Sakamoto, K., & Aalto. 2016, A&A, 592, L3
- Labiano et al. (2014) Labiano, A., et al. 2014, A&A, 564, A128
- Laha et al. (2014) Laha, S., Guainazzi, M., Dewangan, G. C., Chakravorty, S., & Kembhavi, A. K. 2014, MNRAS, 441, 2613
- LaMassa et al. (2012) LaMassa, S. M., Heckman, T. M., & Ptak, A. 2012, ApJ, 758, 82
- LaMassa et al. (2014) LaMassa, S. M., Yaqoob, T., Ptak, A. F., Jia, J., Heckman, T. M., Gandhi, P., & Meg Urry, C. 2014, ApJ, 787, 61
- Lamastra et al. (2009) Lamastra, A., Bianchi, S., Matt, G., Perola, G. C., Barcons, X., & Carrera, F. J. 2009, A&A, 504, 73
- Lampton et al. (1976) Lampton, M., Margon, B., & Bowyer, S. 1976, ApJ, 208, 177
- Lanz et al. (2015) Lanz, L., Ogle, P. M., Evans, D., Appleton, P. N., Guillard, P., & Emonts, B. 2015, ApJ, 801, 17
- Laor et al. (1994) Laor, A., Fiore, F., Elvis, M., Wilkes, B. J., & McDowell, J. C. 1994, ApJ, 435, 611
- Lehmer et al. (2013) Lehmer, B. D., et al. 2013, ApJ, 771, 134
- Lehmer et al. (2015) —. 2015, ApJ, 806, 126
- Leroy et al. (2015) Leroy, A. K., Walter, F., Decarli, R., Bolatto, A., Zschaechner, L., & Weiss, A. 2015, ApJ, 811, 15
- Liu et al. (2014) Liu, J., Gou, L., Yuan, W., & Mao, S. 2014, MNRAS, 437, L76
- Luo et al. (2013) Luo, B., Brandt, W. N., Alexander, D. M., Harrison, F. A., & Stern, D. 2013, ApJ, 772, 153
- Luo et al. (2014) Luo, B., Brandt, W. N., Alexander, D. M., & Stern, D. 2014, ApJ, 794, 70
- Maiolino et al. (1997) Maiolino, R., Ruiz, M., Rieke, G. H., & Papadopoulos, P. 1997, ApJ, 485, 552
- Marinucci et al. (2012) Marinucci, A., Bianchi, S., Nicastro, F., Matt, G., & Goulding, A. D. 2012, ApJ, 748, 130
- Marinucci et al. (2016) Marinucci, A., et al. 2016, MNRAS, 456, L94
- Martocchia et al. (2017) Martocchia, S., et al. 2017, A&A, 608, A51
- Mauersberger et al. (1996) Mauersberger, R., Henkel, C., Wielebinski, R., Wiklind, T., & Reuter, H.-P. 1996, A&A, 305, 421
- Mitsuishi et al. (2011) Mitsuishi, I., Yamasaki, N. Y., & Takei, Y. 2011, ApJ, 742, L31
- Mitsuishi et al. (2013) —. 2013, PASJ, 65, 44
- Nardini & Risaliti (2011) Nardini, E., & Risaliti, G. 2011, MNRAS, 415, 619
- Nardini et al. (2013) Nardini, E., Wang, J., Fabbiano, G., Elvis, M., Pellegrini, S., Risaliti, G., Karovska, M., & Zezas, A. 2013, ApJ, 765, 141
- Nemmen et al. (2012) Nemmen, R. S., Georganopoulos, M., Guiriec, S., Meyer, E. T., Gehrels, N., & Sambruna, R. M. 2012, Science, 338, 1445
- Netzer et al. (2005) Netzer, H., Lemze, D., Kaspi, S., George, I. M., Turner, T. J., Lutz, D., Boller, T., & Chelouche, D. 2005, ApJ, 629, 739
- Oda et al. (2017) Oda, S., Tanimoto, A., Ueda, Y., Imanishi, M., Terashima, Y., & Ricci, C. 2017, ApJ, 835, 179
- Piconcelli et al. (2005) Piconcelli, E., Jimenez-Bailón, E., Guainazzi, M., Schartel, N., Rodríguez-Pascual, P. M., & Santos-Lleó, M. 2005, A&A, 432, 15
- Proga & Kallman (2004) Proga, D., & Kallman, T. R. 2004, ApJ, 616, 688
- Puccetti et al. (2016) Puccetti, S., Comastri, A., Bauer, F. E., & Brandt. 2016, A&A, 585, A157
- Reynolds et al. (2017) Reynolds, C., Punsly, B., Miniutti, G., O’Dea, C. P., & Hurley-Walker, N. 2017, ApJ, 836, 155
- Ricci et al. (2014) Ricci, C., Ueda, Y., Ichikawa, K., Paltani, S., Boissay, R., Gandhi, P., Stalevski, M., & Awaki, H. 2014, A&A, 567, A142
- Ricci et al. (2017) Ricci, C., et al. 2017, MNRAS, 468, 1273
- Saito et al. (2017) Saito, T., et al. 2017, ApJ, 835, 174
- Sakamoto et al. (2006) Sakamoto, K., Ho, P. T. P., & Peck, A. B. 2006, ApJ, 644, 862
- Sanders & Mirabel (1985) Sanders, D. B., & Mirabel, I. F. 1985, ApJ, 298, L31
- Sanders et al. (1988) Sanders, D. B., Soifer, B. T., Elias, J. H., Madore, B. F., Matthews, K., Neugebauer, G., & Scoville, N. Z. 1988, ApJ, 325, 74
- Sell et al. (2014) Sell, P. H., et al. 2014, MNRAS, 441, 3417
- Sharma & Nath (2013) Sharma, M., & Nath, B. B. 2013, ApJ, 763, 17
- Shu et al. (2011) Shu, X. W., Yaqoob, T., & Wang, J. X. 2011, ApJ, 738, 147
- Smith et al. (2001) Smith, R. K., Brickhouse, N. S., Liedahl, D. A., & Raymond, J. C. 2001, ApJ, 556, L91
- Stone et al. (2016) Stone, M., Veilleux, S., Meléndez, M., Sturm, E., Graciá-Carpio, J., & González-Alfonso, E. 2016, ApJ, 826, 111
- Strickland et al. (2001) Strickland, D. K., Colbert, E. J. M., Heckman, T. M., Weaver, K. A., Dahlem, M., & Stevens, I. R. 2001, ApJ, 560, 707
- Sturm et al. (2011) Sturm, E., et al. 2011, ApJ, 733, L16
- Tazaki et al. (2011) Tazaki, F., Ueda, Y., Terashima, Y., & Mushotzky, R. F. 2011, ApJ, 738, 70
- Teng et al. (2014) Teng, S. H., Brandt, W. N., & Harrison, F. A. 2014, ApJ, 785, 19
- Teng et al. (2015) Teng, S. H., Rigby, J. R., Stern, D., & Ptak. 2015, ApJ, 814, 56
- Teng & Veilleux (2010) Teng, S. H., & Veilleux, S. 2010, ApJ, 725, 1848
- Teng et al. (2005) Teng, S. H., Wilson, A. S., Veilleux, S., Young, A. J., Sanders, D. B., & Nagar, N. M. 2005, ApJ, 633, 664
- Tombesi et al. (2015) Tombesi, F., Meléndez, M., Veilleux, S., Reeves, J. N., González-Alfonso, E., & Reynolds, C. S. 2015, Nat, 519, 436
- Tombesi et al. (2017) Tombesi, F., Veilleux, S., Meléndez, M., Lohfink, A., Reeves, J. N., Piconcelli, E., Fiore, F., & Feruglio, C. 2017, ApJ, 850, 151
- Tsai et al. (2012) Tsai, A.-L., Matsushita, S., Kong, A. K. H., Matsumoto, H., & Kohno, K. 2012, ApJ, 752, 38
- Tsai et al. (2006) Tsai, C.-W., Turner, J. L., Beck, S. C., Crosthwaite, L. P., Ho, P. T. P., & Meier, D. S. 2006, aj, 132, 2383
- U et al. (2012) U, V., Sanders, D. B., Mazzarella, J. M., & Evans. 2012, ApJS, 203, 9
- Vasudevan & Fabian (2009) Vasudevan, R. V., & Fabian, A. C. 2009, MNRAS, 392, 1124
- Vasudevan et al. (2010) Vasudevan, R. V., Fabian, A. C., Gandhi, P., Winter, L. M., & Mushotzky, R. F. 2010, MNRAS, 402, 1081
- Vasudevan et al. (2009) Vasudevan, R. V., Mushotzky, R. F., Winter, L. M., & Fabian, A. C. 2009, MNRAS, 399, 1553
- Veilleux et al. (2017) Veilleux, S., Bolatto, A., Tombesi, F., Meléndez, M., Sturm, E., González-Alfonso, E., Fischer, J., & Rupke, D. S. N. 2017, ApJ, 843, 18
- Veilleux et al. (2013) Veilleux, S., Melendez, M., Sturm, E., & Gracia-Carpio, J. 2013, ApJ, 776, 27
- Veilleux et al. (2014) Veilleux, S., Teng, S. H., Rupke, D. S. N., Maiolino, R., & Sturm, E. 2014, ApJ, 790, 116
- Walter et al. (2002) Walter, F., Weiss, A., & Scoville, N. 2002, ApJ, 580, L21
- Wang et al. (2014) Wang, J., et al. 2014, ApJ, 781, 55
- Wiklind et al. (1995) Wiklind, T., Combes, F., & Henkel, C. 1995, A&A, 297, 643
- Zubovas & King (2012) Zubovas, K., & King, A. 2012, ApJ, 745, L34