A low-density hot Jupiter in a near-aligned, 4.5-day orbit around a , F5V star
Abstract
We report the independent discovery and characterisation of a hot Jupiter in a 4.5-d, transiting orbit around the star TYC 7282-1298-1 (, F5V). The planet has been pursued by the NGTS team as NGTS-2b and by ourselves as WASP-179b. We characterised the system using a combination of photometry from WASP-South and TRAPPIST-South, and spectra from CORALIE (around the orbit) and HARPS (through the transit). We find the planet’s orbit to be nearly aligned with its star’s spin. From a detection of the Rossiter-McLaughlin effect, we measure a projected stellar obliquity of . From line-profile tomography of the same spectra, we measure . We find the planet to have a low density ( = 0.67 0.09 , = 1.54 0.06 ), which, along with its moderately bright host star, makes it a good target for transmission spectroscopy. We find a lower stellar mass ( = ) than reported by the NGTS team ( = ), though the difference is only .
1 Introduction
Ground-based transit surveys are well matched to finding ‘hot Jupiters’, gas-giant planets in close orbits of a few days. Such systems are among the best targets for characterisation of planetary atmospheres, particularly when the host star is relatively bright and when the planet is bloated (e.g. Wyttenbach et al. 2017; Kreidberg et al. 2018; Spake et al. 2018).
Raynard et al. (2018), hereafter R18, recently reported the discovery and characterisation of a hot Jupiter in a transiting orbit around the star TYC 7282-1298-1. Having detected transits of the star using the Next Generation Transit Survey (NGTS; Wheatley et al. 2018), R18 confirmed the existence of the planet and derived the system’s parameters using a combination of the transit lightcurves from NGTS and radial velocities around the orbit calculated from HARPS spectra (Pepe et al., 2002). R18 reported NGTS-2b to be a low-density planet ( = 0.74 0.13 , = 1.595 0.046 ) in a 4.51-d orbit around a rapidly rotating ( = 15.2 0.8 km s-1) F5V star.
The WASP transit survey (Pollacco et al., 2006) had also been following the star since finding a transit signal and adopting it as a candidate in 2013. We present here an independent discovery and characterisation of the system, which we also designate WASP-179 (noting that many planetary systems have been given designations by more than one transit team; e.g. Labadie-Bartz et al. 2018). Being rare, the reporting of such an independent discovery is an important verification of the planet and a validation of the techniques of the respective surveys.
In addition to transit photometry and spectra around the orbit, we report spectra taken through a transit of the planet, from which we derive the projected stellar obliquity (projected spin-orbit angle, ). Stellar obliquity is considered a diagnostic for the mechanisms via which hot Jupiters migrated to their current orbits (see Dawson & Johnson 2018 for a recent review on the origins of hot Jupiters).
2 Observations
We observed WASP-179 () during 2006–2008 and during 2011–2014 with the WASP-South facility (Fig. 1, top panel; Pollacco et al. 2006), and identified it as a candidate transiting-planet system using the techniques described in Collier Cameron et al. (2006, 2007). We conducted photometric follow-up using the 0.6-m TRAPPIST-South imager (Gillon et al., 2011; Jehin et al., 2011) and spectroscopic follow-up using both CORALIE on the 1.2-m Euler-Swiss telescope (Queloz et al., 2000) and HARPS on the 3.6-m ESO telescope (Pepe et al., 2002).
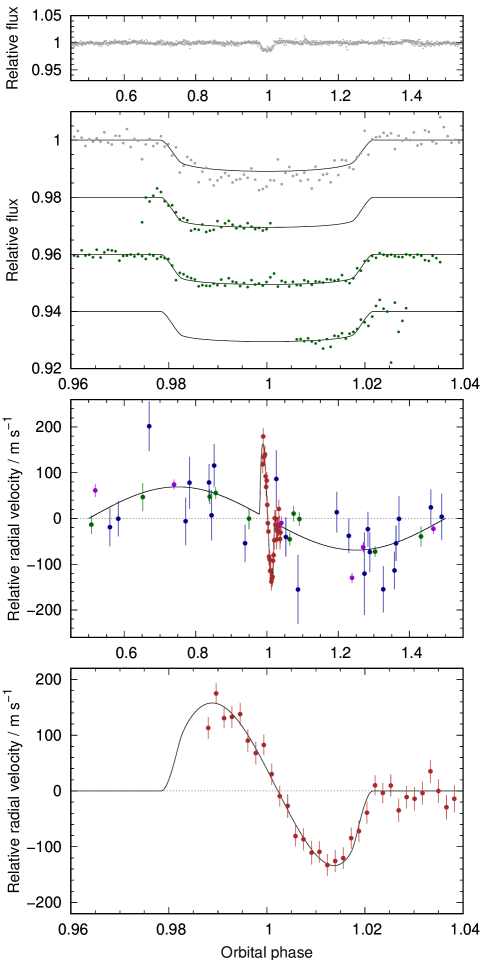
From the TRAPPIST photometry we confirmed that the periodic photometric dip is on-target and that the transit ephemeris and shape are consistent with the WASP-South photometry (Fig. 1, second panel).
An unresolved star can impact the determination of the system parameters by diluting the transits (e.g. Evans et al. 2016; Günther et al. 2018), but the Gaia DR2 (Gaia Collaboration et al., 2018) excludes nearby sources beyond its angular resolution limit of 0.4″.
We computed radial-velocity (RV) measurements from the CORALIE and HARPS spectra by weighted cross-correlation with a G2 binary mask (Baranne et al., 1996; Pepe et al., 2002).
We detected a sinusoidal variation in the CORALIE RVs that phases with the WASP ephemeris and which has a semi-amplitude consistent with a planetary mass companion (Fig. 1, third panel).
We timed the HARPS observations to coincide with a transit, aiming to measure the projected stellar obliquity via the Rossiter-McLaughlin (RM) effect (e.g. Albrecht et al. 2012).
Using an exposure time of 10 min, we took 32 spectra in high-accuracy mode (HAM) through the transit on the night of 2018 Mar 27 (Fig. 1, bottom panel). The sequence began after ingress as the telescope was previously occupied by technical intervention.
To more precisely measure the orbital eccentricity and the amplitude of the stellar reflex motion we included in our analysis the 16 HARPS RVs from Raynard et al. (2018): ten spectra were obtained in HAM (four with 20-min exposures and six with 40-min exposures) and six spectra were obtained in high-efficiency mode (EGGS) with 20-min exposures.
See Table 1 for a summary of the observations used in this paper. See Table 2 and Table 3 for the RVs and photometry, respectively.
| Facility | DateaaThe dates are ‘night beginning’. | NotesbbFor the photometry datasets, we state which filter was used. For the spectroscopy datasets, we indicate whether the data cover the orbit or the transit. | |
|---|---|---|---|
| Photometry | |||
| WASP-South | 2006 May–2014 Aug | 77 549 | 400–700 nm |
| TRAPPIST-South | 2015 Apr 23 | 538 | |
| TRAPPIST-South | 2018 Apr 14 | 1 366 | |
| TRAPPIST-South | 2018 Apr 23 | 400 | |
| Spectroscopy | |||
| Euler/CORALIE | 2015 Mar–2017 Apr | 23 | orbit |
| ESO3.6/HARPSccFrom Raynard et al. (2018). | 2017 Jul–2018 Mar | 16 | orbit |
| ESO3.6/HARPS | 2018 Mar 27 | 32 | transit |
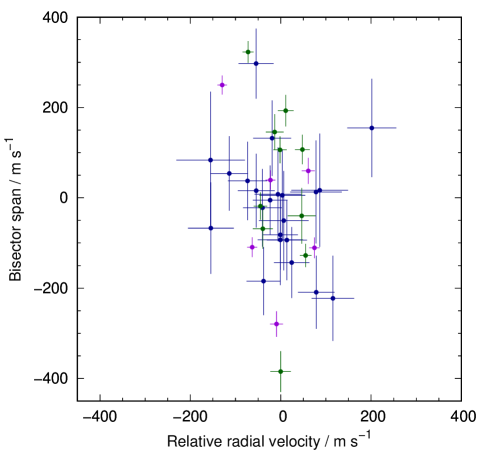
We checked for a corellation between RV and bisector span, which can indicate that an RV signal is the result of stellar activity (Queloz et al., 2001), or that an RV signal and a transit signal are both due to a blended eclipsing binary (Torres et al., 2004). There is no significant correlation (Fig. 2). Further, the detection of the RM effect and the nature of the trace in the Doppler tomogram (Section 4) conclusively prove that the photometric and spectroscopic signals are induced by a planet (Collier Cameron et al., 2010b; Jenkins et al., 2010).
| BJD(UTC) | Rel. flux, | Imager | Set | |
|---|---|---|---|---|
| 2450000 | ||||
| (day) | ||||
| 3860.389988 | 1.005491 | 0.005538 | WASP-South | 1 |
| 3860.390324 | 0.994179 | 0.005506 | WASP-South | 1 |
| … | ||||
| 7136.476710 | 0.995092 | 0.010803 | TRAPPIST-S | 2 |
| 7136.476940 | 0.990677 | 0.010697 | TRAPPIST-S | 2 |
| … |
The flux values are differential and normalised to the out-of-transit levels. The uncertainties are the formal errors (i.e. they have not been rescaled). This table is available in its entirety via the CDS.
| BJD(UTC) | RV | BS | Spectrograph | |
|---|---|---|---|---|
| 2450000 | ||||
| (day) | (km s-1) | (km s-1) | (km s-1) | |
| 7111.734763 | 26.3518 | 0.0508 | 0.0055 | CORALIE |
| 7175.700117 | 26.1538 | 0.0544 | 0.1546 | CORALIE |
| … | ||||
| 8205.671957 | 26.2426 | 0.0195 | 0.0268 | HARPS |
| 8205.679191 | 26.1815 | 0.0183 | 0.1014 | HARPS |
| … |
Uncertainties are the formal errors (i.e. with no added jitter). The uncertainty on bisector span (BS) is 2 . This table is available in its entirety via the CDS.
3 Stellar analysis
We co-added the individual HARPS spectra from the night of 2018 Mar 27 to obtain an average signal-to-noise of 150:1. We performed a spectral analysis using the procedures detailed in Doyle et al. (2013) to obtain stellar effective temperature, surface gravity, metallicity, and projected rotation speed. We calculated macroturbulence using a slight extrapolation of the calibration of Doyle et al. (2014) and we calculated microturbulence using the calibration of Bruntt et al. (2012). We do not detect lithium in the spectra. The results of the spectral analysis are given in Table 4.
We searched the WASP-South lightcurves for modulation, as may result from the combination of stellar rotation and magnetic activity, using the method of Maxted et al. (2011). We found no convincing signal, unsurprising for an F5V star, and place an upper limit of 1 mmag on the amplitude of any sinusoidal signal.
| Parameter | Symbol | Value | Unit |
|---|---|---|---|
| Constellation | … | Centaurus | … |
| Right Ascension (J2000) | … | … | |
| Declination (J2000) | … | … | |
| Tycho-2 | … | 10.8 | … |
| 2MASS | … | 9.8 | … |
| Spectral typeaa Spectral type estimated using the mkclass spectral classification code of Gray & Corbally (2014). | … | F5V | … |
| Stellar effective temperature | 6450 50 | K | |
| Stellar mass | 1.302 0.034 | ||
| Stellar radius (IRFM) | |||
| Stellar surface gravity | 4.1 0.1 | [cgs] | |
| Stellar metallicitybbIron abundance is relative to the solar value of Asplund et al. (2009). | [Fe/H] | … | |
| Stellar luminosity | (/) | 0.691 0.050 | … |
| Proj. stellar rotation speed | km s-1 | ||
| Macroturbulence | km s-1 | ||
| Microturbulence | km s-1 | ||
| Reddening | 0.068 | … | |
| Distance | d | pc | |
| Age | Gyr |
We calculated the distance to WASP-179 ( pc) using a parallax of mas, which is the Gaia DR2 parallax with the correction suggested by Stassun & Torres (2018) applied. We calculated the effective temperature ( K) and angular diameter ( mas) of the star using the infrared flux method (IRFM) of Blackwell & Shallis (1977), assuming reddening of from dust maps (Schlafly & Finkbeiner, 2011). We thus calculated its luminosity () and its radius ( ), which is consistent with the value of R18 ( ). If instead we use the non-corrected Gaia DR2 parallax ( mas) then we obtain: pc, , and .
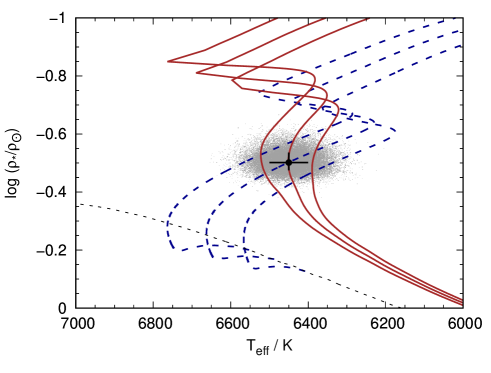
Though we can measure stellar density, , directly from the transit lightcurves, we require a constraint on stellar mass , or radius , for a full characterisation of the system. We inferred = 1.302 0.034 and age = 2.7 0.2 Gyr using the bagemass stellar evolution MCMC code of Maxted et al. (2015) with input of the values of from an initial MCMC analysis (see Section 4) and and [Fe/H] from the spectral analysis (Fig. 3). We conservatively inflated the error bar by a factor of 2 to place a Gaussian prior on (1.30 0.07 ) in our final MCMC analysis. We note that we derive a value of ( ) from our final MCMC that is consistent with the value that we obtained from the IRFM and Gaia parallax ( ), which we could have used to place a Gaussian prior on instead.
4 Stellar obliquity and system parameters from an MCMC analysis
We determined the system parameters from a simultaneous fit to the transit lightcurves and the radial velocities using the current version of the Markov-chain Monte Carlo (MCMC) code presented in Collier Cameron et al. (2007) and described further in Anderson et al. (2015). We modelled the RM effect using the formulation of Hirano et al. (2011).
When we fit for an eccentric orbit we obtained , with a 2- upper limit of . In the absence of evidence to the contrary we adopt a circular orbit, as advocated in Anderson et al. (2012). We accounted for stellar noise in the RV measurements by adding in quadrature with the formal RV uncertainties the level of ‘jitter’ required to achieve . The jitter values were: 32 m s-1 (CORALIE RVs), 18.4 m s-1 (HARPS HAM RVs of R18), 36.6 m s-1 (HARPS EGGS RVs of R18). No jitter was required for our HARPS RM RVs. To account for instrumental and astrophysical offsets, we partitioned the four RV datasets and fit a separate systemic velocity to each of them. When fit separately, our CORALIE RVs suggest a slightly larger stellar reflex velocity semi-amplitude ( m s-1) than do the HARPS RVs of R18 ( m s-1). When we analyse all of the RVs together we get m s-1. These values are consistent both with each other and with the value of R18 ( m s-1).
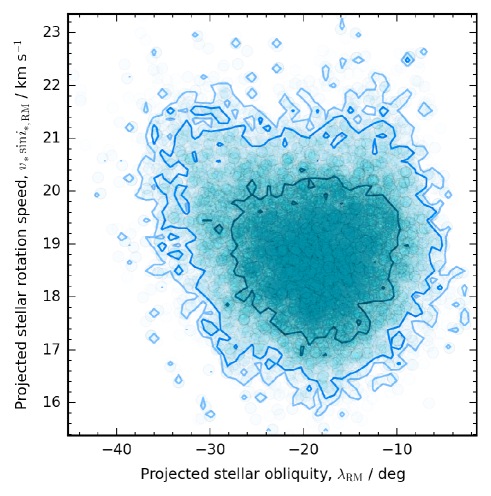
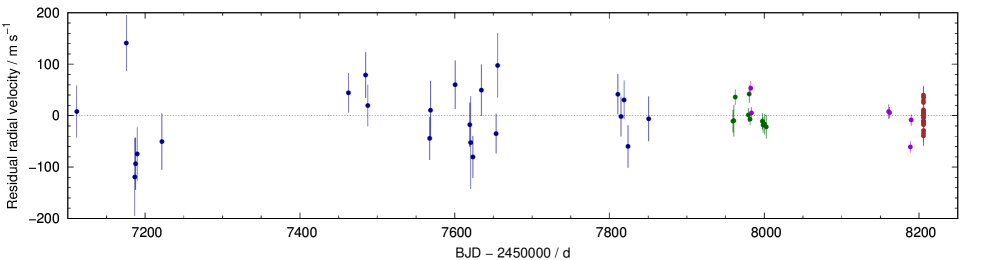
We present the median values and 1- limits on the system parameters from our final MCMC analysis in Table 5. We plot the best fits to the RVs and the transit lightcurves in Fig. 1. The posterior distributions of the projected stellar rotation speed and the projected stellar obliquity indicate no degeneracy (Fig. 4), which is a result of the impact parameter being significantly non-zero (). We see no evidence in the RV residuals for an additional body in the system (Fig. 5). When we fit for a linear trend in RV, we obtained m s-1 yr-1.111We excluded the RVs from the transit night, except for the final two RVs, which we fit together with the 10 HARPS HAM RVs of R18.
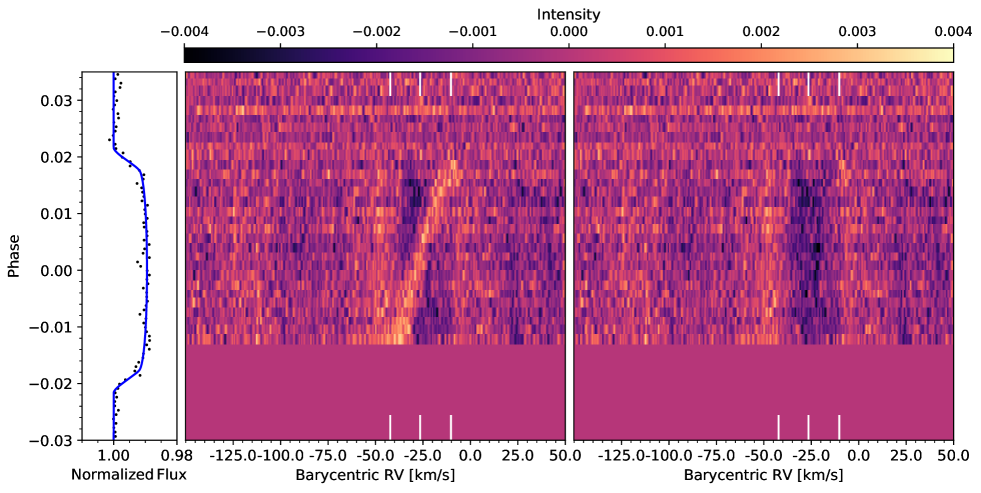
We performed an additional fit in which we measured the stellar obliquity using line-profile tomography instead of the RM effect (so we omitted the HARPS RVs taken on the transit night of 2018 Mar 27). We modelled the average stellar line profiles (cross-correlation functions, or CCFs) and the planet’s Doppler shadow using the method presented in Collier Cameron et al. (2010a) and used again in Collier Cameron et al. (2010b), Brown et al. (2012, 2017), and Temple et al. (2017, 2018). We plot the tomogram (i.e. the residual map of the CCF time-series) both before and after removal of the planet model in Fig. 6. The fitted parameters were the projected stellar rotation speed , the projected stellar obliquity , the impact parameter , the FWHM of the line-profile perturbation due to the planet , and the centre-of-mass velocity . We give the values of those parameters in Table 5. We omit the values of the other parameters as, depending mostly on the transit lightcurves and radial-velocity data, they are fully consistent between the two analyses.
| Parameter | Symbol | Value | Unit |
|---|---|---|---|
| MCMC Gaussian priors | |||
| Stellar mass | 1.30 0.07 | ||
| Stellar effective temperature | 6450 50 | K | |
| MCMC parameters controlled by Gaussian priors | |||
| Stellar mass | 1.303 0.072 | ||
| Stellar effective temperature | 6453 49 | K | |
| MCMC fitted parameters | |||
| Orbital period | 4.5111204 0.0000018 | d | |
| Transit epoch (HJD) | 2457501.99114 0.00050 | d | |
| Transit duration | 0.1944 0.0016 | d | |
| Planet-to-star area ratio | /R | 0.00952 0.00017 | … |
| Impact parameteraaImpact parameter is the distance between the centre of the stellar disc and the transit chord: . | 0.317 0.089 | … | |
| Reflex velocity semi-amplitude | 69.1 8.9 | m s-1 | |
| Systemic velocity (CORALIE) | 26 355 12 | m s-1 | |
| Systemic velocity (HARPS,RM) | 26 360.9 3.5 | m s-1 | |
| Systemic velocity (HARPS,HAM) | 26 361.7 8.1 | m s-1 | |
| Systemic velocity (HARPS,EGGS) | 26 402 15 | m s-1 | |
| Orbital eccentricity | 0 (assumed; 0.14 at 2) | … | |
| MCMC derived parameters | |||
| Sky-projected stellar obliquity | 19.0 6.1 | ∘ | |
| Sky-projected stellar rotation speed | 18.9 1.1 | km s-1 | |
| Scaled semi-major axis | … | ||
| Orbital inclination | 87.66 0.73 | ∘ | |
| Ingress and egress duration | 0.0190 0.0013 | d | |
| Stellar radius | 1.619 0.058 | ||
| Stellar surface gravity | 4.135 0.028 | [cgs] | |
| Stellar density | 0.309 0.028 | ||
| Planetary mass | 0.670 0.089 | ||
| Planetary radius | 1.536 0.062 | ||
| Planetary surface gravity | 2.810 0.068 | [cgs] | |
| Planetary density | 0.183 0.033 | ||
| Orbital semi-major axis | 0.0584 0.0011 | AU | |
| Planetary equilibrium temperaturebbEquilibrium temperature calculated assuming zero albedo and efficient redistribution of heat from the planet’s presumed permanent day-side to its night-side. | 1638 29 | K | |
| Parameters from a separate MCMC including Doppler tomography | |||
| Sky-projected stellar obliquity | 11.3 4.8 | ∘ | |
| Sky-projected stellar rotation speed | 15.91 0.49 | km s-1 | |
| Intrinsic linewidth | 8.98 0.32 | km s-1 | |
| Impact parameter | 0.206 0.080 | … | |
| Systemic velocity | m s-1 | ||
5 Discussion
We have reported the characterisation of WASP-179b (NGTS-2b), a hot Jupiter ( = 0.67 0.09 , = 1.54 0.06 ) in a 4.51-d orbit around a , F5V star. As a low-density planet orbiting a relatively bright star, WASP-179b is a good target for atmospheric characterisation via transmission spectroscopy (e.g. Spake et al. 2018). We predict an atmospheric scale height of 1050 km and a transmission signal similar in amplitude to that of WASP-139b (Hellier et al., 2017) and one tenth that of WASP-107b (see table 4 of Anderson et al. 2017), which are both bloated super-Neptunes.
From an observation of the RM effect, we find the planet to be in a prograde orbit, with a slight misalignment between the planet’s orbital axis and the star’s spin axis (). We find this to be corroborated by our tomographic analysis of the same transit spectra (). The near-alignment of the system and the near-circular orbit (; at 2) are compatible with WASP-179b having arrived in its current orbit via disc migration (see, e.g. Dawson & Johnson 2018). High-eccentricity migration (e.g. Petrovich 2015) is not ruled out, however, as we calculate a circularisation timescale of just 20 Myr (e.g. Jackson et al. 2008; assuming ). We obtain a larger estimate of the stellar rotation speed from fitting the RM effect with the Hirano model than we do from both our tomographic and spectral analyses ( = km s-1, = km s-1, = km s-1), as was observed previously for other systems by Brown et al. (2017).
The system parameters reported by R18 differ somewhat to those presented herein. Most notably, their stellar mass ( = ) is a little higher than ours ( = ). Thus we find a smaller planetary mass than do R18: = 0.67 0.09 compared to = 0.74 0.13 (the difference is smaller than suggested by as we measured a larger stellar reflex velocity amplitude). Whilst we both measured from our respective transit lightcurves, we derived from and (obtained from stellar models), whereas R18 derived from and (obtained from SED fitting and the Gaia parallax). Our values of ( ) and (1.62 0.06 ) are in good agreement both with the values obtained by R18 from stellar models ( = 1.32 0.09 and = 1.58 0.22 ) and the values we obtain from the empirical calibrations of Southworth (2011): = 1.34 and = 1.63 . Further, our value of is consistent with the F5V spectral type that we obtained using the mkclass spectral classification code of Gray & Corbally (2014). We note that the discrepancy is not large: the two values agree at the 1.5- level. This small discrepancy is somewhat due to the difference in stellar density measured from the transit lightcurves (we found = 0.31 0.03 and R18 found = 0.33 0.05 ), but it is more so due to R18’s larger stellar radius. R18 obtained = from SED fitting and the Gaia parallax, whereas we obtained = using a similar method, and we derived = from our and values. Thus we find a smaller planetary radius than do R18: = 1.54 0.06 compared to = 1.60 0.05 (the difference is slightly smaller than suggested by as we measured a slightly larger planet-to-star area ratio).
Due to the 12-yr baseline (2006-2018) of our transit observations, our ephemeris is considerably more precise than that of R18 (8-month baseline). Our error bars on the orbital period and on the time of mid-transit are smaller than those of R18 by factors of 34 and 3, respectively.
References
- Albrecht et al. (2012) Albrecht, S., Winn, J. N., Johnson, J. A., et al. 2012, ApJ, 757, 18, doi: 10.1088/0004-637X/757/1/18
- Anderson et al. (2012) Anderson, D. R., Collier Cameron, A., Gillon, M., et al. 2012, MNRAS, 422, 1988, doi: 10.1111/j.1365-2966.2012.20635.x
- Anderson et al. (2015) Anderson, D. R., Collier Cameron, A., Hellier, C., et al. 2015, A&A, 575, A61, doi: 10.1051/0004-6361/201423591
- Anderson et al. (2017) Anderson, D. R., Collier Cameron, A., Delrez, L., et al. 2017, A&A, 604, A110, doi: 10.1051/0004-6361/201730439
- Asplund et al. (2009) Asplund, M., Grevesse, N., Sauval, A. J., & Scott, P. 2009, ARA&A, 47, 481, doi: 10.1146/annurev.astro.46.060407.145222
- Baranne et al. (1996) Baranne, A., Queloz, D., Mayor, M., et al. 1996, A&AS, 119, 373
- Blackwell & Shallis (1977) Blackwell, D. E., & Shallis, M. J. 1977, MNRAS, 180, 177
- Brown et al. (2012) Brown, D. J. A., Collier Cameron, A., Díaz, R. F., et al. 2012, ApJ, 760, 139, doi: 10.1088/0004-637X/760/2/139
- Brown et al. (2017) Brown, D. J. A., Triaud, A. H. M. J., Doyle, A. P., et al. 2017, MNRAS, 464, 810, doi: 10.1093/mnras/stw2316
- Bruntt et al. (2012) Bruntt, H., Basu, S., Smalley, B., et al. 2012, MNRAS, 423, 122, doi: 10.1111/j.1365-2966.2012.20686.x
- Collier Cameron et al. (2010a) Collier Cameron, A., Bruce, V. A., Miller, G. R. M., Triaud, A. H. M. J., & Queloz, D. 2010a, MNRAS, 403, 151, doi: 10.1111/j.1365-2966.2009.16131.x
- Collier Cameron et al. (2006) Collier Cameron, A., Pollacco, D., Street, R. A., et al. 2006, MNRAS, 373, 799, doi: 10.1111/j.1365-2966.2006.11074.x
- Collier Cameron et al. (2007) Collier Cameron, A., Wilson, D. M., West, R. G., et al. 2007, MNRAS, 380, 1230, doi: 10.1111/j.1365-2966.2007.12195.x
- Collier Cameron et al. (2010b) Collier Cameron, A., Guenther, E., Smalley, B., et al. 2010b, MNRAS, 407, 507, doi: 10.1111/j.1365-2966.2010.16922.x
- Dawson & Johnson (2018) Dawson, R. I., & Johnson, J. A. 2018, ArXiv e-prints. https://arxiv.org/abs/1801.06117
- Doyle et al. (2014) Doyle, A. P., Davies, G. R., Smalley, B., Chaplin, W. J., & Elsworth, Y. 2014, MNRAS, 444, 3592, doi: 10.1093/mnras/stu1692
- Doyle et al. (2013) Doyle, A. P., Smalley, B., Maxted, P. F. L., et al. 2013, MNRAS, 428, 3164, doi: 10.1093/mnras/sts267
- Evans et al. (2016) Evans, D. F., Southworth, J., & Smalley, B. 2016, ApJ, 833, L19, doi: 10.3847/2041-8213/833/2/L19
- Gaia Collaboration et al. (2018) Gaia Collaboration, Brown, A. G. A., Vallenari, A., et al. 2018, A&A, 616, A1, doi: 10.1051/0004-6361/201833051
- Gillon et al. (2011) Gillon, M., Jehin, E., Magain, P., et al. 2011, Detection and Dynamics of Transiting Exoplanets, St. Michel l’Observatoire, France, Edited by F. Bouchy; R. Díaz; C. Moutou; EPJ Web of Conferences, Volume 11, id.06002, 11, 6002, doi: 10.1051/epjconf/20101106002
- Gray & Corbally (2014) Gray, R. O., & Corbally, C. J. 2014, AJ, 147, 80, doi: 10.1088/0004-6256/147/4/80
- Günther et al. (2018) Günther, M. N., Queloz, D., Gillen, E., et al. 2018, MNRAS, 478, 4720, doi: 10.1093/mnras/sty1193
- Hellier et al. (2017) Hellier, C., Anderson, D. R., Cameron, A. C., et al. 2017, MNRAS, 465, 3693, doi: 10.1093/mnras/stw3005
- Hirano et al. (2011) Hirano, T., Suto, Y., Winn, J. N., et al. 2011, ApJ, 742, 69, doi: 10.1088/0004-637X/742/2/69
- Jackson et al. (2008) Jackson, B., Greenberg, R., & Barnes, R. 2008, ApJ, 678, 1396, doi: 10.1086/529187
- Jehin et al. (2011) Jehin, E., Gillon, M., Queloz, D., et al. 2011, The Messenger, 145, 2
- Jenkins et al. (2010) Jenkins, J. M., Borucki, W. J., Koch, D. G., et al. 2010, ApJ, 724, 1108, doi: 10.1088/0004-637X/724/2/1108
- Kreidberg et al. (2018) Kreidberg, L., Line, M. R., Thorngren, D., Morley, C. V., & Stevenson, K. B. 2018, ApJ, 858, L6, doi: 10.3847/2041-8213/aabfce
- Labadie-Bartz et al. (2018) Labadie-Bartz, J., Rodriguez, J. E., Stassun, K. G., et al. 2018, ArXiv e-prints. https://arxiv.org/abs/1803.07559
- Maxted et al. (2015) Maxted, P. F. L., Serenelli, A. M., & Southworth, J. 2015, A&A, 575, A36, doi: 10.1051/0004-6361/201425331
- Maxted et al. (2011) Maxted, P. F. L., Anderson, D. R., Collier Cameron, A., et al. 2011, PASP, 123, 547, doi: 10.1086/660007
- Pepe et al. (2002) Pepe, F., Mayor, M., Rupprecht, G., et al. 2002, The Messenger, 110, 9
- Petrovich (2015) Petrovich, C. 2015, ApJ, 805, 75, doi: 10.1088/0004-637X/805/1/75
- Pollacco et al. (2006) Pollacco, D. L., Skillen, I., Cameron, A. C., et al. 2006, PASP, 118, 1407, doi: 10.1086/508556
- Queloz et al. (2000) Queloz, D., Mayor, M., Weber, L., et al. 2000, A&A, 354, 99
- Queloz et al. (2001) Queloz, D., Henry, G. W., Sivan, J. P., et al. 2001, A&A, 379, 279, doi: 10.1051/0004-6361:20011308
- Raynard et al. (2018) Raynard, L., Goad, M. R., Gillen, E., et al. 2018, ArXiv e-prints. https://arxiv.org/abs/1805.10449
- Schlafly & Finkbeiner (2011) Schlafly, E. F., & Finkbeiner, D. P. 2011, ApJ, 737, 103, doi: 10.1088/0004-637X/737/2/103
- Southworth (2011) Southworth, J. 2011, MNRAS, 417, 2166, doi: 10.1111/j.1365-2966.2011.19399.x
- Spake et al. (2018) Spake, J. J., Sing, D. K., Evans, T. M., et al. 2018, Nature, 557, 68, doi: 10.1038/s41586-018-0067-5
- Stassun & Torres (2018) Stassun, K. G., & Torres, G. 2018, ApJ, 862, 61, doi: 10.3847/1538-4357/aacafc
- Temple et al. (2017) Temple, L. Y., Hellier, C., Albrow, M. D., et al. 2017, MNRAS, 471, 2743, doi: 10.1093/mnras/stx1729
- Temple et al. (2018) Temple, L. Y., Hellier, C., Almleaky, Y., et al. 2018, MNRAS, 480, 5307, doi: 10.1093/mnras/sty2197
- Torres et al. (2004) Torres, G., Konacki, M., Sasselov, D. D., & Jha, S. 2004, ApJ, 614, 979, doi: 10.1086/423734
- Wheatley et al. (2018) Wheatley, P. J., West, R. G., Goad, M. R., et al. 2018, MNRAS, 475, 4476, doi: 10.1093/mnras/stx2836
- Wyttenbach et al. (2017) Wyttenbach, A., Lovis, C., Ehrenreich, D., et al. 2017, A&A, 602, A36, doi: 10.1051/0004-6361/201630063