Automatic Parallelization of Sequential Programs
Peter Kraft, Amos Waterland, Daniel Y Fu
Anitha Gollamudi, Shai Szulanski, Margo Seltzer
Harvard John A. Paulson School of Engineering and Applied Sciences
Abstract
Prior work on Automatically Scalable Computation (ASC) suggests that it is possible to parallelize sequential computation by building a model of whole-program execution, using that model to predict future computations, and then speculatively executing those future computations. Although that prior work demonstrated scaling, it did not demonstrate speedup, because it ran entirely in emulation. We took this as a challenge to construct a hardware prototype that embodies the ideas of ASC, but works on a broader range of programs and runs natively on hardware. The resulting system is similar in spirit to the original work, but differs in practically every respect.
We present an implementation of the ASC architecture that runs natively on x86 hardware and achieves near-linear speedup up to 44-cores (the size of our test platform) for several classes of programs, such as computational kernels, map-style programs, and matrix operations. We observe that programs are either completely predictable, achieving near-perfect predictive accuracy, or totally unpredictable, and therefore not amenable to scaling via ASC-like techniques. We also find that in most cases, speedup is limited only by implementation details: the overhead of our dependency tracking infrastructure and the manipulation of large state spaces. We are able to automatically parallelize programs with linked data structures that are not amenable to other forms of automatic parallelization.
1 Introduction
Since the introduction of the first machine with multiple processing units, automatic parallelization has been the holy grail of scalability. With the end of Dennard scaling [8], enabling software to take advantage of multiple cores has become even more urgent. We adopt the Automatically Scalable Computation (ASC) architecture, which transforms the problem of automatic parallelization to one of prediction and speculation [29]. The original ASC implementation ran on a software emulation of x86; thus, although it demonstrated promising scaling capabilities, it failed to achieve true speedup relative to native hardware execution. Its gains were therefore ultimately theoretical; the paper did not show that ASC could work outside of simulation. We present a prototype of ASC, NewAge, that runs on native hardware. While NewAge draws inspiration from the original work, its implementation is completely different. NewAge addresses the major technical challenges left open in the prior work; addressing these challenges enables true speedup and execution orders of magnitude faster than that of the original ASC implementation. NewAge demonstrates the viability of the ASC approach, showing that it can be used to achieve automatic parallelism and true speedup on native hardware. For the remainder of this paper, we use ASC to refer to the general architecture and NewAge to refer to our current implementation of that architecture.
ASC achieves automatic parallelism by treating computation as a dynamical system. The memory and registers of a program form a (very) large state vector, and the instruction set architecture acts as a transition rule that moves the computation from one state to another. In this model, program execution carves out a path or trajectory through the state space. ASC’s parallelization strategy is to predict points that fall on that execution trajectory and dispatch speculative executions from those predicted points to available cores. If the actual computation reaches a predicted state, it can then fast-forward to the point at which the speculative execution completed. Crucially, these fast-forwards happen only if the predictions are correct, so there is no risk of bad execution. Thus, ASC can speed up program execution by using available cores to perform some computation early and caching the results until they are useful.
Designing an implementation of ASC requires addressing three fundamental questions: 1) How do we determine points in a program amenable to prediction and therefore candidates at which to begin speculative execution? 2) What technique(s) should we use to build models of the evolution of computational states? 3) How do we store these speculative executions so that we can look them up efficiently? We discuss the solutions to all these problems in more detail in Section 3 but summarize them here.
We address the first problem by running the target program under a subsystem called the recognizer that ranks a set of candidate instruction pointer (IP) locations (§ 3.1). After running the recognizer, NewAge uses ptrace and the perf_event API to set breakpoints in the target process. When NewAge regains control at these breakpoints, it captures the process state for model building and prediction.
We address the second by building two learners for model-building: a neural network [16] that can be trained online (i.e., we can both build models and make predictions during the same execution) and an offline-trained collection of decision trees (these are trained over a few executions before being used to make predictions). Both attain high accuracy, and each has its advantages and disadvantages (§ 3.2).
The third problem is perhaps the trickiest aspect of ASC and deserves further elaboration. Abstractly, the computational cache is a lookup table from state vectors to state vectors; given a predicted state, we wish to look up the result of the speculative computation that started in that state. A naive cache implementation uses the entire predicted state vector as its key and stores the entire speculated state vector as the value corresponding to that key. This is problematic because these vectors are extraordinarily large. We can simplify the problem by recognizing that a cache lookup need not match on all the bits in the state. It needs to match only on the bits on which the computation actually depend. There is no need to predict or match on bits that do not change or are never read. We use dynamic instrumentation (using Pin [18]) to identify precisely the set of bits on which a speculative computation depends. We then use this information to construct cache entries that match any state that includes correct predictions for this (relatively small) number of bits (§ 3.3).
A second challenge in cache design is construction of a unique key to efficiently identify candidate cache entries. The original ASC prototype provided no true key mechanism, searching the cache iteratively on every lookup. We discovered that the contents of the live registers111A register is live at an instruction pointer (IP) if the value of the register at the IP is used before it is overwritten. A register is not live at an IP if its value is always overwritten before the register is used. provide a sufficiently unique fingerprint for a program’s state that we can use it as a cache key. This allows us to hash the live register contents to produce a key that with high probability uniquely identifies a cache entry (followed by a full comparison in the case of a match). The combination of dependency analysis and register fingerprinting enables us to produce an implementation of the ASC architecture that runs natively on x86/Linux platforms and achieves speedup linear in the number of cores on several classes of programs.
Overall, the major contribution of this work is the NewAge implementation of the ASC architecture that produces near-linear speedup on real hardware. We also provide an empirical evaluation of NewAge, demonstrating which aspects of the system dictate overall speedup, what programs are amenable to ASCing, and how this class of programs differs from those that can be parallelized via compiler-only approaches. NewAge is the first implementation of ASC that can run natively and produce real speedup. The original ASC could only function in an extremely slow and limited simulation and could only achieve speedup relative to programs run in that simulation.
2 Background
To provide context for the discussion of our implementation in the next section, we briefly review the ASC architecture and terminology.
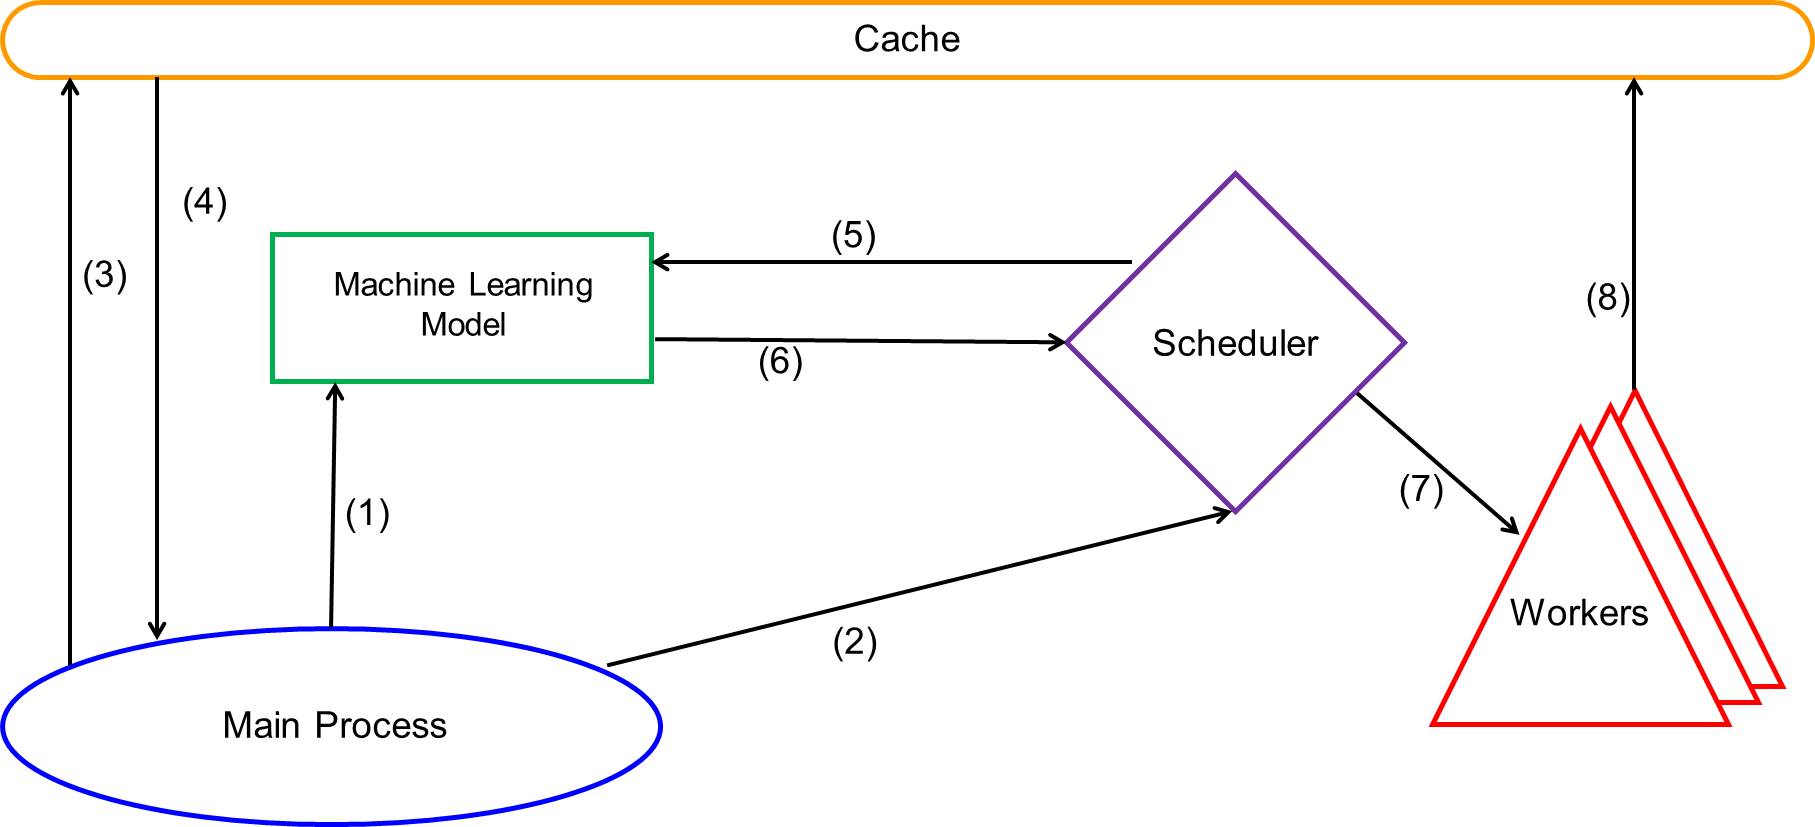
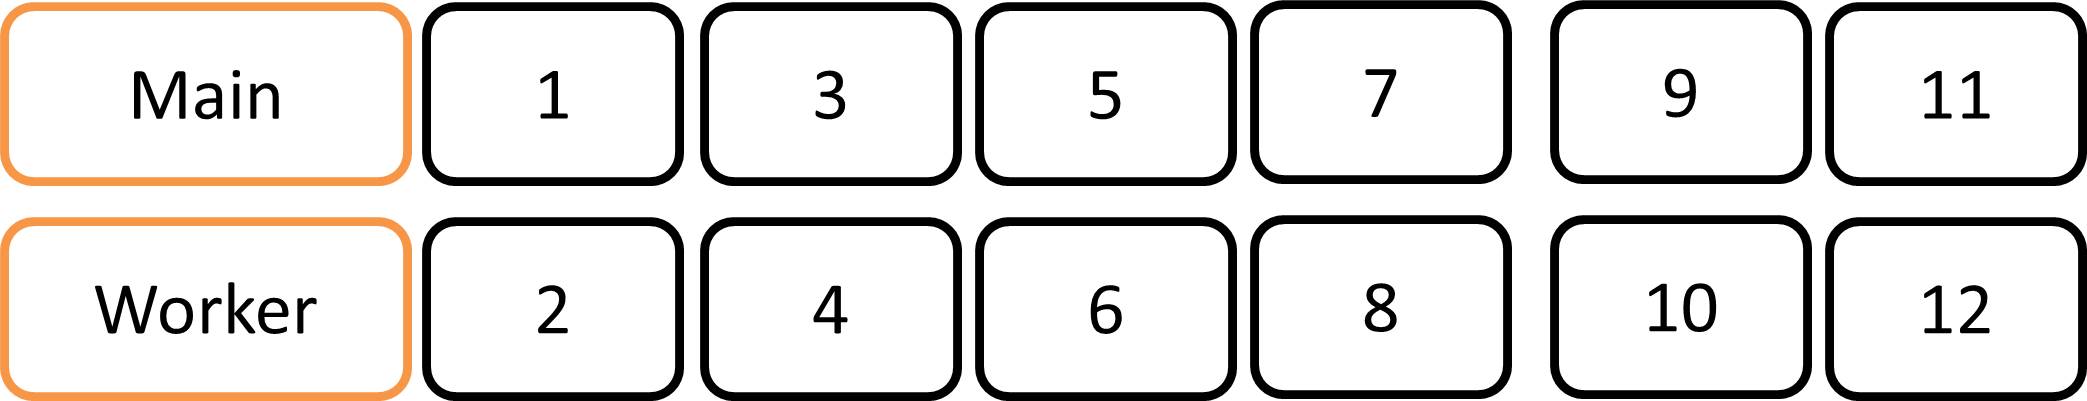
We call the program we wish to speed up the main process. Speculations execute in worker processes. The ASC scheduler is responsible for requesting predictions from the machine learning models and scheduling speculations from those predictions. We call the states that the models predict the predicted states. When the scheduler gives the workers a prediction, the workers execute a minimum number of instructions (calculated to produce speculations long enough to amortize system overhead) and then complete their speculation at a designated value of the instruction pointer. The state at which the worker stops execution is called the speculated state. Workers place the pair of predicted and speculated states into the cache as a single cache entry. Figure 1 (drawn heavily from Waterland et al. [29]) shows the overall ASC architecture and execution paths.
So far, we have assumed that ASC knows the location in the main process for which it should build models and speculate. The process of identifying this location is called recognition and the location at which we build models is called the recognized instruction pointer or RIP. For the rest of the discussion in this section, assume that the ASC user specifies the RIP; in Section 3 we will discuss the subsystem that locates the RIP.
We next describe the components of NewAge in more detail.
2.1 Machine Learning Model
The job of the machine learning model is to make predictions about future states of the main process. The model takes as input the current state of the main process – its register and memory contents – and returns as output a prediction of the state the main process will be in the next time it reaches the breakpoint. To be specific, it predicts which bits will have changed their values the next time the main process reaches the breakpoint. At first blush this seems impossible – the process state is potentially billions of bits. However, two things make the problem tractable. First, many bits in the process state never change, e.g., code. Second, a worker’s computation depends only upon those bits actually read during its execution. We can reduce the predicted state further by observing that any locations written before being read by the worker (i.e., scratch space) also need not be predicted. If we can accurately identify the bits on which a computation depends, we can significantly reduce the scope of the prediction problem. We show the magnitude of this reduction in Section 4 and describe how we use Pin to accomplish this in Section 3.
2.2 The Cache
The cache is indexed by a predicted state and returns a speculated state. However, as we just discussed, we wish to minimize the size the predicted state, by including only those parts on which the computation depends. If each cache entry depends on different bits, how can we efficiently conduct lookups? We observe that the contents of the live registers provide a relatively unique fingerprint of a process’ state and use that to index our cache. We discuss this in more detail in Section 3.
2.3 The Scheduler
The scheduler determines from which (predicted) state each worker should execute. Its job is to balance the desire to use all available cores with the possibility of wasting work. It must also ensure that workers complete their speculations and enter them into the cache before the main process encounters their predicted states. If workers have not completed their speculation yet, there will be no cache entry when the main process enters the predicted state and speculation will be wasted.
Finally, the scheduler must also decide how to predict states far in the future. There are (at least) two ways to do this. One way is to predict the next state, , feed that prediction back into the learning model and then predict state , etc. The other way is to ask the machine learners to build multiple models: one that predicts every state at the RIP, one that predicts every second state, one that predicts every third state, etc. Although we have shown that the latter approach is promising, the results in Section 4 all use the former approach.
3 Implementation
Our ASC implementation, NewAge, is a monitor process that creates the main process using fork and exec and all workers (typically one for each available core) using Pin. NewAge uses ptrace and the perf_event API on the main process and Pin instrumentation on the workers to set breakpoints at the RIP. At this point, the main process begins running.
Every time the main process reaches the breakpoint, NewAge looks up the current state in the cache, fast-forwarding on a hit. NewAge also presents the current state to the machine learning model as input and obtains a prediction for a future instance of the RIP. If there are workers available, NewAge will then dispatch a worker to speculate from the newly predicted state. If NewAge constructs multiple models, it can dispatch multiple workers, one at each predicted state. This cycle repeats until the main process completes execution.
In the following sections, we discuss the major components of NewAge.
3.1 The Recognizer
We currently perform recognition by running the target program twice - once to identify the RIP, once to identify the period, the number of times we should skip over the RIP before breaking to create an execution sufficiently long that it amortizes our fixed overheads. We can then begin building models and/or speculating on subsequent runs of the program. On one hand, running the program beforehand feels a bit like cheating; on the other hand, consider a scenario where we run an expensive computational kernel on a variety of inputs – we pay two sequential runs as overhead to locate optimal breakpoint settings and then speed up all subsequent runs.
NewAge finds the RIP using Pin and a custom Pintool (a shared library called by Pin) that measures the frequency of various candidate instructions, such as jumps and branches (which frequently indicate loops). We then select the recurring candidate with the lowest frequency above some threshold. Subsequent runs of the target program instrument only this breakpoint to collect timing information, selecting a breakpoint period that balances NewAge overhead with the cost of execution between two instances of the RIP. We developed these heuristics after manually optimizing breakpoints for our test kernels. NewAge regularly finds the RIP in the same basic block that we identified manually.
An earlier implementation of the recognizer applied the technique described by Swersky et al. [26]. We extracted candidate breakpoints from the binary and trained full instances of ASC incrementally on each breakpoint with various settings of the parameters, such as minimum instruction count (the minimum number of instructions we require between breaks). We then used a Gaussian process regressor to predict the speedup possible with additional training; the more promising a setting looked, the longer we trained. While this implementation successfully identified good breakpoints, it was expensive to gather training sets for each candidate.
3.2 Machine Learning Model
We have developed two different learners for NewAge. Both take as input the full state of a program and predict as output the values of the bits on which computation depends (identified using Pin) after one timestep, as explained in Section 2.1.
The first learner uses a fully-connected 3-layer neural net. The major advantage of using neural networks is that they can be trained online, so we can build the model at the same time that we parallelize (and speed up) the program. However, they have several disadvantages. First, they are opaque; we cannot reason about what causes the networks to produce their output. Second, they are inflexible in the size of their inputs and outputs. As we do not know all the bits on which a computation depends a priori, each time we learn that we want a new bit in the input or output, we have to build a new model. Third, the time complexity of prediction and training scale quadratically with the number of bits predicted, because the network is fully connected. This makes the network too slow to produce speedup for large numbers of bits, although we can produce speedup for small numbers of bits.
To mitigate these issues, we turn to decision trees trained via the Classification and Regression Tree (CART) algorithm. These have the downside of needing offline training, where a set of training examples is gathered from different runs of a program on random inputs and the trees are batch-trained from it. However, they map well to this domain, because the training set consists entirely of binary values (bits) with no noise. This avoids the two largest disadvantages of decision trees: their difficulty in splitting many-valued input and their tendency to overfit to noise. Furthermore, they offer several advantages. First, we can train a separate tree for each output bit, avoiding the problem of rebuilding models when we discover new bits. Second, the time complexity of prediction and training increases linearly, not quadratically, with the number of bits predicted (as our decision trees have a set maximum depth and therefore effectively constant size). Third, trees are transparent, allowing us to reason about a tree’s behavior simply by examining it.
3.3 Cache
The cache must map predicted states to speculated states and provide efficient lookup. NewAge has a single shared cache used by the main process and all workers and protected by locks, unlike the original ASC where each core maintained its own cache requiring every cache query to produce parallel cache lookups on all cores. A naive cache simply maps predicted states, to speculated states . However, we can expand the set of programs on which NewAge can achieve speedup if we reduce the number of bits it must predict correctly. Thus, we wish to augment our cache with masks that identify every bit on which a speculative execution depends (the read-mask) and every bit written by the execution (the write-mask). These masks play the same role as those introduced by Waterland et al [29]; we review their use here for completeness.
Our cache implements two functions, cache_add and cache_lookup. Function cache_add simply takes the four-tuple , where and are the read- and write- masks respectively, and adds it to the cache. Function cache_lookup takes the main process state, , and checks if any cache entry contains a predicted state identical to in all bits read during the computation of ; that is, if: . If an entry matches, the cache returns both and , else it returns NULL.
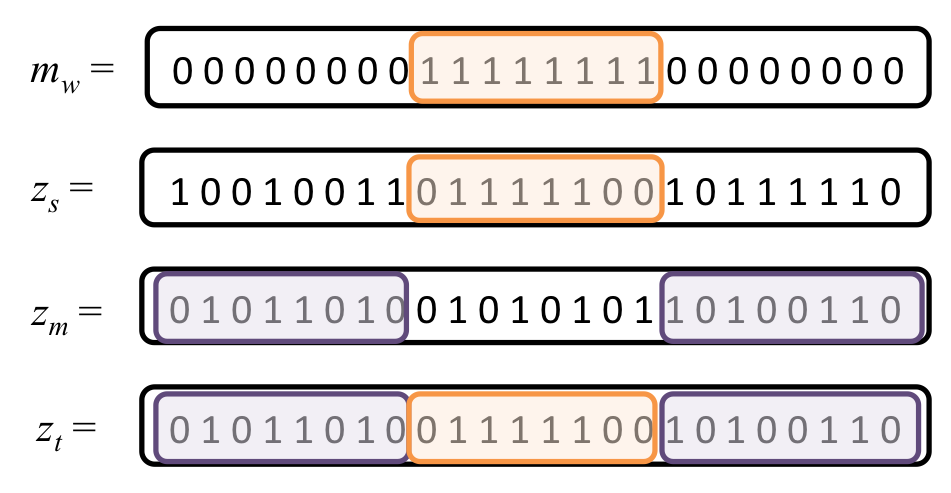
On a cache hit, we must construct the state, that results from fast-forwarding using the cache entry. Logically, we want to take the bits in under the mask and insert them into to produce . Algebraically, we want: , where denotes the bitwise XOR. The first clause produces the bits written during the speculation, and the second clause produces a version of the current state with every bit under the write-mask set to 0. Figure 2 illustrates this lookup process.
We implement the cache as a hash table. However, doing so requires a fast hash function that does not depend on , since every entry in the cache could conceivably have a different . After much experimentation, we have discovered that the values of the live registers are sufficiently unique to act as a fingerprint for a process’s state at a RIP. While the set of memory values that are read from might change between iterations of a program, the set of registers that are live at the breakpoint never changes. It is part of every . Moreover, the values of the registers do a good job of discriminating states: for all programs we tested, if the states of the live registers were identical, the states of the areas of memory under the read-mask were also identical. Given the centrality of registers to all computations, this is likely true in general for non-adversarial programs. This has allowed us to implement the cache as a hash table where the “hash” of each tuple is a simple hash function over the values of the live registers of . When we lookup a main process state , we simply hash its live registers and look up the hash in the table. This is equivalent to asking if there is an entry where the register values of and are identical. We do not rely on this approximate hash, however. If we do find such an entry we verify that , which is equivalent to making sure that the full state vectors and are identical under the read-mask. If the equality is true, we have a hit. That last equality check makes this scheme resilient to any possibility of hash collisions (where the live register set is the same, but memory values differ). They may lead to the loss of a cache entry and some wasted computation, but never to invalid outputs or aberrant behavior.
The astute reader may recognize that it is sometimes necessary to perform multiple sequential cache lookups. This occurs when the final modified state retrieved from the cache matches some other cache entry. Depending on the scheduler, this can happen many times in succession. Originally, we solved this problem by having cache_lookup iterate. If it found a speculated state, instead of returning it would look up that speculated state as a predicted state and repeat until it had reached a speculated state that had no match in the cache. However, this solution becomes extremely expensive when state vectors became large, since it requires synchronous performance of a large number of whole-state-vector Boolean operations in the main process. We remove this iterated lookup by having asynchronous threads optimize the cache. We search for pairs of entries and such that ; that is, pairs of entries where the speculated state of the first matches the predicted state of the second under the read-mask of the second. If we find such a pair, we combine it into a single entry where is the state constructed from and using the procedure described above and combining the read- and write- masks. We call this optimization cache stitching.
Live Register Analysis
During the execution of the program, we must know the set of registers that are live at a program point in order to predict the future state. However, clang erases register liveness information right after the register allocation pass. We have therefore modified the clang toolchain to compute the liveness information after the physical registers allocation pass but before the emittance of assembly instructions. We use the standard backward propagation technique to compute the live range of registers. Since our kernels are non-adversarial, we assume that the instructions in the linked binary are in one-to-one correspondence with the instructions emitted during the assembly phase, enforcing that assumption by detecting instruction padding for alignment and disabling link time optimizations for kernels.
3.4 Scheduler
The goal of the scheduler is to assign different predictions to different workers so that every worker is usefully speculating about the future of the main process. We define a timestep, as the instance that NewAge stops the main thread at the RIP. The first time NewAge stops the main thread at RIP is , the second is , and so on. We use timesteps to simplify the scheduler by recognizing that the predictions created by our machine learning model are not only general predictions for the future but also predictions for a specific timestep. The scheduler maintains a large table with an entry for each timestep (modulo a large number). If a worker has completed speculation or is currently speculating a particular timestep, it marks the appropriate entry in the table. Every time a worker process is ready for scheduling, the scheduler assigns it to the unmarked entry in the table, where is a small number chosen to ensure the speculation completes before the main thread reaches the timestep. Assuming the main process was last observed in timestep and the chosen entry is for timestep , the scheduler then has the machine learning model iteratively predict from the main process state times to create a prediction for timestep . Next, the scheduler constructs the predicted state and dispatches the worker to speculate from it. This ensures that no two workers ever work on the same prediction and that every speculation from a predicted state at some timestep finishes before the main process reaches timestep .
3.5 Pintool
Our system launches all workers using Pin and a custom Pintool (a shared library called by Pin). The Pintool contains only a single data structure, a large segment of memory that is shared with NewAge, Pin’s parent. This segment is large enough to contain copies of the registers, active areas of the program’s memory, and a read-mask and write-mask each the same size as those active areas. We determine the active areas of memory and their size by parsing the main process’s memory map in /proc/pid/maps. The Pintool also acts as a library that contains several instrumentation functions. Specifically, we instrument:
Memory reads All instructions that read from memory, inserting multiple calls if the instruction reads from multiple locations. The instrumentation function for memory reads takes as arguments the address read from and the size of the read (in bytes). It then updates the read-mask.
Memory writes All instructions that write to memory, inserting multiple calls if the instruction writes to multiple locations. The instrumentation function for memory writes takes as an argument the address that was written to along with the size of the write (in bytes). It then updates the write-mask.
The RIP The instruction at the location of the RIP, where we run speculative executions and fast-forward the main program. The instrumentation function takes as an argument a context data structure containing the values of all the worker process’s registers (including flag registers) at the time the RIP is reached. The instrumentation function copies those register values as well as the contents of the program’s active memory areas into the shared memory segment, signals NewAge, and then sleeps. While the instrumentation function sleeps, NewAge replaces the contents of the shared memory segment with new memory and register values and then signals the Pintool. The instrumentation function wakes up and copies the new memory values from the shared memory section into their proper locations, clears the read- and write- masks, and restarts execution using the new register and memory values.
3.6 Scattering and Gathering
Creating predicted states and recording cache entries requires that NewAge be able to construct copies of program state. We accomplish this using ptrace and shared memory to perform scattering and gathering operations on a process’s memory image.
We create a copy of a program’s state via a gather operation. We gather from the main process by using ptrace to copy in its registers, then using direct memory access (DMA) via Linux’s process_vm_readv to copy in writable segments of its memory space. We gather from workers by having them copy the contents of their registers and writable memory segments into shared memory whenever they reach the breakpoint, then sleep and await scattering. Scatter is the opposite. For the main process, we use ptrace to place the registers that are in the state vector into a process and use DMA via Linux’s process_vm_writev to copy the writable memory segments from the vector into the process. For the workers, we have ASC place the state vector it wishes to scatter into shared memory, then wake the worker and have it copy the contents of shared memory into its registers and memory.
4 Experiments
The goal of our evaluation is twofold: to determine how effective our implementation is at achieving speedup and to identify the limitations in ASC’s ability to provide such speedup. We begin by introducing a set of kernel benchmarks and the methodology we use to evaluate them. Next, we demonstrate NewAge’s speedup on the collection of kernels. We deconstruct those results by examining how well data dependency tracking (the reduction of the state space from all of memory to the set of bits that change during computation and whose changes affect the results of speculations) reduces state size, quantifying how much overhead Pin introduces, which we use to derive the CPU efficiency we achieve in the presence of Pin. This, in turn, limits the speedup possible by NewAge, and we examine how close it comes to achieving that maximum speedup. We report on the efficacy of our predictions and conclude the section with a discussion of the inherent limitations in ASC.
4.1 Kernels
Our benchmark collection draws on three sources: kernels used in the prior ASC paper, kernels we wrote ourselves, and kernels from the Polyhedral Benchmark suite (PolyBench/C) [22]. We briefly describe the prior ASC benchmarks and the benchmarks we wrote; PolyBench/C is described in detail online [22].
The kernels adopted from the original ASC [29] work are:
collatz: A kernel that iterates through a range of positive integers, testing if each satisfies the Collatz conjecture. The Collatz conjecture states that if one starts with some positive integer and sequentially divides it by two if it is even and multiplies by three and adds one if it is odd, the sequence will eventually converge to one.
ising: A pointer-based condensed matter physics program. It iterates through a linked list of spin configurations, identifying the element in the list with the lowest energy state. It is interesting because existing parallelizing compilers cannot parallelize it due to the pointer dereferencing [29]. NewAge parallelizes it by predicting values referencing later nodes of the linked list.
Next, we run the PolyBench/C [22] kernels, each adapted slightly to deal with artifacts of the ASC implementation while still performing the same computations.
The two new kernels we introduced are:
3sum: A naive cubic solver for the 3-subset sum problem. It generates a large random list of integers and iterates through it looking for a set of three integers that sum to zero. NewAge parallelizes it by having workers test different sets of integers.
readmap: A simple, but computationally intensive, map operation that repeatedly adds random values to entries in an array. NewAge parallelizes it by having different workers perform the map on different elements of the array.
4.2 Methodology
We ran all experiments on a Microway 1U Xeon server with two Intel Xeon E5-v4 processors. Each of the two processors has 22 cores, for a total of 44. We disabled Intel Turbo Boost on all cores to guarantee consistent clock speeds between cores. The server has 256 GB of main memory. We designed all kernels to randomize behavior between runs (for example, 3sum randomly generates its search space every run). This randomization demonstrates that NewAge is actually making predictions about states and not simply memorizing end states. The exception to the randomization is collatz, whose nature is not amenable to randomization. We experimented on collatz by training it on one set of numbers and testing it on a different set of numbers. We used our recognizer (§ 3.1) to identify the RIP (the location for which we will make predictions). We compiled all kernels, except readmap, with clang using O1 optimization and the live register analysis described earlier. We compiled readmap with optimization level O0, because any dead code elimination pass trivializes it. We trained all decision trees offline by running each kernel ten times on different inputs. We used these trees in all subsequent experiments. We validate all outputs against the same programs run natively.
4.3 Speedup and Analysis
Figure 3 shows the speedup results for all kernels, both our own and PolyBench/C, for which we could attain speedup. We were able to attain speedup for all of our own kernels plus seven PolyBench/C kernels–cov, gemm, trmm, syrk, syr2k, 2mm, and 3mm. The benchmarks for which we were unable to achieve speedup fall into two categories: those for which our learning model was unable to make accurate predictions (e.g., warshall, cholesky) and those whose runtime is small relative to memory size (e.g., gesummv, many stencils). For the latter class, we could make accurate predictions but our overheads due to memory consumption were too great. We discuss this in more detail in § 4.5.
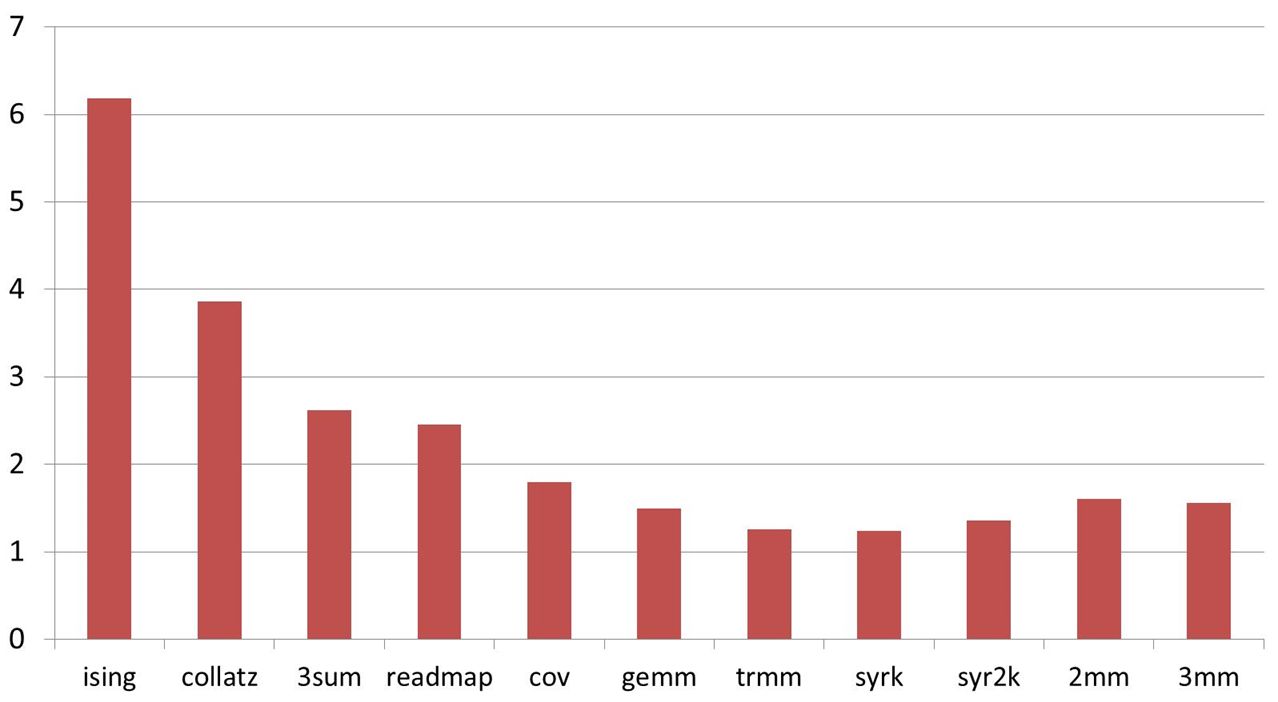
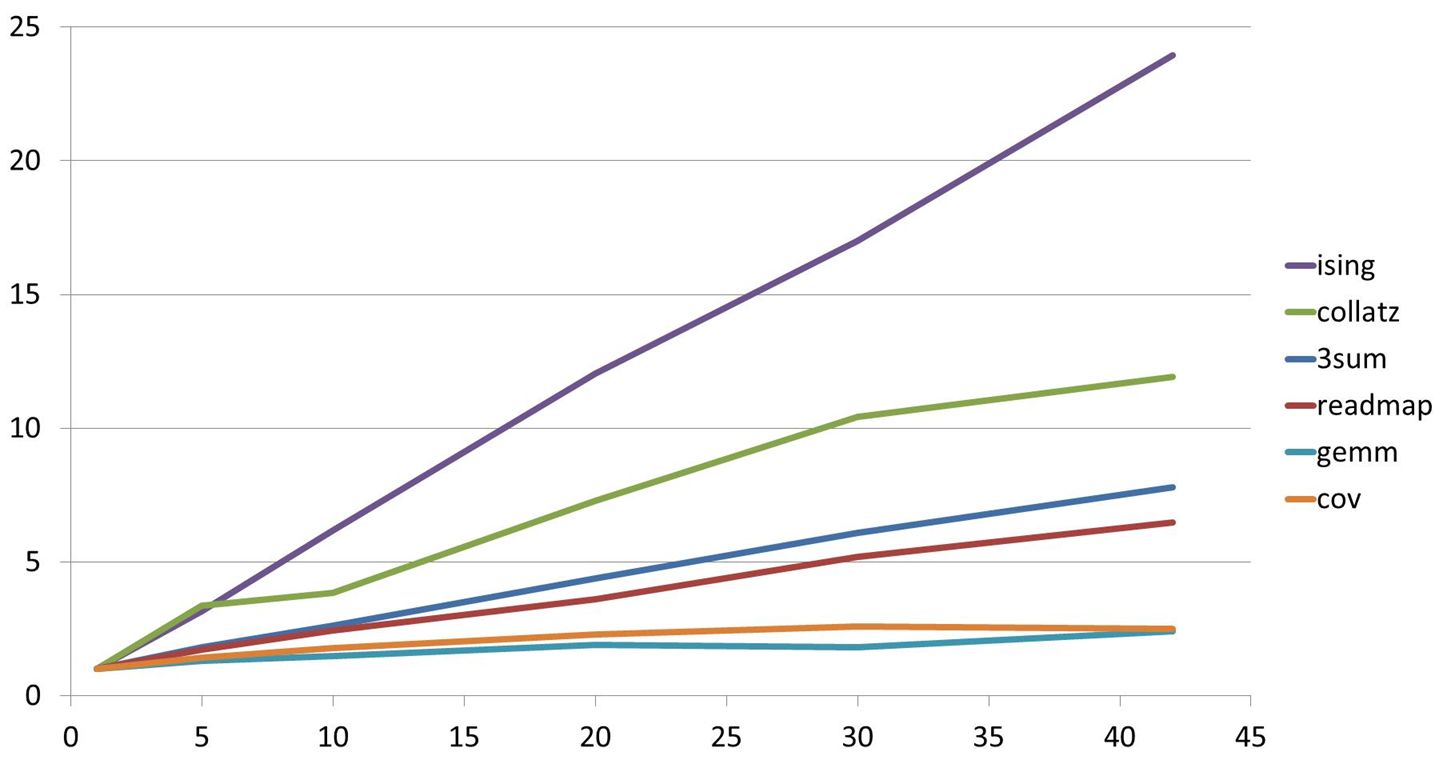
In the interest of conserving space, we restrict our detailed analyses to the performance of six of the kernels each of which demonstrate different aspects of ASC. As we mention below, some of these, e.g., gemm, are representative of a large class of programs. We defer discussion of the benchmarks for which we are unable to attain speedup to § 4.7, where we discuss the limitations of ASC and NewAge. Figure 4 shows the speedup results for our six selected kernels, using 5, 10, 20, 30, and the full complement of 42 workers (reserving one core for the main process and another for NewAge itself). Observe that there is a wide range in the scalability achieved for the different benchmarks with ising using over 50% of all 44 cores, while cov achieves far less. The following sections walk through the factors that determine the speedup possible, given the NewAge implementation.
4.4 State Space Size
| Kernel | Bits w/out DT | Bits with DT |
|---|---|---|
| 3sum | 80 | 80 |
| readmap | 2520 | 120 |
| collatz | 224 | 224 |
| ising | 280 | 280 |
| gemm | 1024000088 | 88 |
| cov | 576000352 | 352 |
We begin our performance analysis by examining the state sizes for each kernel. We define the size of the state space induced by our Recognized Instruction Pointer (RIP) as the total number of bits whose values NewAge must predict. As discussed in Section 3.3, these are the bits that change during computation between two occurrences of the RIP and whose changes affect the results of future speculations. Table 1 shows the state space sizes for each kernel with and without data dependency tracking. The results reveal two important points. First, some kernels do not require data dependency tracking (i.e., collatz, ising, and 3sum), because they do not modify large areas of memory. Second, while data dependency tracking reduces the state size of readmap only modestly, it makes a profound difference for gemm and cov. Note that the two programs with the large state spaces are also the two kernels obtaining the least speedup; we’ll examine this further in the next section.
4.5 CPU Efficiency
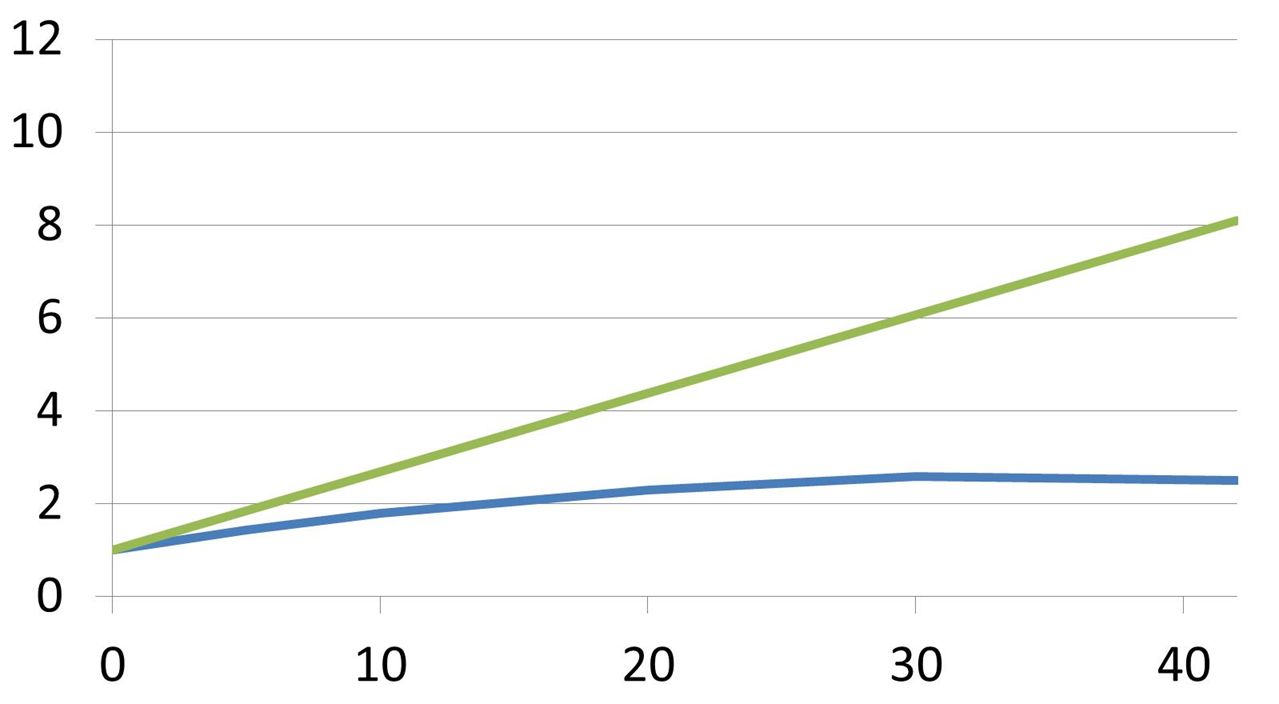
Next, we examine Pin’s overhead and the resulting computational efficiency we obtain from our workers. Let’s begin by assuming that we have an ideal model that always produces accurate predictions and that Pin introduces no overhead. In this scenario, depicted in Figure 5, workers run at exactly the same speed as the main process; we call this 100% CPU efficiency.
Next, let’s assume a more realistic scenario where we retain our perfect prediction, but in which Pin introduces 50% overhead, meaning that workers run at half the main process’s speed, or alternately, that workers take twice as long to complete the same amount of work. Figure 6 depicts this scenario.

When we had 100% efficiency, we were able to produce 2x speedup with two cores. However, when the workers operate at 50% efficiency, it takes three cores to achieve the same 2x speedup. More generally, if a kernel’s CPU efficiency is , then the maximum speedup it can attain for workers is . We use this formula in Figure 7 to compare the actual speedups attained by each kernel with the maximum speedups given their CPU efficiencies.
| Kernel | CPU Efficiency |
|---|---|
| 3sum | 20.1% |
| readmap | 16.1 % |
| collatz | 31.7 % |
| ising | 65.4 % |
| gemm | 10.1% |
| cov | 16.9% |
readmap
gemm
cov
3sum
ising
collatz
As we can see from the figures, four of the kernels come close to achieving their maximum speedup. The two outliers are the poorly performing kernels, cov and gemm. Note that these are also the kernels with extremely large state spaces. So, what is it about large state spaces that inhibit scaling?
gemm uses well over a gigabyte of state space, and cov users several hundred megabytes per worker. The overhead incurred from gathering, scattering, and performing computational cache operations on these gigantic memory spaces causes cov and gemm to attain less speedup than they would otherwise. This is worsened by slowdown from CPU cache contention between all of the workers, making them compute somewhat more slowly than they would otherwise. In cov these problems are exacerbated by the nonuniform distance between breakpoints explained in Section 4.6, which makes optimal scheduling of workers difficult and wastes large amounts of worker time. This is the limiting factor for all our large memory benchmarks: trmm, syr2k, 2mm, 3mm.
Returning to the four kernels that produce speedup within a small factor of the theoretical maximum given their CPU efficiencies, two of these kernels have especially interesting results. collatz actually attains more speedup than the “theoretical maximum” for small numbers of cores, because it can reuse speculations left in the cache from earlier predictions. That is, if every value tested eventually converges to the value 1, then we know that the last calculation performed for a given value is , the calculation before that is , the one before is , the one before that is , and the one before that is either or . NewAge learns these patterns and is able to fast forward through increasingly long convergence paths. This automatic memoization was also present in the original ASC implementation [29].
ising, meanwhile, attains near-optimal speedup while having extremely high CPU efficiency, demonstrating that NewAge does not rely on its kernels having poor CPU efficiencies to scale. This suggests that improving our CPU efficiency via a lower overhead data dependency tracking mechanism will not harm NewAge’s scalability. All four kernels’ speedups are close to our predicted maximums, given their CPU efficiencies. This is, perhaps, the strongest validation of the ASC architecture to date: if we account for the CPU efficiencies of the workers, our system achieves speedups comparable to other parallelization systems on kernels with modest memory overhead. More importantly, speedups on all four kernels scale near-linearly with an increasing number of cores. This suggests that ASC can achieve its goal of providing near-linear automatic parallelization of programs.
4.6 Computational Cache Hit Rates
Lastly, we examine the efficacy of our predictors by examining our computational cache hit rates. Computational cache hit rates are defined as the percentage of lookups (including both synchronous and asynchronous iterated lookups as per Section 3.3) into NewAge’s computational cache (the one described in 3.3) that hit. Computational cache hit rates can also be thought of as the percentage of computation done by the workers instead of on the main process. A computational cache hit rate of 80% means that the workers did 80% of the overall computation. Computational cache hit rates can be used to estimate speedup. For example, a computational cache hit rate of 80% implies 5x speedup, because only 20% of the overall computation is performed by the main process, while the remaining 80% is done “for free” in parallel by workers on auxiliary cores. High levels of overhead can cause speedup to be less than that estimate, however.
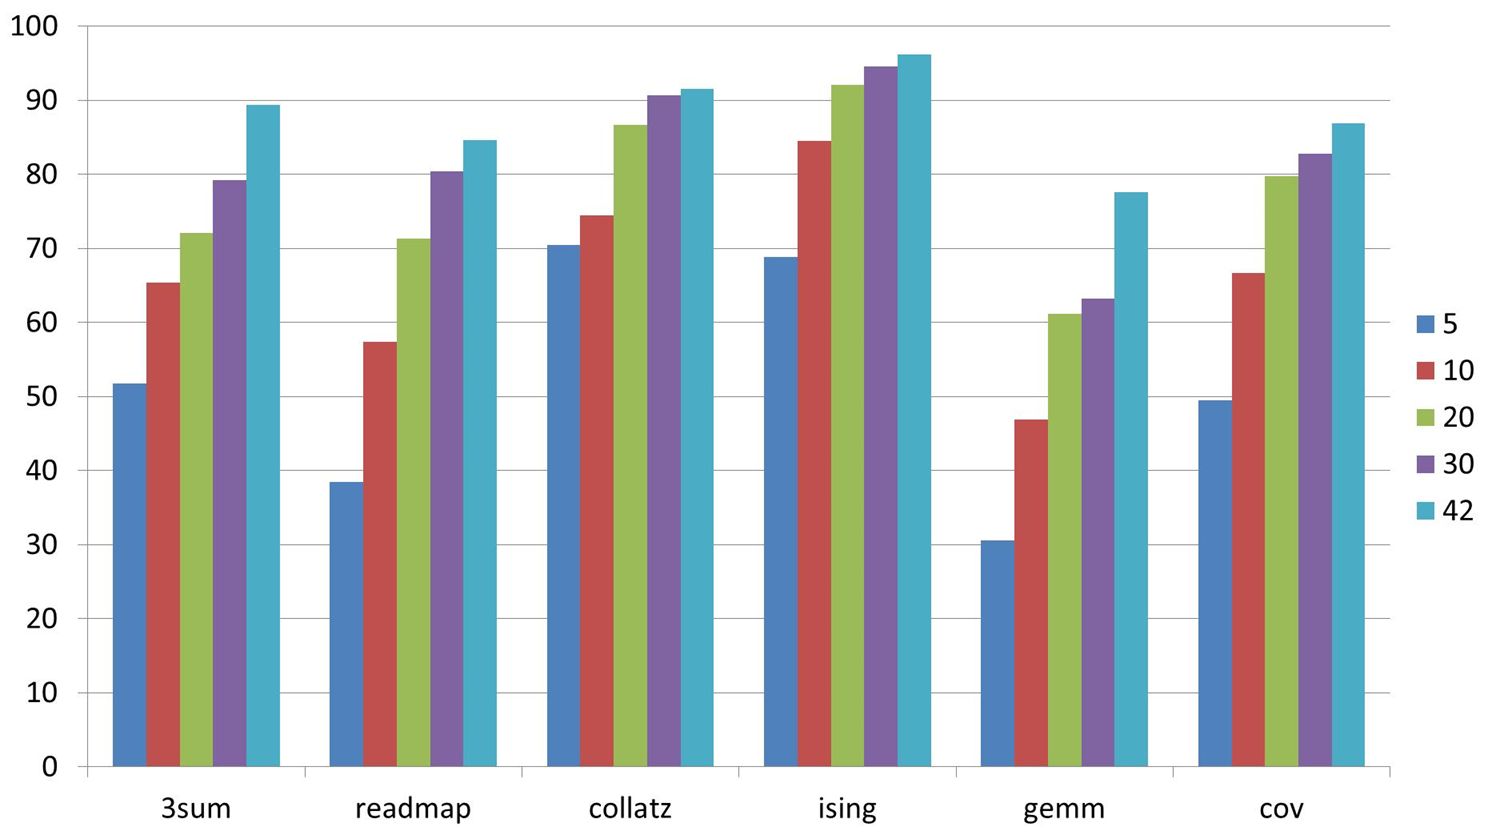
Figure 8 presents the computational cache hit rates for all six kernels as a function of the number of workers. Four of the kernels—readmap, collatz, ising, and gemm— have computational cache hit rates exactly as we expect. That is their hit rate is equal to the percentage of computation done by the workers instead of by the main process as explained. For three of these, the computational cache hit rate serves as a good estimator of the speedup we report in Section 4.3 (the exception, gemm, achieves less speedup than one would expect due to complications from its massive memory usage). Out of these kernels, ising and collatz have the highest computational cache hit rate, due to their high CPU efficiency and collatz’s auto-memoization, which allows it to reuse the results of earlier speculations. readmap performs slightly worse. gemm has a lower computational cache hit rate than any of the preceding three, because of its low CPU efficiency.
For the remaining two kernels, 3sum and cov, the computational cache hit rates are somewhat misleading, because the distances between breakpoints are non-uniform. Both programs reach the breakpoint increasingly frequently as they run. In 3sum this occurs because the size of the kernel’s search space shrinks. In cov this occurs because the height of the column of the triangular matrix the kernel calculates shrinks. Because the amount of computation done between breakpoints is non-uniform, the linear relation between computational cache hit rate and speedup breaks down. In cov, the computational cache hit rate is an overestimate of the amount of speedup achieved, because later workers add a large number of cache entries that correspond to little computation but still register as cache hits. In 3sum, which reaches its breakpoint more frequently than cov, the exact opposite happens, causing the computational cache hit rate to underestimate the amount of speedup. Towards the end of computation, it queries the cache more quickly than the workers can fill it. This causes a large number of misses, but does not reduce speedup because those cache misses result in trivial amounts of computation.
4.7 Fundamental Limitations of ASC
The primary advantage of ASC with respect to other automatic learning systems is its flexibility. Other systems mostly use some form of program analysis (both static and dynamic) to analyze dependencies within loops and are limited by the power of the analysis techniques. ASC, however, converts parallelization into a machine learning problem and is limited only by the ability of its learners to predict future states of a program, such as future iterations of a loop dependent on work done in past iterations. This means that programs that cannot be parallelized by a static compiler because of the data dependencies (loop dependent or independent) can be parallelized by ASC. 222Strictly speaking, a compiler can be customized to perform peephole transformations for special cases; but the technique is not generic.
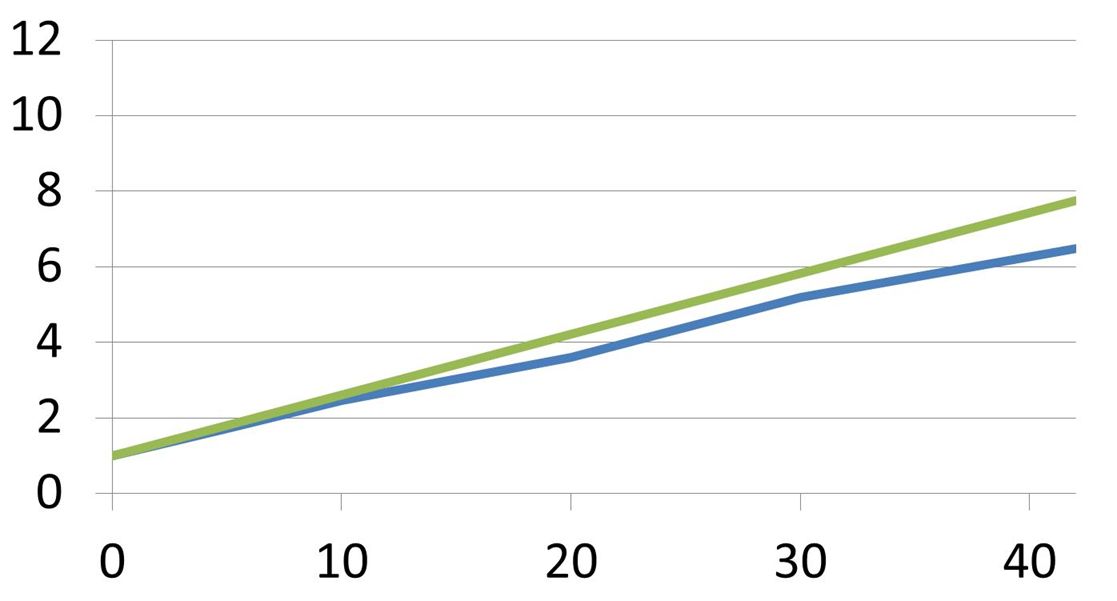
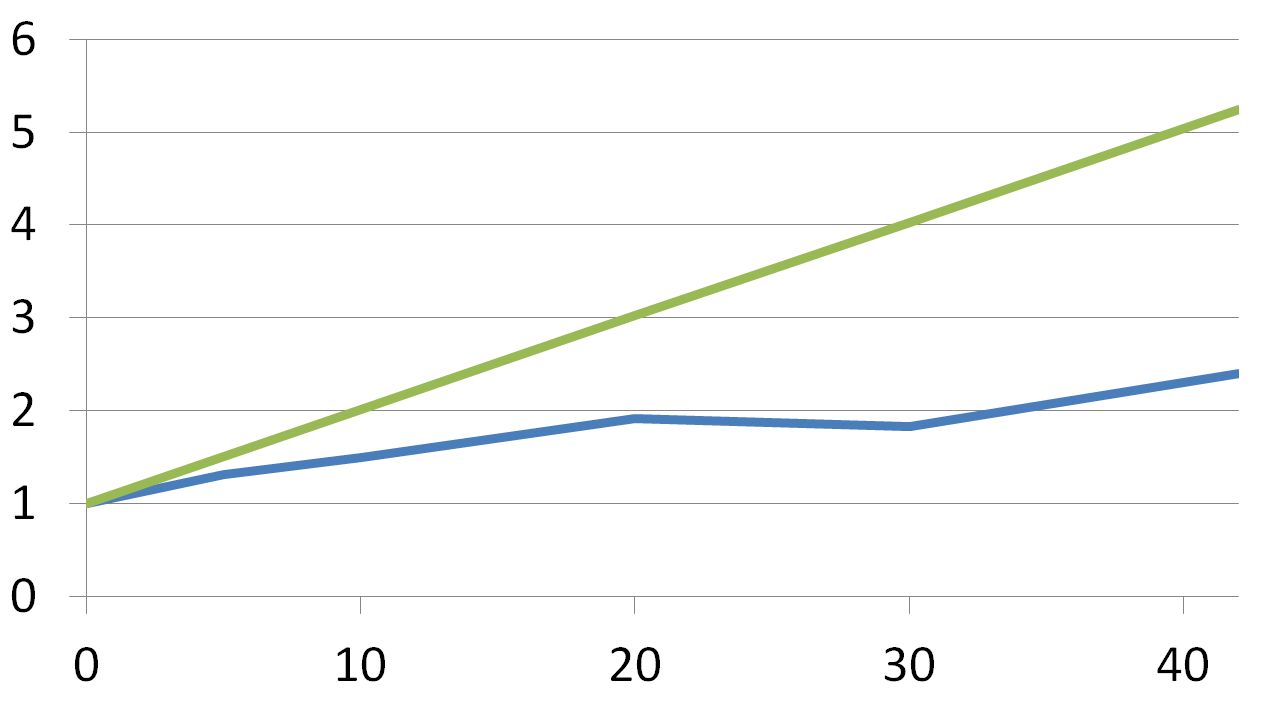
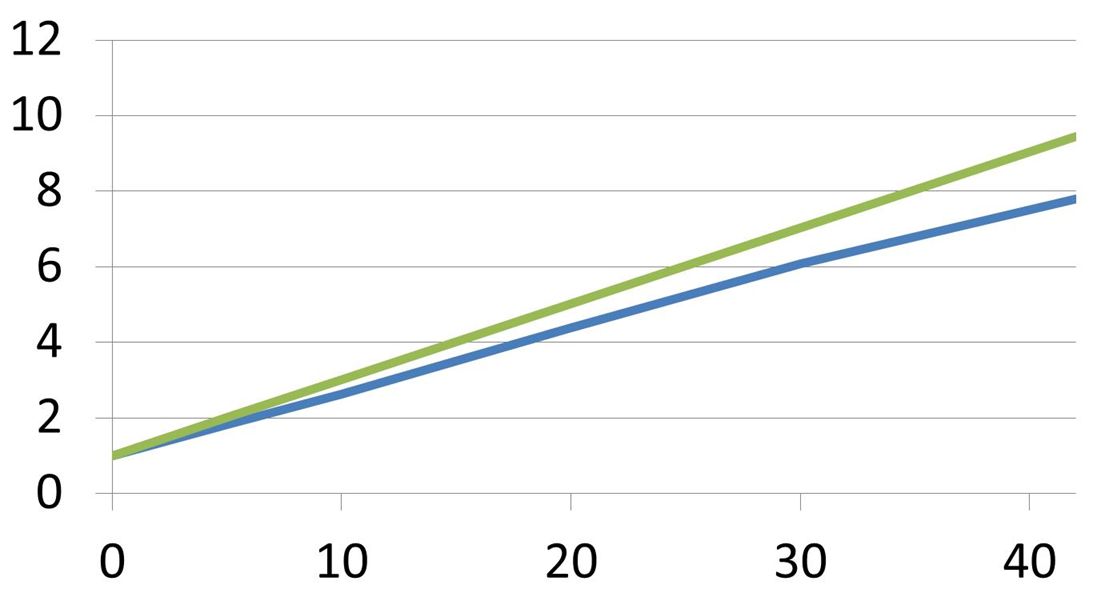
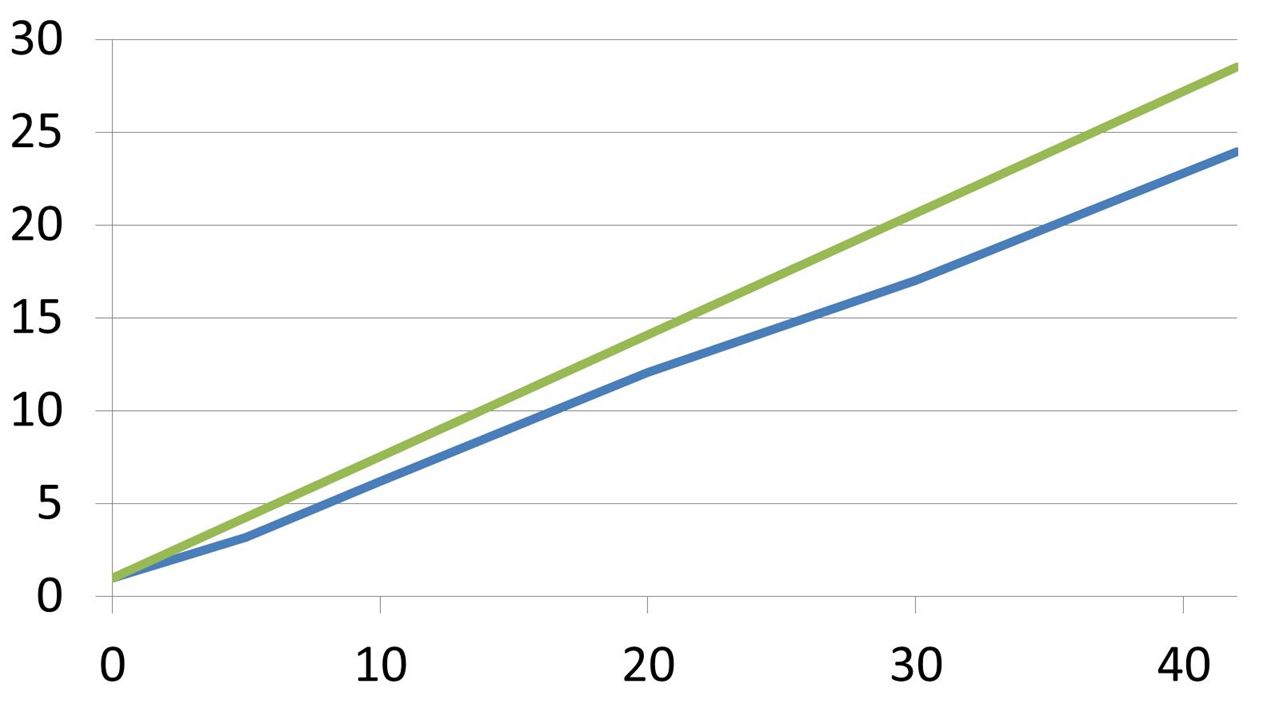
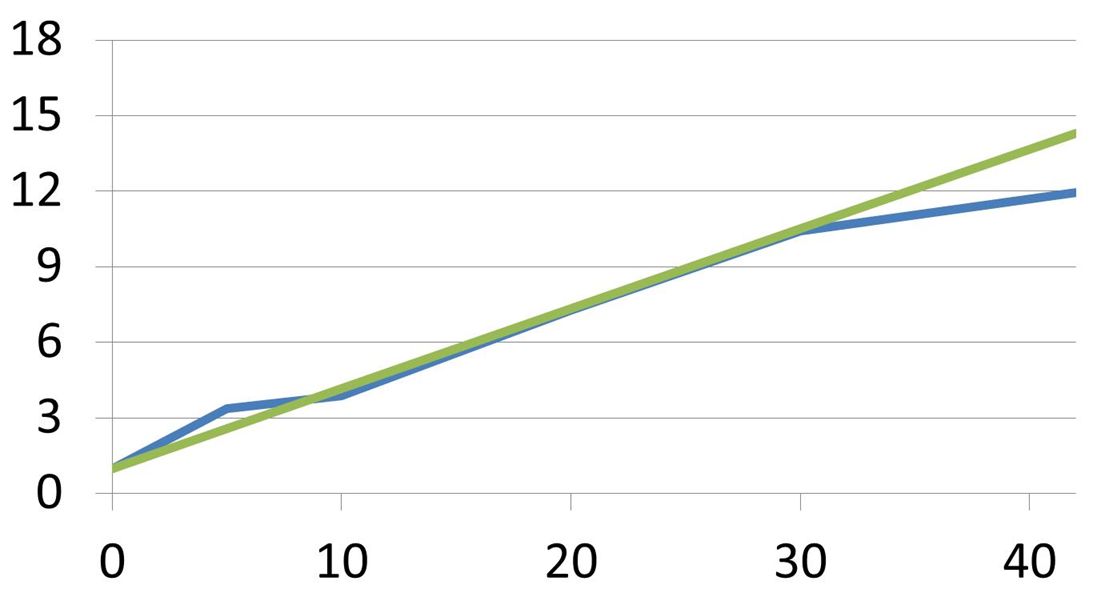
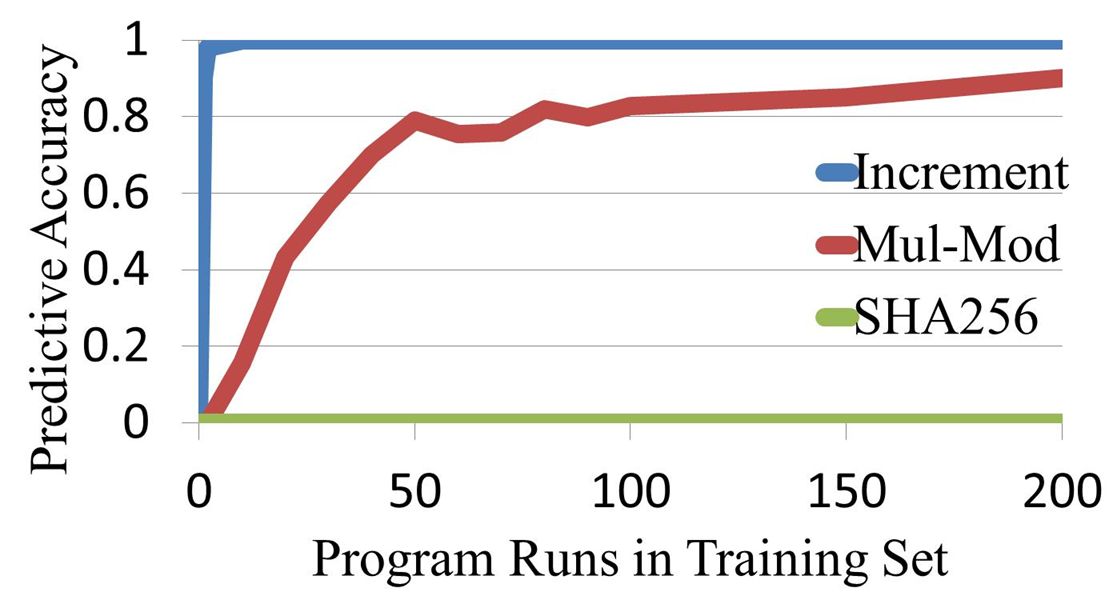
Listing 1 presents an example. Each iteration of the loop depends on previous iterations; specifically on the values of . While the program seems trivial as written, one can easily imagine a more complex version, where additional operations performed on before insertion into make parallelization necessary. Any form of automatic parallelization dependent on static analysis would have trouble parallelizing Listing 1, especially for complicated functions , because of the dependencies between loop iterations. NewAge, however, can parallelize Listing 1 for functions whose future values it can predict. Figure 9 illustrates this. For a simple function , such as , NewAge achieves 100% predictive accuracy and fully parallelizes the program within a couple of iterations. For a more complex function, such as , where and are nontrivial primes, NewAge takes a bit longer to be able to predict future values of , but accuracy eventually reaches 100%. But functions whose raison d’etre is to be unpredictable, such as , are impossible for NewAge or any ASC implementation to parallelize; it would be very bad if cryptographic hashes could be predicted efficiently.
5 Related Work
As the goal of the ASC approach is automatic parallelization of single-threaded code, it shares history with, and has drawn ideas from, a large body of previous work. We divide this work into two broad categories: compiler parallelization and binary parallelization; we note that there are a small number of speculation-based systems [20] that do not fit neatly into our categorization. We further divide each of these categories into their static and dynamic versions; ASC is a dynamic, binary parallelization system. We wrap up this section with a discussion of various approaches to obtaining the dependency information that is crucial to ASC’s ability to speed up many programs.
5.1 Compiler Parallelization
The most traditional method of parallelization is static compiler parallelization. This can take different forms. The most frequently used approach is to write the program in a parallel language, e.g., Cilk [3], or using a parallel runtime, e.g., OpenMP [7]. OpenMP uses pragmas to provide an API to the compiler to indicate opportunity for parallelization. Although not entirely automatic, OpenMP does the work of parallelization, with the programmer only needing to provide hints. Cilk is a superset of C/C++ that introduces keywords for forking and joining threads and provides a scheduler to use them properly. Again, this is not fully automatic, but makes it relatively easy for programmers to parallelize otherwise sequential code.
Fully automatic static compilation requires that the compiler recognize parallelizable loops, detect that the loop computations are independent [1, 14], and then introduce the proper thread structure to leverage the opportunity. For example, the Intel Compilers will automatically generate OpenMP pragmas for C++ and Fortran, when they detect loops that can be safely and efficiently executed in parallel [13]. Such static methods are limited to parallelizing loops where the compiler is certain of the absence of the data dependencies. Compilers used in high performance computing employ sophisticated dependent analysis techniques that include identifying important programming patterns and transforming them to equivalent programs that are amenable for parallelization [12, 6, 10]. However, these techniques only handle regular loops and quickly degenerate in presence of less regular loops or non-standard patterns.
A special case of automatic parallelization is automatic vectorization where multiple pairs of scalar operands are operated on at once. Such compilers use data dependence analysis to check the feasibility of such transformations and output a vectorized instruction if possible [17, 9, 13]. The granularity of parallelization in vectorization is much finer than that aimed at by ASC and is thus complementary to ASC. Moreover, ASC benefits from vectorized instructions, exploiting them heavily in its internal sparse state vector representation.
Thread-Level Speculation (TLS) provides a more powerful alternative. TLS parallelizes code with ambiguous dependencies by making assumptions about the dependencies, then uses hardware to check those assumptions at runtime. If the speculations are correct, the computation is used; if they are not, they can be ignored [25, 11]. Hybrid analysis, which is similar to TLS, performs relatively liberal static analysis then does runtime failsafe checking in software [24]. Both hybrid and TLS techniques are similar to ASC in that they make use of speculation, but they differ in their a priori use of static analysis, and in the case of TLS, of hardware support.
There are other hybrid approaches that use both static and dynamic analysis. One approach is to pipeline loops into separate threads that do not have cyclic dependencies [21, 27], sometimes with the help of software transactional memory [23]. This is unpredictable due to the complexity of the pipelining transformation, though, and can just as easily slow a program down as speed it up. Another technique, and the one most similar to ours, is to have the compiler parallelize a loop while dynamically transmitting information about data dependency between cores to guarantee synchronization and correctness. The HELIX compiler uses this approach [5]. Like our approach, HELIX can parallelize a variety of programs. However, HELIX remains dependent on static analysis, and thus regular data access patterns, and it can easily be crippled by communication overhead.
5.2 Binary Parallelization
The limitations of compiler parallelization have inspired a variety of alternatives that operate directly on binaries, whether statically or dynamically. Like ASC, conventional binary parallelization systems lose access to the sometimes-valuable semantic information of source code. In exchange, they also lose their dependency on having access to the source code and, if they are dynamic, gain access to runtime information.
The variety of binary parallelization techniques is, if anything, even greater than the variety of compiler parallelization techniques. One approach is direct binary translation, which transforms a sequential binary into a parallelized one [15, 31]. This has many of the same advantages and disadvantages as static compiler parallelization—it is extremely powerful when it works (even more so than compiler parallelization, as it does not require the source code and has access to the library binaries), but does not work on many programs due to the limits of static analysis [15]. A closely related technique is slicing, which uses static analysis of data flow to divide a program into parallel slices, while using speculation to work around rare dependencies [28].
Alternatively, Dynamic Binary Parallelization (DBP) techniques abandon static analysis altogether. One of the first examples of this work is Dynamo [2]. Although Dynamo was not a parallelization scheme per se, rather optimizer that identified critical sections in code as it ran and made them faster, it inspired work in parallelization. For example, DBP monitors program execution for frequently-executed hot traces that can be parallelized as they reappear [30]. Such approaches share ASC’s predict-speculate-fast-forward paradigm, but are limited by their reliance on hot traces alone, unlike ASC’s more general-purpose prediction.
5.3 Dynamic Instrumentation
Our ASC implementation relies on dynamic instrumentation to identify the bits on which a computation depends. This is an area with a rich research history. One approach is full transformation, where the code is translated to an intermediate representation before being run on a virtual machine or simulator. Valgrind [19] is the most prominent example of this approach. Using a virtual machine, as the initial ASC prototype did [29], makes instrumentation much easier, as the virtual machine can simply record whatever it is simulating. However, the tradeoff for this ease of instrumentation is poor performance. Valgrind is, in the best case, four or five times slower than native code and is much worse with extensive instrumentation, while the first ASC prototype was multiple orders of magnitude slower than native execution.
Another approach to instrumentation, and the one we adopt, is to use an extremely lightweight just-in-time compiler (JIT) to run the binary code and insert instrumentation as appropriate. DynamoRIO [4] (based off of Dynamo) and Pin [18] are prominent examples of this approach. Both tools have extremely low base overhead (on the order of 10% for DynamoRIO and 30% for Pin), due to JIT optimization, and both allow the insertion of a wide range of instrumentation and analysis code. We chose Pin for its more powerful API and instrumentation capabilities.
6 Conclusions and Future Work
6.1 Summary
We present a new implementation of the ASC architecture, a powerful approach for automatic parallelization. We demonstrate that ASC is capable of working on unmodified binaries without the use of static analysis, providing more potential power than other automatic parallelization systems. We demonstrate ASC’s ability to automatically parallelize a variety of kernels. These kernels include fundamental parallelizable computations, such as maps or matrix multiplication, along with problems other automatic parallelization systems struggle with, such as linked list navigation and auto-memoization. Moreover, we show that ASC’s speedups scale linearly with the number of cores, allowing it to work efficiently on systems with large numbers of cores. This makes ASC potentially useful for many scientific computing applications, where researchers not trained in parallelization techniques need to run extremely computationally intensive programs on extremely powerful computers.
6.2 Future Work
We were pleasantly surprised at how well the ASC approach works in practice. These encouraging results suggest opportunities for even more powerful future implementations.
The most promising avenue of future work is improving on the computational efficiency of dependency tracking; Pin is effective, but expensive. There are at least two potential directions to explore: specialized hardware, perhaps similar to transactional memory hardware, that records information that we collect in the read and write masks, and virtual memory integration to more easily obtain information on what areas of memory were read from and written to.
While dependency tracking dramatically reduces the size of the state space for some kernels, it does not minimize it. As a result, there are many programs that are parallelizable but that ASC cannot speed-up. For example, ASC cannot speed up an accumulator that sums the elements in an array, because that requires predicting the values of the sum. If ASC’s analysis revealed that, for example, the value of the sum was never queried but only added to itself (an associative and commutative operation), ASC could replace the prediction of sum with an addition of partial values.
Section 4.3 showed that NewAge’s performance relative to theoretical maximums is good, but we believe it should be possible to do better, particularly on large footprint programs. Better code optimization for operations such as scatter, gather, and predict should reduce the constant factor of our linear time-dependence on the memory size of worker processes. This should dramatically improve performance on high-memory kernels such as gemm.
The completion of any of these will make ASC far more powerful. The development of all of them—which is completely possible—will make ASC a fully mature technology capable of outperforming and outscaling other automatic parallelization approaches.
References
- [1] Adve, V. S., Mellor-Crummey, J., Anderson, M., Kennedy, K., Wang, J., and Reed, D. A. An Integrated Compilation and Performance Analysis Environment for Data Parallel Programs. Tech. rep., University of Illinois at Urbana-Champaign, Champaign, IL, USA, 1995.
- [2] Bala, V., Duesterwald, E., and Banerjia, S. Dynamo: A Transparent Dynamic Optimization System. ACM SIGPLAN Notices 35, 5 (2000), 1–12.
- [3] Blumofe, R. D., Joerg, C. F., Kuszmaul, B. C., Leiserson, C. E., Randall, K. H., and Zhou, Y. Cilk: An efficient multithreaded runtime system. In Proceedings of the Fifth ACM SIGPLAN Symposium on Principles and Practice of Parallel Programming (New York, NY, USA, 1995), PPOPP ’95, ACM, pp. 207–216.
- [4] Bruening, D., Garnett, T., and Amarasinghe, S. An Infrastructure for Adaptive Dynamic Optimization. In International Symposium on Code Generation and Optimization (2003), IEEE, pp. 265–275.
- [5] Campanoni, S., Jones, T., Holloway, G., Wei, G.-Y., and Brooks, D. The HELIX project: Overview and Directions. In Proceedings of the 49th Annual Design Automation Conference (2012), ACM, pp. 277–282.
- [6] Cray. Cray Compiling Environment (CCE).
- [7] Dagum, L., and Menon, R. OpenMP: An Industry-Standard API for Shared-Memory Programming. IEEE computational science and engineering 5, 1 (1998), 46–55.
- [8] Dennard, R. H., Gaensslen, F. H., nien Yu, H., Rideout, V. L., Bassous, E., Andre, and Leblanc, R. Design of Ion-implanted MOSFETs with Very Small Physical Dimensions. IEEE Journal on Solid-State Circuits (1974), 256.
- [9] The GNU Compiler Collection. https://gcc.gnu.org/.
- [10] Group, T. P. PGI Compilers.
- [11] Hertzberg, B. Runtime Automatic Speculative Parallelization of Sequential Programs. PhD thesis, Stanford University, 2009.
- [12] IBM. XL C/C++/Fortan Compiler.
- [13] Intel. Intel C++ and Fortran Compilers. https://software.intel.com/en-us/intel-compilers.
- [14] Kennedy, K., and Allen, J. R. Optimizing Compilers for Modern Architectures: A Dependence-based Approach. Morgan Kaufmann Publishers Inc., San Francisco, CA, USA, 2002.
- [15] Kotha, A., Anand, K., Smithson, M., Yellareddy, G., and Barua, R. Automatic Parallelization in a Binary Rewriter. In Proceedings of the 2010 43rd Annual IEEE/ACM International Symposium on Microarchitecture (2010), IEEE Computer Society, pp. 547–557.
- [16] LeCun, Y., Bottou, L., Orr, G., and Muller, K. Efficient BackProp. In Neural Networks: Tricks of the trade (1998), G. Orr and M. K., Eds., Springer.
- [17] Low-Level Virtual Machine. http://llvm.org/.
- [18] Luk, C.-K., Cohn, R., Muth, R., Patil, H., Klauser, A., Lowney, G., Wallace, S., Reddi, V. J., and Hazelwood, K. Pin: Building customized program analysis tools with dynamic instrumentation. In Proceedings of the 2005 ACM SIGPLAN Conference on Programming Language Design and Implementation (New York, NY, USA, 2005), PLDI ’05, ACM, pp. 190–200.
- [19] Nethercote, N., and Seward, J. Valgrind: A framework for heavyweight dynamic binary instrumentation. In Proceedings of the 28th ACM SIGPLAN Conference on Programming Language Design and Implementation (New York, NY, USA, 2007), PLDI ’07, ACM, pp. 89–100.
- [20] Nightingale, E., Chen, P. M., and Flinn, J. Speculative execution in a distributed file system. ACM Transactions on Computer Systems (TOCS) 24/4 (November 2006), 361–392.
- [21] Ottoni, G., Rangan, R., Stoler, A., and August, D. I. Automatic Thread Extraction with Decoupled Software Pipelining. In Proceedings of the 38th Annual IEEE/ACM International Symposium on Microarchitecture (Washington, DC, USA, 2005), MICRO 38, IEEE Computer Society, pp. 105–118.
- [22] PolyBench/C: The Polyhedral Benchmark Suite. https://sourceforge.net/projects/polybench/.
- [23] Raman, A., Kim, H., Mason, T. R., Jablin, T. B., and August, D. I. Speculative parallelization using software multi-threaded transactions. SIGARCH Comput. Archit. News 38, 1 (Mar. 2010), 65–76.
- [24] Rus, S., Rauchwerger, L., and Hoeflinger, J. Hybrid Analysis: Static & Dynamic Memory Reference Analysis. International Journal of Parallel Programming 31, 4 (2003), 251–283.
- [25] Steffan, J. G., Colohan, C. B., Zhai, A., and Mowry, T. C. A scalable approach to thread-level speculation. In Proceedings of the 27th Annual International Symposium on Computer Architecture (New York, NY, USA, 2000), ISCA ’00, ACM, pp. 1–12.
- [26] Swersky, K., Snoek, J., and Adams, R. P. Freeze-Thaw Bayesian Optimization. In arXiv (2014), p. arXiv:1406.3896.
- [27] Vachharajani, N., Rangan, R., Raman, E., Bridges, M. J., Ottoni, G., and August, D. I. Speculative Decoupled Software Pipelining. In Proceedings of the 16th International Conference on Parallel Architecture and Compilation Techniques (Washington, DC, USA, 2007), PACT ’07, IEEE Computer Society, pp. 49–59.
- [28] Wang, C., Wu, Y., Borin, E., Hu, S., Liu, W., Sager, D., Ngai, T.-f., and Fang, J. Dynamic Parallelization of Single-Threaded Binary Programs Using Speculative Slicing. In Proceedings of the 23rd International Conference on Supercomputing (2009), ACM, pp. 158–168.
- [29] Waterland, A., Angelino, E., Adams, R. P., Appavoo, J., and Seltzer, M. Asc: Automatically scalable computation. SIGARCH Comput. Archit. News 42, 1 (Feb. 2014), 575–590.
- [30] Yang, J., Skadron, K., Soffa, M. L., and Whitehouse, K. Feasibility of Dynamic Binary Parallelization. In Proceedings of the 4th USENIX conference on Hot Topics in Parallelism (2011).
- [31] Yardimci, E., and Franz, M. Dynamic Parallelization and Mapping of Binary Executables on Hierarchical Platforms. In Proceedings of the 3rd Conference on Computing Frontiers (New York, NY, USA, 2006), CF ’06, ACM, pp. 127–138.