Tomography of the red supergiant star Cep
Abstract
A tomographic method, aiming at probing velocity fields at depth in stellar atmospheres, is applied to the red supergiant star Cep and to snapshots of 3D radiative-hydrodynamics simulation in order to constrain atmospheric motions and relate them to photometric variability.
keywords:
Techniques: spectroscopic, stars: atmospheres, supergiants.1 Introduction
Red supergiant (RSG) stars show irregular photometric variations characterized by two main periods ([Kiss et al. (2006), Kiss et al. 2006]): a short one (few hundred days) and a longer one (few thousand days). We focus on the short photometric period which was proposed to be due to either stellar pulsations or convection. We aim at constraining the atmospheric motions in the RSG star Cep and at relating them to photometic variability using a tomographic method ([Kravchenko et al. (2018), Kravchenko et al. 2018]).
Tomographic method aims at recovering the line-of-sight velocity field as a function of the optical depth in the atmosphere. The method is based on sorting spectral lines according to their formation depth provided by the contribution function (CF) maximum at each wavelength. This allows to split the atmosphere into different layers and construct masks which contain lines forming in the corresponding ranges of optical depths. The cross-correlation of masks with stellar spectra provides the velocity in the different atmospheric layers.
2 Application to Cep and 3D radiative-hydrodynamics (RHD) simulations
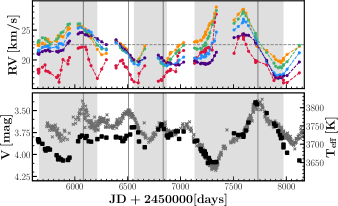
Cep was observed with the HERMES spectrograph ([Raskin et al. (2011), Raskin et al. 2011], R 86000). 95 spectra were obtained between April 2011 and January 2018, corresponding to a time span of about 7 years. A set of 5 tomographic masks was constructed from a 1D MARCS ([Gustafsson et al. (2008), Gustafsson et al. 2008]) model atmosphere with K and . The masks were cross-correlated with Cep spectra in order to provide RV in each atmospheric layer.
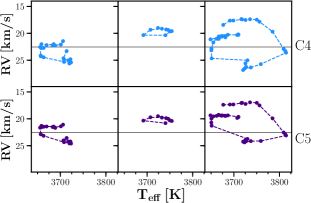
The RVs in masks C1-C5 are compared with the AAVSO light curve and the effective temperature () in Fig. 1. A phase shift of about 100 days is observed between RV and V magnitude (and ) variations. This phase lag results in hysteresis loops in the plane (Fig. 1) with timescales similar to the photometric ones. Similar hysteresis loops were observed by [Gray (2008), Gray (2008)] for Betelgeuse and interpreted as the turn-over of the material through a large convective cell.
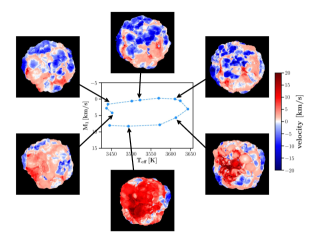
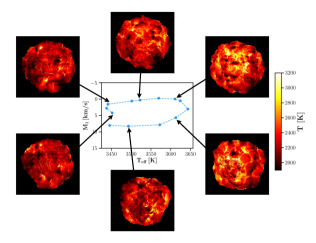
The tomographic method was applied to snapshots from the 3D RHD simulation of a RSG star performed with the CO5BOLD code ([Freytag et al. (2012), Freytag et al. 2012]). Hysteresis loops in the plane were detected and show timescales similar to the photometric ones. Velocity and temperature maps for snapshots along the hysteresis loop of mask C4 were weighted by the CF of a spectral line from the same mask. They are shown in Fig. 2 and reveal convective motions in the atmosphere. The consistency between the hysteresis loop timescales measured in Cep and in the 3D simulation indicates that convection might account for the short-period photometric variations in Cep.
References
- [Freytag et al. (2012)] Freytag, B., Steffen, M., Ludwig, H.-G., Wedemeyer-Böhm, S., Schaffenberger, W., Steiner, O. 2012, J. Comput. Phys., 231, 919
- [Gray (2008)] Gray, D.F. 2008, AJ, 135, 1450
- [Gustafsson et al. (2008)] Gustafsson, B., Edvardsson, B., Eriksson, K., Jørgensen, U.G., et al. 2008, A&A, 486, 951
- [Kiss et al. (2006)] Kiss, L.L., Szab, G.M., Bedding, T.R. 2006, MNRAS, 372, 1721
- [Kravchenko et al. (2018)] Kravchenko, K., Van Eck, S., Chiavassa, A., Jorissen, A., et al. 2018, A&A, 610, A29
- [Raskin et al. (2011)] Raskin, G., van Winckel, H., Hensberge, H., Jorissen, A., et al. 2011, A&A, 526, A69