A NICER Discovery of a Low-Frequency Quasi-Periodic Oscillation in the Soft-Intermediate State of MAXI J1535–571
Abstract
We present the discovery of a low-frequency 5.7 Hz quasi-periodic oscillation (QPO) feature in observations of the black hole X-ray binary MAXI J1535–571 in its soft-intermediate state, obtained in 2017 September–October by the Neutron Star Interior Composition Explorer (NICER). The feature is relatively broad (compared to other low-frequency QPOs; quality factor ) and weak (1.9% rms in 3–10 keV), and is accompanied by a weak harmonic and low-amplitude broadband noise. These characteristics identify it as a weak Type A/B QPO, similar to ones previously identified in the soft-intermediate state of the transient black hole X-ray binary XTE J1550–564. The lag-energy spectrum of the QPO shows increasing soft lags toward lower energies, approaching 50 ms at 1 keV (with respect to a 3–10 keV continuum). This large phase shift has similar amplitude but opposite sign to that seen in Rossi X-Ray Timing Explorer data for a Type B QPO from the transient black hole X-ray binary GX 339–4. Previous phase-resolved spectroscopy analysis of the Type B QPO in GX 339–4 pointed toward a precessing jet-like corona illuminating the accretion disk as the origin of the QPO signal. We suggest that this QPO in MAXI J1535–571 may have the same origin, with the different lag sign depending on the scale height of the emitting region and the observer inclination angle.
1 Introduction
MAXI J1535–571 is a newly discovered transient X-ray binary that went into outburst starting on 2017 September 2. It was independently discovered in the X-rays by the Monitor of All-sky X-Ray Image (MAXI; Negoro et al. 2017b) and the Neil Gehrels Swift Observatory (Markwardt et al., 2017; Kennea et al., 2017). Its multi-wavelength properties strongly suggested that the source is an accreting stellar-mass black hole, initially seen in the hard spectral state (Scaringi & ASTR211 Students, 2017a, b; Negoro et al., 2017a; Russell et al., 2017b; Dincer, 2017; Britt et al., 2017; Xu et al., 2018).
One week following its discovery, X-ray, radio, and sub-mm detections showed the source brightening and entering the hard-intermediate spectral state (Nakahira et al., 2017; Kennea, 2017; Palmer et al., 2017; Tetarenko et al., 2017; Shidatsu et al., 2017b). In the hard-intermediate state, low-frequency quasi-periodic oscillations (LF QPOs) were detected in the X-ray light curve by Swift (Mereminskiy & Grebenev, 2017; Russell et al., 2017a) and the Neutron Star Interior Composition Explorer (NICER; Gendreau et al. 2017). Detailed spectral fits to a NICER observation from 2017 September 13 showed a narrow Fe K emission line and strong reflection features, pointing toward a nearly-maximal black hole spin and a possible warp in the accretion disk (Miller et al., 2018).
The source continued to transition into the soft state in 2017 October and November (Shidatsu et al., 2017a). Although heavily extinguished (neutral column density few cm-2), MAXI J1535–571 reached extremely bright flux levels (up to 5 Crab in 2–20 keV flux; Shidatsu et al. 2017b). The source faded significantly in the soft state through the end of 2018 April to a 2–10 keV flux of 8 mCrab (Negoro et al., 2018), then showed repeated transitions between soft and hard spectral states at these low flux levels, beginning in early 2018 May (Russell et al., 2018; Parikh et al., 2018) and presently ongoing.111For up-to-date information on MAXI J1535–571 from MAXI, see http://maxi.riken.jp/nakahira/1535monitor/.
LF QPOs are associated with Fourier frequencies of 0.1 to tens of Hz in the X-ray light curves of accreting black hole X-ray binaries. The three types of LF QPOs seen in black hole X-ray binaries are classified as Types A, B, and C (Wijnands et al., 1999; Remillard et al., 2002; Casella et al., 2005; Motta et al., 2011). Over an entire outburst, Type C QPOs are the most commonly seen, Type B are sometimes seen, and Type A are rarely seen. Type A LF QPOs have low-amplitude broadband noise and no harmonic in the average power spectrum, and they appear in the soft-intermediate state of an outburst when the light curve has rms 3% in the 2–60 keV energy band. Type B LF QPOs are characterized by weak harmonics and weak broadband noise compared to the QPO amplitude, and appear in the soft-intermediate state when the rms of the light curve is 3%–5% in 2–60 keV (see, e.g., Heil et al. 2015b). Type C LF QPOs are characterized by strong harmonics and strong broadband noise, and appear in the hard-intermediate state when the rms of the light curve is 5%–30% in 2–60 keV. Type A QPOs have a weak, broad QPO peak at 8 Hz, Type B QPOs generally have a strong peak at 6 Hz (Motta et al. 2011 found that the Type B QPO peak frequency was anti-correlated with the source flux in GX 339–4), and Type C QPOs have peaks that tend to move or shift in the frequency range 0.1–20 Hz in (anti-)correlation with evolving spectral parameters (see, e.g., Vignarca et al. 2003; Stiele et al. 2013). The relative width of the QPO can be quantified by the coherence, , computed as a ratio of the QPO’s centroid frequency () to its FWHM; Type A typically have , Type B typically have , and Type C typically have (Casella et al., 2005).
Theories of the origin of LF QPO variability encompass several physical explanations that can broadly be categorized as geometric or intrinsic quasi-periodic variability. Systematic observational studies suggest that the LF QPO origin is linked to the geometry of the system due to the correlation of the QPO amplitude (Schnittman et al., 2006; Motta et al., 2015; Heil et al., 2015a) and the sign of the energy-dependent lags (van den Eijnden et al., 2017) with the binary orbit inclination. Type B and C QPOs show different amplitude-inclination correlations (Motta et al., 2015), which may suggest distinct origins.
Spectral-timing analysis reveals the nature and scaling of causal relationships between variations in the distinct emission regions in accreting black hole systems. These components can be identified from the X-ray spectrum (e.g., disk blackbody and Comptonized emission). Lags may be computed from the phase of the Fourier cross spectrum to measure the energy-dependent delays of variability in a narrow energy band of interest with respect to a (broad) reference band (Vaughan et al., 1994; Vaughan & Nowak, 1997), and relate them to the components seen in the X-ray spectrum. For a review and description of some of the key spectral-timing techniques applied to broadband noise, see Uttley et al. (2014).
In this Letter, we present the power and lag-energy spectral analysis of a weak Type A/B QPO from MAXI J1535–571 detected early in its outburst during a soft-intermediate state. We present spectral-timing data from the NICER payload operating on the International Space Station since 2017 June. NICER’s large collecting area, soft X-ray response, 100 eV energy resolution, 100 ns time resolution, and high count-rate capability enable unprecedented spectral-timing studies of QPOs, even of the weak feature we report here. In Section 2, we describe the data and data reduction procedure. In Section 3, we present the data selection criteria, average power spectrum, and lag-energy spectrum. The discussion and conclusions are presented in Section 4.
2 Data
The NICER X-Ray Timing Instrument (XTI) delivers photons onto 56 focal plane modules (FPMs) that are grouped into seven sets of eight, with each set read out by one measurement/power unit (MPU; Gendreau et al. 2012; Arzoumanian et al. 2014). FPMs 11, 20, 22, and 60 are not operational, so they do not contribute events to the NICER dataset. Furthermore, FPMs 14 and 34 were removed from our analysis.222FPM 14 was removed because it has been found to intermittently exhibit faults in its processing that can result in spurious energy spectral features (K. Hamaguchi 2017, private communication). FPM 34 is exceptionally sensitive to a solar light-leak that results in excessive noise, to the extent that noise contribution from this single FPM can exceed the rest of the XTI ensemble. Our “good” selection consists of 50 operational FPMs, providing an effective area of approximately 1800 cm2 at 1.5 keV.
In this Letter we present the analysis of NICER XTI observations obtained in 2017 September and October. These data correspond to ObsIDs 1050360101 through 1050361020 and 1130360101 through 1130360114. With a near-daily sampling of one or multiple few-100 s exposures, these observations provide a total exposure of 122 ks and photon counts. Based on the source spectral and timing properties (see Section 3.2), these observations correspond to the hard-intermediate and soft-intermediate states of accreting black holes.
The data were processed with nicerdas version 2018-03-01V003. The data were cleaned using standard calibration with nicercal and standard screening with nimaketime. We selected events that were detected outside the South Atlantic Anomaly, more than 40° away from the bright Earth limb, more that 30° away from the dark Earth limb, less than 54″ offset in pointing, not flagged as “overshoot” or “undershoot” resets, and triggered the slow signal chain (EVENT_FLAGS = x1x000). We also applied a “trumpet filtering” to remove known background events. These processing steps were automatically carried out in the standard NICER data reduction pipeline.
For our analysis, we split the NICER event list light curves into uninterrupted sequential 64 s segments. The XTI has an overall photon time-stamping resolution of 85 ns (1), but we bin light curves to a time step of s ( 3.9 ms). For 64 s light curve segments, this gives 16,384 time bins apiece. This time binning gives a Nyquist frequency of 128 Hz; having a Nyquist frequency much higher than our signal frequency lets us check for deadtime effects on the Poisson noise level (see Section 4).
Though the background contribution is expected to be negligible ( 2 count s-1; Keek et al. 2018; Ludlam et al. 2018), we applied a filter to remove segments that showed signs of flaring or non-source particle background. We calculated the average count rate in each FPM for each segment, and if any FPM count rate was more than four times half the interquartile range away from the median count rate of all FPMs, that segment was discarded. Out of 1917 total segment of data, 158 segments were discarded in this way. Of the 433 segments identified at the end of Section 3.2, 428 segments were kept and 5 segments were discarded. Here we used the measured interquartile range instead of the rms deviation to be more robust against bias from outliers. This filtering method also has the effect of removing data taken during passage through the polar horns, when there tends to be high particle radiation (as noted in Ludlam et al. 2018).
Due to the strong extinction seen from MAXI J1535–571, there are few intrinsically low-energy source counts below 1 keV, and the spectrum there is dominated by photons redistributed from higher energies. Thus, 1 keV was chosen as the lower energy bound for the soft band in the analysis. At high energies, we found that the background was greater than or equal to the source counts above 10 keV, so we used 10 keV as the higher energy bound for the hard band in the analysis. The broad energy band used for power spectral analysis and the lag reference band is 3–10 keV so that the results can be reasonably compared to previous RXTE results, and because LF QPOs are typically stronger at higher energies. While the RXTE Proportional Counter Array (PCA) had a lower limit of 2 keV, its effective area varied dramatically in the 2–3 keV band: the NICER XTI is 11 greater in effective area than the PCA at 2 keV and is about equal in effective area compared to the PCA at 2.7 keV. Because the effective area curve weights the energy distribution of the average photon counts, we chose to use 3–10 keV for the broadband analysis.
3 Results
3.1 Source Evolution
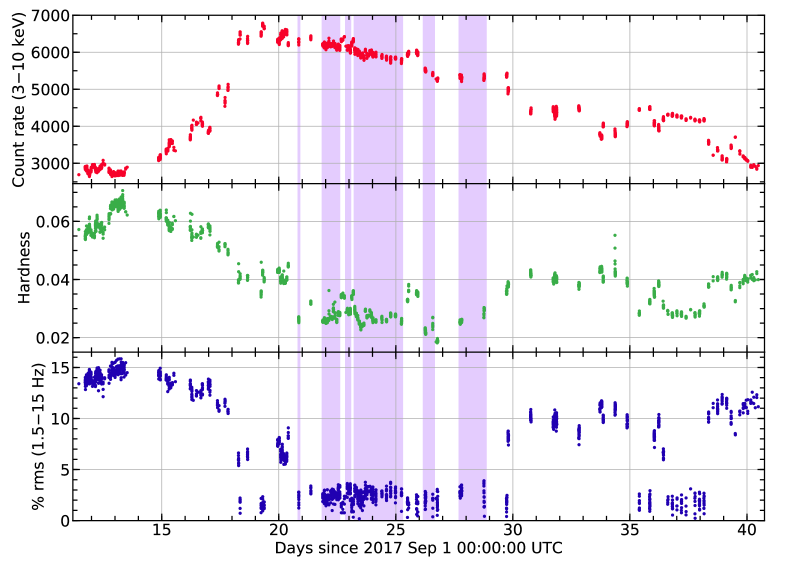
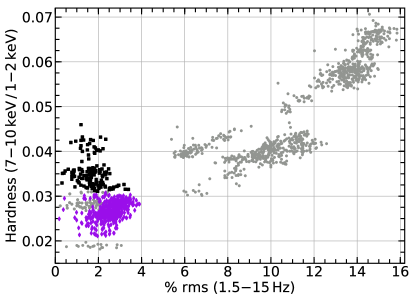
In Figure 1 we show the 3–10 keV count rate, spectral hardness ratio, and fractional rms evolution of MAXI J1535–571 in the early part of its outburst for sequential 64 s segments of the light curve. Detailed study of the power spectral evolution throughout the observations showed that in the periods with high rms ( 5%) and a higher spectral hardness ratio, the power spectrum is dominated by a strong Type C QPO with accompanying broadband noise and a strong harmonic (P.!Uttley et al. 2018, in preparation). Therefore, we identify those data with the hard-intermediate state (see, e.g., Nowak 1995; Homan et al. 2001; Belloni et al. 2005). Here we focus on the observations showing low rms ( 5%) and relatively soft spectra, which do not show strong variability, but still show larger fractional variability amplitudes than the canonical soft states observed in other transient black hole X-ray binaries (rms 3% in 2–20 keV; Belloni et al. 2005; Heil et al. 2015b). We therefore identify these observations with the soft-intermediate state. The 5% rms limit was chosen for our analysis due to the gap in rms between 4% and 5.5% that is visible in the lower panel of Figure 2. The frequency range 1.5–15 Hz was used for the rms computation to encompass some of the broadband noise and the expected LF QPO frequency range without being potentially contaminated by very-low-frequency noise or deadtime effects on the high-frequency Poisson noise. Luckily, as we mention in Section 4, we found that deadtime effects are very minor thanks to NICER’s modular design and high throughput.
3.2 Identifying the LF QPO
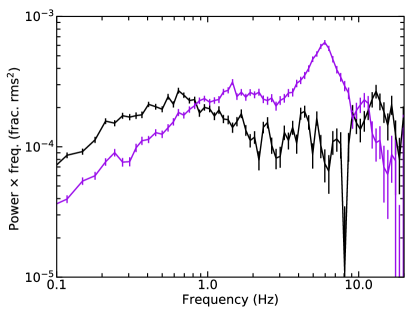
We looked for Type A and B QPOs in the soft-intermediate state observations of this source. These QPOs stand out above the broadband noise in the averaged power spectrum and their frequency tends to stay constant in time for a given flux, which lets us stack segments easily. However, they are only present in a small hardness window within the soft-intermediate spectral state (Motta et al., 2011), and Type B QPOs sometimes appear to sharply turn off and on as a function of time (Belloni et al., 2005). Because QPOs cannot be readily identified in 64 s sections of the weakly-varying soft-intermediate state light curves, we searched for evidence of characteristic timing signatures by sorting the data according to the spectral hardness ratio (the ratio of the 7–10 keV to 1–2 keV count rate). In data from other X-ray binaries, Type A and B QPOs have been known to appear only in narrow ranges of hardness as the system evolves during an outburst (e.g., Belloni 2010). We then selected 64 s segments in a range of hardness ratios and computed the 3–10 keV average power spectrum; this step was repeated sliding the hardness ratio window by 30% increments. This analysis revealed the presence of a fairly broad QPO-like signal at a frequency of 5.7 Hz, which is present for hardness ratios 0.031 but not for harder power spectra (plotted with Poisson noise subtracted in the upper panel of Figure 2).
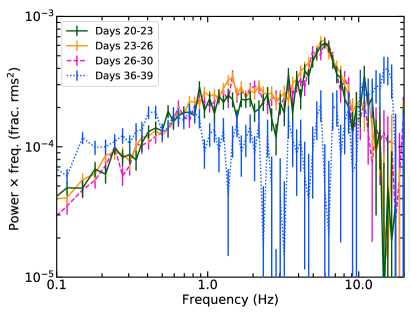
The presence of an 5.7 Hz QPO-like feature can be excluded at a upper limit of Hz-1 in normalization (0.64% in rms) in the averaged power spectrum of the harder segments (see Figure 2). The QPO-like peak seems to shift in frequency and weaken significantly for the lowest hardness ratios ( 0.02), but appears to be relatively stable in frequency over the hardness ratio range 0.021–0.031. We also checked the power spectra in that same hardness range in four different count rate windows that correspond to days 2023, 2326, 2630, and 3539 (with 2017 September 1 as Day 0, as in Figure 1) to assess if the count rate or elapsed time in outburst affected the variability. The Poisson-noise-subtracted power spectra for these four time windows are plotted in Figure 3. The 5.7 Hz QPO-like feature is evident in the first three windows but not in the last window; there, its upper limit in normalization is Hz-1 (1.0% in rms) and there is a stronger possible feature at 12 Hz. Therefore, for the rest of our study we combined the data from 64 s sections, selected in the hardness ratio range 0.021–0.031 with an integrated 1.5–15 Hz rms 5% and a 3–10 keV count rate greater than 5000 counts s-1. We note that the QPO-like feature in Figure 3 appears to be intrinsically broad and stable in frequency for the first three time windows.
There are 428 good 64 s continuous sections of data that fit our spectral hardness, rms, and count rate criteria, which gives a total exposure of 27.392 ks. The average count rate in the 3–10 keV energy band is 5921 count s-1. For the reference energy band used in Section 3.4, which also covers 3–10 keV but uses MPUs 4–6, the average count rate is 2692 count s-1.
3.3 Average Power Spectrum
We computed average power spectra (Figure 4) in the energy band 3–10 keV for the 428 good segments described above, with all XTI MPUs, using our own code333The analysis software and processed data products will be available in the GitHub repository https://github.com/abigailStev/MAXIJ1535_QPO after the publication of this Letter. (see van der Klis 1989 for an overview of Fourier-domain methods). The power spectra were geometrically re-binned in increments of 6% of the frequency. We fitted the power spectra over the range 0.03–128 Hz with four Lorentzians: two model the broadband noise, one the QPO fundamental, and one the weak QPO harmonic. From these fits, we found the , FWHM, and normalization of the Lorentzian components. The Poisson noise was modeled with a power-law with a slope of 1 for fitting . The best-fitting parameter values are listed in Table 1. The errors represent the 90% confidence region computed from the xspec MCMC routine.
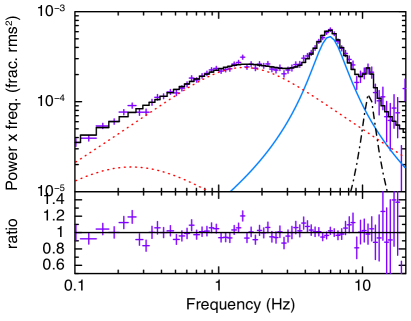
The QPO-like feature has a centroid frequency of Hz. It is relatively broad, and the fitted width is influenced by the bump on the left of the peak at 4 Hz and the scatter on the harmonic at 9 Hz. Thus, we heuristically determined and fixed the quality factor at . The corresponding FWHM of the feature is 2.86 Hz. 444If the FWHM of the QPO is a free-fitting parameter, we find Hz, giving . The QPO-like feature contributes a 3–10 keV rms of 1.9% and a 5–10 keV rms of 2.9%. Although this feature is quite broad compared to Type C QPOs, it is distinct from the broadband noise and possesses a clear — if weak — harmonic. Therefore, we will refer to it as a QPO for the remainder of this Letter. The closest analogy to this feature appears to be the QPOs originally identified by Wijnands et al. (1999) and Homan et al. (2001) as Type A-I and Type A-II QPOs in the black hole transient XTE J1550–564; Type A-I QPOs were later identified by Casella et al. (2005) as a form of Type B QPO.
The Type A-I (later Type B) QPO in XTE J1550–564 has a frequency of 5.9 Hz, a -value of , 3% rms in 2–60 keV, a harmonic at 11 Hz, and it was present in the soft-intermediate state. The Type A-II QPO in XTE J1550–564 has a frequency of 8.5 Hz, a -value of , 2% rms in 2–60 keV, no harmonic, and it was also present in the soft-intermediate state. This MAXI J1535–571 QPO has a similar fundamental frequency and harmonic frequency to the Type A-I, but Q-value and rms more similar to the Type A-II (though it may not be inconsistent with the Type A-I when considering differences in the energy-dependent effective area of the RXTE PCA and NICER). Based on these shared characteristics, the QPO could be a Type A or Type B, so we refer to it as a Type A/B.
| Component | Parameter | Value | Notes |
|---|---|---|---|
| Poisson noise | norm. ( Hz-1) | ||
| BBN1 | FWHM (Hz) | ||
| BBN1 | (Hz) | [1] | |
| BBN1 | norm. ( Hz-1) | ||
| BBN2 | FWHM (Hz) | ||
| BBN2 | (Hz) | ||
| BBN2 | norm. ( Hz-1) | ||
| QPO | FWHM (Hz) | 2.86 | [2] |
| QPO | (Hz) | ||
| QPO | norm. ( Hz-1) | ||
| Harmonic | FWHM (Hz) | ||
| Harmonic | (Hz) | ||
| Harmonic | norm. ( Hz-1) |
3.4 Lag-energy Spectrum
The lag-energy spectrum, computed from the average cross spectrum, measures by how much the variability in many narrow energy bands leads or lags the variability in a broad ‘reference’ energy band (see Uttley et al. 2014 for an overview of lag-energy spectra with examples and recipes). To ensure that the narrow-band and broad reference band light curves are truly independent, we use the detector information stored in the event lists as a selection criterion. We used MPUs 0–3 (inclusive) when extracting narrow bands and MPUs 4–6 (inclusive) for extracting the reference band. This division of MPUs was chosen to optimize the signal-to-noise in the narrow bands while maintaining enough signal in the reference band. As noted in Section 2, we removed FPMs 11, 14, 20, 22, 34, and 60, so that there are 50 total FPMs: 27 were used for the channels of interest, and 23 for the reference band. To further improve signal-to-noise, we binned coarser than the intrinsic energy resolution of the data and achieved 50 narrow-band ‘channels of interest’ across the energy range 1–10 keV. The channels of interest are approximately equally spaced on a log scale (see Figure 5).
To compare the lag-energy spectra of the broadband noise and the QPO components, cross-spectra were averaged and resulting phase and time-lags calculated across three integrated frequency ranges: 0.1–2.0 Hz (intrinsic broadband noise), 4.29–7.15 Hz (QPO), and 9.6–12.6 Hz (harmonic). The frequency ranges used for the QPO and harmonic were chosen to be the FWHM centered on the centroid for the fitted Lorentzian model in the power spectrum (Table 1; Figure 4). The lag-energy spectra for the broadband noise and QPO are shown in Figure 5.
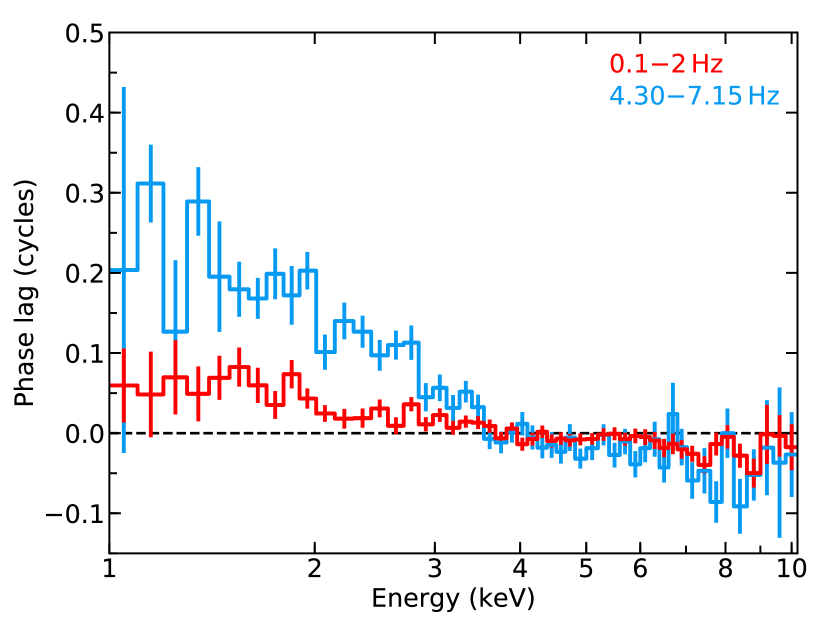
The broadband noise lags show a “soft lag,” in which the variability at softer energies lags behind the variability at harder energies. The QPO lags also show a definitive soft lag shape, with a flattening above 4 keV.
The shape of the QPO lag-energy spectrum is reminiscent of the inflected lag-energy spectrum shape (like a broken log-linear shape) observed for the Type B QPO of GX 339–4 (Stevens & Uttley, 2016), but with the opposite sign of lags. We note for completeness that we also computed the lags over the same frequency range of the segments that were excluded due to their hardness values, as a check that this soft lag is due to the presence of the QPO. While it is not possible to say much about lag features due to signal-to-noise limitations, the lag-energy spectrum does not appear to follow the same trends. The harmonic lag-energy spectrum, computed for the frequency range 9.612.6 Hz, has better signal-to-noise than the power spectrum of the harder segments (black points in Figure 2), but still has larger error bars than the QPO lag-energy spectrum. There is significant scatter and it does not show any trends or features.
4 Discussion and Conclusion
We have reported the discovery and initial spectral-timing analysis of a QPO feature in the soft-intermediate state of the 2017–2018 outburst of the new candidate black hole transient MAXI J1535–571. This QPO has a centroid frequency of Hz and is relatively broad (Q 2). It is also weak, with an integrated fractional rms of 1.9% in 3–10 keV and 2.9% in 5–10 keV. The QPO shows large soft lags with respect to the 3–10 keV reference band of about 29% of a QPO cycle at 1.3 keV ( 50 ms), and the broadband noise shows 5% phase lags at 1.3 keV (also 50 ms). The broadband noise shows a smoother lag-energy spectrum compared to the inflected shape of the QPO lag-energy spectrum. The QPO lags noticeably flatten above 4 keV.
Soft lags (i.e., positive at softer energies) are also observed for the similar QPOs in XTE J1550–564, albeit across the harder energy range 2–48 keV (Wijnands et al., 1999). The lags that we see are approximately of the same magnitude and the same sign as the lags in Wijnands et al. (1999) when comparing the overlapping energy range of NICER and RXTE.
The QPO analyzed in this Letter has some notable differences with the clear Type B QPO in GX 339–4 analyzed with lag-energy spectra and phase-resolved spectroscopy in Stevens & Uttley (2016). There, the QPO had a fractional rms of 14% in 5–10 keV, and the broadband noise was much weaker relative to the QPO, but larger in normalization than we see here. The QPO also showed hard lags of about 10 ms ( 30% in normalized phase). It is notable that the inflected shapes of the lag-energy spectra observed in MAXI J1535–571 and GX 339–4 are similar, but with opposite sign. The inflection may be due to the phase offset between sinusoidally varying spectral components, as shown in simulations in Stevens & Uttley (2016) and Stevens (2018). Thus the inflected shape of the lag-energy spectrum in MAXI J1535–571 would then be linked to a phase offset between the peaks in power-law emission and the modulation of the disk blackbody spectrum, where the disk component would lag rather than lead the power-law emission. In GX 339–4 we inferred that there was a large 30% phase shift from spectral fitting of the Wien tail, while with NICER data of MAXI J1535–571 we can probe low-enough energies to measure this lag directly.
The proposed mechanism for the Type B QPO in GX 339–4 was a large-scale-height precessing power-law emitting region such as the base of the jet (Stevens & Uttley, 2016). There, the phase lead of the disk relative to power-law variations in GX 339–4 was attributed to a geometry where the approaching side of the disk is illuminated by the jet base, leading to enhanced (blue-shifted) disk emission, before the jet base points toward the observer leading to enhanced power-law emission (e.g., due to beaming effects, optical depth effects, and other aspects of the jet emission mechanism). GX 339–4 is probably a low-inclination system,555The binary inclination angle of GX 339–4 has been constrained to from X-ray (Zdziarski et al., 1998) and optical (Heida et al., 2017) observations. Recent spectral analysis by Wang-Ji et al. (2018) estimates from spectral modeling. while MAXI J1535–571 may be a high-inclination system (suggested by spectral fits of the iron line in the hard-intermediate state; Xu et al. 2018; Miller et al. 2018). The opposite lag sign in MAXI J1535–571 could then suggest that the maximum in power-law emission is seen when the jet is pointing away from the observer (e.g., if solid angle effects dominate over beaming effects for the expected larger offset of the jet axis to the line of sight).
We also note that XTE J1550–564, which shows LF QPOs with similar properties to those seen in MAXI J1535–571, is a high-inclination (more edge-on) source (; Orosz et al. 2011) with the jet and binary axes in alignment (Steiner & McClintock, 2012). However, XTE J1550–564 also shows “normal” Type B QPOs (Homan et al., 2001) that show the same lag sign as in GX 339–4 (i.e., opposite to what the same source shows for the different Type A QPOs; Remillard et al. 2002). This suggests that the sign of the lag may instead (or also) be due to the scale height of the emitting region, which then affects whether optical depth effects are important when considering whether the power-law flux variation lags or leads the soft flux variation. The changing sign of the lag in the same source is then linked to a change in the geometry (scale height) of the emitting region (as it is not possible for the inclination of a source to rapidly change). The sign of the lag in MAXI J1535–571, and the time lag being 50 ms for both the QPO and the broadband noise, could therefore mean that there is a compact, self-interacting emitting region that strongly couples the broadband noise lag to the QPO lag. Our hypothesis on the emission region and mechanism for this QPO will be rigorously tested in a follow-up paper using phase-resolved spectroscopy analysis as in Stevens & Uttley (2016) and Stevens (2018). It is possible that MAXI J1535–571 also exhibited a “normal” Type B QPO with a higher -value and higher rms, and it was missed by NICER due to a lengthy Sun-avoidance data gap in winter 2017–2018.
It is interesting to note that the fitted Poisson noise level in Section 3.3 is only 1% lower than that expected from the mean count rate (noise level of in units of fractional rms2 Hz-1). Poisson noise levels are reduced by instrumental deadtime effects, which suppress the observed noise variance due to the resulting (anti-)correlations between successive photon counts. The data show that the fraction of photons lost to deadtime in the NICER detectors is indeed remarkably small for such a bright source ( 16,000 counts s-1 for the whole bandpass).
Finally, we note that these observations highlight the enormous potential of NICER for transforming our understanding of accreting compact objects via spectral-timing methods. At the peak flux levels of the soft-intermediate state of MAXI J1535–571, the total NICER count rate exceeded 16,000 count s-1, with very little deadtime and hence minimal spectral distortion. Furthermore, these large phase lags would not have been observable by the RXTE PCA due to the cut off in response below 3 keV. The combination of such large count rates with good energy resolution and a soft X-ray response is a revolutionary capability. NICER points the way to a bright future for our understanding of the innermost regions of accreting compact objects.
References
- Arnaud (1996) Arnaud, K. A. 1996, in Astronomical Society of the Pacific Conference Series, Vol. 101, Astronomical Data Analysis Software and Systems V, ed. G. H. Jacoby & J. Barnes, 17
- Arzoumanian et al. (2014) Arzoumanian, Z., Gendreau, K. C., Baker, C. L., et al. 2014, in Proc. SPIE, Vol. 9144, Space Telescopes and Instrumentation 2014: Ultraviolet to Gamma Ray, 914420
- Astropy Collaboration et al. (2013) Astropy Collaboration, Robitaille, T. P., Tollerud, E. J., et al. 2013, A&A, 558, A33
- Belloni et al. (2005) Belloni, T., Homan, J., Casella, P., et al. 2005, A&A, 440, 207
- Belloni (2010) Belloni, T. M. 2010, States and Transitions in Black Hole Binaries, 53
- Britt et al. (2017) Britt, C. T., Bahramian, A., & Strader, J. 2017, ATel , 10816, ads
- Casella et al. (2005) Casella, P., Belloni, T., & Stella, L. 2005, ApJ, 629, 403
- Dincer (2017) Dincer, T. 2017, ATel , 10716, ads
- Gendreau et al. (2017) Gendreau, K., Arzoumanian, Z., Markwardt, C., et al. 2017, ATel , 10768, ads
- Gendreau et al. (2012) Gendreau, K. C., Arzoumanian, Z., & Okajima, T. 2012, in Proc. SPIE, Vol. 8443, Space Telescopes and Instrumentation 2012: Ultraviolet to Gamma Ray, 844313
- Heida et al. (2017) Heida, M., Jonker, P. G., Torres, M. A. P., & Chiavassa, A. 2017, ApJ, 846, 132
- Heil et al. (2015a) Heil, L. M., Uttley, P., & Klein-Wolt, M. 2015a, MNRAS, 448, 3348
- Heil et al. (2015b) Heil, L. M., Uttley, P., & Klein-Wolt, M. 2015b, MNRAS, 448, 3339
- Homan et al. (2001) Homan, J., Wijnands, R., van der Klis, M., et al. 2001, ApJS, 132, 377
- Hunter (2007) Hunter, J. D. 2007, CSE , 9, 90
- Keek et al. (2018) Keek, L., Arzoumanian, Z., Bult, P., et al. 2018, ApJ, 855, L4
- Kennea (2017) Kennea, J. A. 2017, ATel , 10731, ads
- Kennea et al. (2017) Kennea, J. A., Evans, P. A., Beardmore, A. P., et al. 2017, ATel , 10700, ads
- Ludlam et al. (2018) Ludlam, R. M., Miller, J. M., Arzoumanian, Z., et al. 2018, ApJ, 858, L5
- Markwardt et al. (2017) Markwardt, C. B., Burrows, D. N., Cummings, J. R., et al. 2017, GRB Coordinates Network , 21788, ads
- Mereminskiy & Grebenev (2017) Mereminskiy, I. A., & Grebenev, S. A. 2017, ATel , 10734, ads
- Miller et al. (2018) Miller, J. M., Gendreau, K., Ludlam, R. M., et al. 2018, ApJ, 860, L28
- Motta et al. (2011) Motta, S., Muñoz-Darias, T., Casella, P., Belloni, T., & Homan, J. 2011, MNRAS, 418, 2292
- Motta et al. (2015) Motta, S. E., Casella, P., Henze, M., et al. 2015, MNRAS, 447, 2059
- Nakahira et al. (2017) Nakahira, S., Negoro, H., Mihara, T., et al. 2017, ATel , 10729, ads
- Negoro et al. (2017a) Negoro, H., Kawase, T., Sugizaki, M., et al. 2017a, ATel , 10708, ads
- Negoro et al. (2017b) Negoro, H., Ishikawa, M., Ueno, S., et al. 2017b, ATel , 10699, ads
- Negoro et al. (2018) Negoro, H., Mihara, T., Nakahira, S., et al. 2018, ATel, 11568, ads
- Nowak (1995) Nowak, M. A. 1995, PASP, 107, 1207
- Orosz et al. (2011) Orosz, J. A., Steiner, J. F., McClintock, J. E., et al. 2011, ApJ, 730, 75
- Palmer et al. (2017) Palmer, D. M., Krimm, H. A., & Swift/BAT Team. 2017, ATel , 10733, ads
- Parikh et al. (2018) Parikh, A. S., Russell, T. D., Wijnands, R., et al. 2018, ATek s , 11652, ads
- Remillard et al. (2002) Remillard, R. A., Sobczak, G. J., Muno, M. P., & McClintock, J. E. 2002, ApJ, 564, 962
- Russell et al. (2017a) Russell, T. D., Altamirano, D., Tetarenko, A. J., et al. 2017a, ATel , 10899, ads
- Russell et al. (2018) Russell, T. D., Altamirano, S. R. D., Miller-Jones, J. C. A., et al. 2018, The Astronomer’s Telegram , 11611, ads
- Russell et al. (2017b) Russell, T. D., Miller-Jones, J. C. A., Sivakoff, G. R., Tetarenko, A. J., & Jacpot Xrb Collaboration. 2017b, ATel , 10711, ads
- Scaringi & ASTR211 Students (2017a) Scaringi, S., & ASTR211 Students. 2017a, ATel , 10702, ads
- Scaringi & ASTR211 Students (2017b) Scaringi, S., & ASTR211 Students. 2017b, ATel , 10704, ads
- Schnittman et al. (2006) Schnittman, J. D., Homan, J., & Miller, J. M. 2006, ApJ, 642, 420
- Shidatsu et al. (2017a) Shidatsu, M., Nakahira, S., Negoro, H., et al. 2017a, ATel , 11020, ads
- Shidatsu et al. (2017b) Shidatsu, M., Nakahira, S., Negoro, H., et al. 2017b, ATel , 10761, ads
- Steiner & McClintock (2012) Steiner, J. F., & McClintock, J. E. 2012, ApJ, 745, 136
- Stevens (2018) Stevens, A. L. 2018, PhD thesis, Universiteit van Amsterdam (Netherlands)
- Stevens & Uttley (2016) Stevens, A. L., & Uttley, P. 2016, MNRAS, 460, 2796
- Stiele et al. (2013) Stiele, H., Belloni, T. M., Kalemci, E., & Motta, S. 2013, MNRAS, 429, 2655
- Tetarenko et al. (2017) Tetarenko, A. J., Russell, T. D., Miller-Jones, J. C. A., Sivakoff, G. R., & Jacpot Xrb Collaboration. 2017, ATel , 10745, ads
- Uttley et al. (2014) Uttley, P., Cackett, E. M., Fabian, A. C., Kara, E., & Wilkins, D. R. 2014, A&A Rev., 22, 72
- van den Eijnden et al. (2017) van den Eijnden, J., Ingram, A., Uttley, P., et al. 2017, MNRAS, 464, 2643
- van der Klis (1989) van der Klis, M. 1989, in NATO Advanced Science Institutes (ASI) Series C, Vol. 262, NATO Advanced Science Institutes (ASI) Series C, ed. H. Ögelman & E. P. J. van den Heuvel, 27
- Vaughan et al. (1994) Vaughan, B., van der Klis, M., Lewin, W. H. G., et al. 1994, ApJ, 421, 738
- Vaughan & Nowak (1997) Vaughan, B. A., & Nowak, M. A. 1997, ApJ, 474, L43
- Vignarca et al. (2003) Vignarca, F., Migliari, S., Belloni, T., Psaltis, D., & van der Klis, M. 2003, A&A, 397, 729
- Wang-Ji et al. (2018) Wang-Ji, J., García, J. A., Steiner, J. F., et al. 2018, ApJ, 855, 61
- Wijnands et al. (1999) Wijnands, R., Homan, J., & van der Klis, M. 1999, ApJ, 526, L33
- Xu et al. (2018) Xu, Y., Harrison, F. A., García, J. A., et al. 2018, ApJ, 852, L34
- Zdziarski et al. (1998) Zdziarski, A. A., Poutanen, J., Mikolajewska, J., et al. 1998, MNRAS, 301, 435