The Broad Absorption Line Tidal Disruption Event iPTF15af: Optical and Ultraviolet Evolution
Abstract
We present multiwavelength observations of the tidal disruption event (TDE) iPTF15af, discovered by the intermediate Palomar Transient Factory (iPTF) survey at redshift . The optical and ultraviolet (UV) light curves of the transient show a slow decay over five months, in agreement with previous optically discovered TDEs. It also has a comparable black-body peak luminosity of erg s-1. The inferred temperature from the optical and UV data shows a value of (35) K. The transient is not detected in X-rays up to erg s-1 within the first five months after discovery. The optical spectra exhibit two distinct broad emission lines in the He ii region, and at later times also H emission. Additionally, emission from [N iii] and [O iii] is detected, likely produced by the Bowen fluorescence effect. UV spectra reveal broad emission and absorption lines associated with high-ionization states of N v, C iv, Si iv, and possibly P v. These features, analogous to those of broad absorption line quasars (BAL QSOs), require an absorber with column densities cm-2. This optically thick gas would also explain the non-detection in soft X-rays. The profile of the absorption lines with the highest column density material at the largest velocity is opposite that of BAL QSOs. We suggest that radiation pressure generated by the TDE flare at early times could have provided the initial acceleration mechanism for this gas. Spectral UV line monitoring of future TDEs could test this proposal.
1 Introduction
Most of the galaxies in our nearby Universe contain a supermassive black hole (SMBH) at their cores (Kormendy & Richstone, 1995). Occasionally, accretion of gas in the vicinity of the SMBH reveals its presence as an active galactic nucleus (AGN). However, a large fraction of SMBHs appear to be dormant, as their activity is not directly revealed through observations in the electromagnetic spectrum. Sometimes the disruption of a star in the vicinity of the SMBH – a tidal disruption event (TDE) – will produce a bright flare, detectable at multiple wavelengths. This new energy release episode will shed light onto these otherwise quiescent SMBHs, allowing us to study in more detail their characteristics, such as their masses (Mockler et al., 2018) or spin distributions (Stone et al., 2018). In addition, the shocks, circularization, and accretion of the stellar debris onto the SMBH can reveal clues to better understand the more stable AGN activity or the unusual behaviour of variable quasars (LaMassa et al., 2015).
According to theory, flares from TDEs were expected to originate in the innermost regions of the accretion disks (Rees, 1988), which translate into soft X-ray emission and extreme ultraviolet (UV) emission. Consequently, searches for TDEs in archival data started in X-rays using the ROentgen SATellite (ROSAT) and the XMM-Newton Slew Survey (Bade et al., 1996; Komossa & Bade, 1999; Saxton et al., 2012). Subsequently, transient UV emission was also associated with activity produced by stellar disruptions (Gezari et al., 2006, 2008), and the search progressed at optical (van Velzen et al., 2011; Arcavi et al., 2014), gamma ray, and radio wavelengths (Bloom et al., 2011; Burrows et al., 2011; Cenko et al., 2012). Currently, optical transient surveys are the most active discovery tool, with a total of optical TDE candidates reported to date111Based on reports to the TDE Open Catalogue https://tde.space.
The majority of recent optical TDE discoveries were monitored in the UV using broad-band photometry with the Neil Gehrels Swift Observatory (Swift; Gehrels et al., 2004). The sample has shown significantly higher temperature in the continuum than supernovae, with K (see sample in Hung et al. (2017)), suggesting that the bulk of the energy was released in the UV, inaccessible to ground-based telescopes. To date, restframe UV spectra of only five TDEs have been published, including the object discussed herein. While the optical spectra of these events are usually marked by He ii, He i, and occasionally H broad emission lines (Holoien et al., 2016b; Blagorodnova et al., 2017), far-UV spectroscopy of ASASSN14li (Cenko et al., 2016), iPTF16fnl (Brown et al., 2018), and iPTF15af (also published in Yang et al., 2017) have shown the presence of broad collisionally excited lines of Ly, C iv, N v, and Si iv. In contrast, low ionization lines of Fe ii and Mg ii dominated the UV spectra for PS1-11af (Chornock et al., 2014) and PS16dtm (Blanchard et al., 2017). The observed diversity suggests that UV wavelengths are especially relevant for characterizing the geometry, density, and kinematics of the stellar debris and pre-existing circumnuclear material.
Here we present the discovery and follow-up observations at optical, UV, mid-infrared, X-ray, and radio wavelengths of iPTF15af, a TDE discovered by the intermediate Palomar Transient Factory (iPTF; Rau et al., 2009) survey at redshift . We show that the photometric and spectroscopic evolution of this event resembles other tidal disruption flares reported to date. The broad absorption component observed in the UV spectrum suggests the presence of high-velocity outflows, similar to the ones observed in broad absorption line quasars (BAL QSOs).
Section 2 describes the discovery, the host galaxy, and our multiwavelength follow-up observations. Sections 3 and 4 describe the photometric and spectroscopic analysis of the object. In Section 5 we compare the UV spectra of iPTF15af to those of other TDEs and QSOs. In Section 6 we summarize our conclusions.
In this work, we assume a flat cosmology and values of H0 = 70 km s-1 Mpc-1 and , .
2 Discovery and Observations
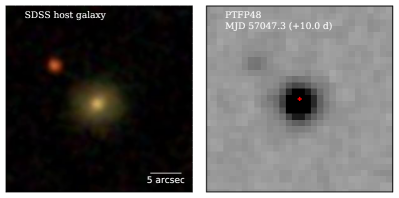
iPTF15af was discovered by the iPTF survey on UTC 2015 January 15.3 (MJD 57037.3). The object was detected in three of the five difference images taken on that night. The average AB magnitude (Oke & Gunn, 1983) measured by the pipeline (Masci et al., 2017) was in the iPTF Mould band. Stacked forced photometry allowed us to recover the transient in archival data at 25 days prior to its discovery in single-epoch images.
The central location of the transient in its host galaxy (see Figure 1) awarded the transient multiwavelength follow-up observations and a spectroscopic classification a week later. The spectrum confirmed the presence of strong He II lines, characteristic of an optical TDE candidate (Gezari et al., 2012; Arcavi et al., 2014).
From the averaged positions of the residuals in the band, we derive the location of the transient to be , (J2000), with a standard deviation in both coordinates of mas. This position is offset from the central location of the galaxy core by 230 mas, which is consistent with the nucleus of the galaxy within 2. The Milky Way extinction along the line of sight is mag (Schlafly & Finkbeiner, 2011).
2.1 Host Galaxy
The transient’s host galaxy SDSS J084828.13+220333.4 is located inside of the footprint of SDSS DR12 (Alam et al., 2015). An archival spectrum of the host was obtained on MJD 53379 as part of the SDSS spectroscopic survey. We do not identify major lines associated with star formation or AGNs. The spectroscopic redshift of the galaxy is , which corresponds to a luminosity distance Mpc (distance modulus mag).
Archival photometry of the host is provided in Table 1. The limit for the GALEX far-ultraviolet (FUV) band was obtained from synthetic photometry of the best-fit galaxy model from the Bruzual & Charlot (2003) spectral library. The spectrum was reddened and normalized to the SDSS -band measurement.
Literature modeling analysis of the light profile of the galaxy shows that the values derived for its bulge-to-total light ratios are and in the and bands, respectively (Simard et al., 2011). The stellar mass for the host and its bulge, log and log , show that % of the mass is concentrated in the bulge of the galaxy (Mendel et al., 2014). Galaxies with enhanced stellar density cores are common among TDE hosts (Graur et al., 2018), showing unusually high values (Law-Smith et al., 2017). High-resolution spectroscopy of the galaxy has allowed us to measure the velocity dispersion in the host, leading to an estimate of log (Wevers et al., 2017).
The low specific star formation rate (sSFR) of the host, log (Chang et al., 2015) shows that at the present time the galaxy is not actively forming stars. However, further analysis reveals that the host experienced a short ( Myr) burst of star formation Myr ago (French et al., 2017). However, this burst could account for only a small fraction of the mass (5%).
Since 2005, the host galaxy of the transient has been continuously monitored by the Catalina Real-time Transient Survey (CRTS; Drake et al., 2009). During these last yr, the host galaxy is well detected with an average magnitude of , which appears constant within the errors. Nuclear activity is also unlikely, as inferred from the quiescent mid-infrared (mid-IR) Wide-field Infrared Survey Explorer (WISE; Wright et al., 2010) color , away from the locus determined by (Stern et al., 2012). Based on the lack of AGN features in the spectrum, the lack of variability, and no mid-IR excess, we can rule out previous AGN activity in the host at least yr before the discovery of the source.
| Survey | Band | Magnitude | Reference |
|---|---|---|---|
| (mag) | |||
| GALEX | FUVAB | 24.6 a | [1] |
| GALEX | NUVAB | 24.02 0.48 b | [1] |
| SDSSDR12 | 20.286 0.084 c | [2] | |
| SDSSDR12 | 18.520 0.010 c | [2] | |
| SDSSDR12 | 17.606 0.007 c | [2] | |
| SDSSDR12 | 17.186 0.008 c | [2] | |
| SDSSDR12 | 16.883 0.019 c | [2] | |
| 2MASS | 16.433 0.132 d | [3] | |
| 2MASS | 15.671 0.148 d | [3] | |
| 2MASS | 15.547 0.175 d | [3] | |
| WISE | W1 | 14.809 0.033 d | [4] |
| WISE | W2 | 14.632 0.068 d | [4] |
| WISE | W3 | 12.309 d | [4] |
| WISE | W4 | 8.681 d | [4] |
| NVSS | 1.4 GHz | 1.8 mJy | [5] |
| ROSAT | 0.12.4 keV | 3.9 erg s-1 | [6] |
2.2 Ground-Based Photometry
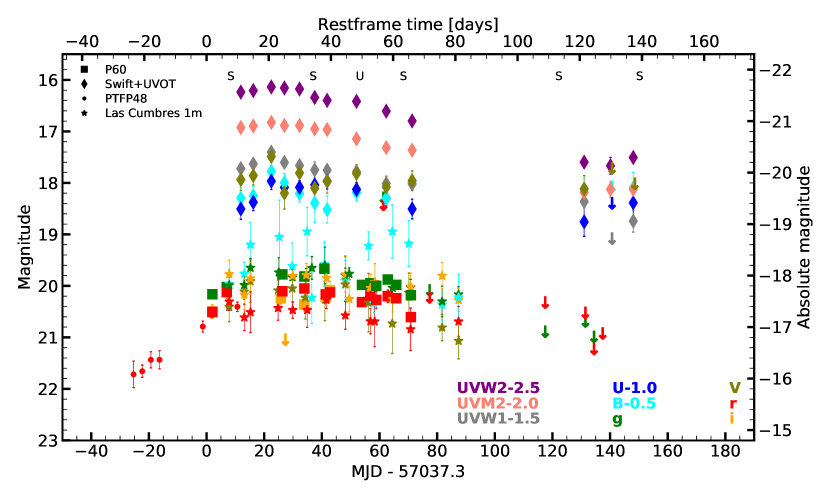
After its discovery, the transient was simultaneously monitored for 3 months in the band with the Palomar 48-inch telescope (P48) and in the bands with the Palomar 60-inch telescope (P60). The P48 data reduction is described by Laher et al. (2014), while the photometric calibration and the system is discussed by (Ofek et al., 2012). The difference-image photometric measurements were obtained with PTFIDE (Masci et al., 2017) and FPipe (Fremling et al., 2016) for P48 and P60, respectively. The zeropoints were calibrated using the SDSS DR13 catalogue (SDSS Collaboration et al., 2016). Simultaneously, we also obtained follow-up photometry in the BVgri bands with Las Cumbres Observatory’s 1 m telescope in Texas (Brown et al., 2013). The point-spread-function (PSF) photometry was obtained using lcogtsnpipe (Valenti et al., 2016), which is calibrated to the APASS 9 (Henden et al., 2016) and SDSS DR13 catalogs for BV and gri, respectively. Deeper, prediscovery photometric measurements were obtained by combining the flux from all available nightly sets of five images. The photometric evolution of iPTF15af is shown in Figure 2 and the difference-imaging measurements are available as part of Table 2.
The first noticeable characteristic of this event is its slow evolution in the UV and optical bands. Since our first detections in , there is a slow brightening by mag on a timescale of 30 days. After that, the optical bands reach a plateau phase, lasting months. The observed apparent magnitudes at peak (around MJD 57370) are mag and mag, corresponding to absolute magnitudes (corrected for foreground extinction) of mag and mag. Because of the faint apparent magnitude of the object, our follow-up observations are non-detections in the optical bands after the fourth month; apparently, by that time the transient had faded below mag in and 22 in .
| MJD | Phaseb | Telescope | |||||||||
|---|---|---|---|---|---|---|---|---|---|---|---|
| (days) | (days) | + Instrument | (mag) | (mag) | (mag) | (mag) | (mag) | (mag) | (mag) | (mag) | (mag) |
| 56664.0 | 373.3 | PTFP48 | – | – | – | – | – | – | – | 23.29 | – |
| 56667.0 | 370.3 | PTFP48 | – | – | – | – | – | – | – | 22.20 | – |
| 56670.0 | 367.3 | PTFP48 | – | – | – | – | – | – | – | 20.47 | – |
| 56769.0 | 268.3 | PTFP48 | – | – | – | – | – | – | – | 21.89 | – |
| 57012.0 | 25.3 | PTFP48 | – | – | – | – | – | – | – | 21.790.26 | – |
| 57015.0 | 22.3 | PTFP48 | – | – | – | – | – | – | – | 21.730.12 | – |
| 57018.0 | 19.3 | PTFP48 | – | – | – | – | – | – | – | 21.510.16 | – |
| 57021.0 | 16.3 | PTFP48 | – | – | – | – | – | – | – | 21.510.18 | – |
| 57036.0 | 1.3 | PTFP48 | – | – | – | – | – | – | – | 20.870.11 | – |
| 57039.3 | 2.0 | P60+SEDM | – | – | – | – | – | – | 20.270.06 | 20.580.10 | 20.550.14 |
| 57039.0 | 1.7 | PTFP48 | – | – | – | – | – | – | – | 20.640.05 | – |
| 57044.3 | 7.0 | P60+SEDM | – | – | – | – | – | – | 20.130.07 | 20.200.12 | 20.20 |
| … | … | … | … | … | … | … | … | … | … | … |
aThe -band column for the P48 contains measurements in the Mould- filter system. These data are not corrected for Galactic extinction. Table 2 is published in its entirety in machine-readable format. A portion is shown here for guidance regarding its form and content.b The phase is respect to the date of discovery MJD 57037.3.
2.3 Swift Photometry
Following the optical discovery of iPTF15af, we initiated follow-up observations with the Ultra-Violet Optical Telescope (UVOT; Roming et al., 2005) on the Swift satellite. The data were obtained in three successive campaigns in all 6 UVOT filters. We used the software package UVOTSOURCE to obtain the counts of the source within a aperture radius. The background was computed from an off-target sky region using an aperture of . The magnitudes were derived using the latest UVOT calibration (Poole et al., 2008; Breeveld et al., 2010). The aperture magnitude measurements are listed in Table 2.
The evolution of the Swift photometry is shown in Figure 2. While the reddest bands, with higher contamination from host-galaxy light, follow the plateau observed in the optical bands, the UV bands and show a declining trend after 50 days, which places an approximate date of the peak at days after discovery in the rest frame of the source (around MJD 57077.3). We note that, while at later times the UV emission has considerably faded, our measurements are still 4 mag brighter than the archival ones reported by GALEX. The flattening of UV emission at late times is consistent with the trend observed for a sample of optical TDEs, observed 5–10 yr after the flare (van Velzen et al., 2018).
2.4 Optical Spectroscopy
Optical spectra were obtained with the Low Resolution Imaging Spectrometer (LRIS; Oke et al., 1995) on the Keck I 10 m telescope and were reduced using the automated reduction pipeline in IDL lpipe222http://www.astro.caltech.edu/~dperley/programs/lpipe.html, developed by D. Perley.
The full spectral log is provided in Table 3. Upon the publication of the article, all spectra will be made publicly available via the WISeREP repository (Yaron & Gal-Yam, 2012).
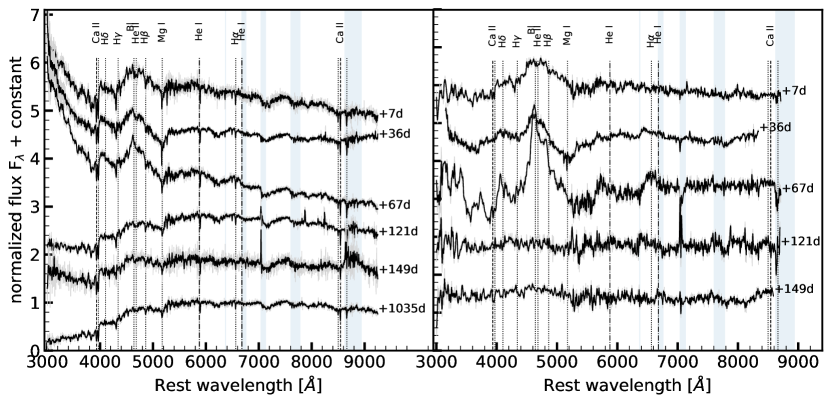
The spectral evolution of the event from +7 days to +149 days after discovery is shown in the left panel of Figure 3. In order to optimize the host-galaxy subtraction, we used the same configuration to obtain a late-time spectrum of the host at +1035 days after discovery, when the TDE contribution was completely gone. Visual inspection of our spectrum at +149 days after discovery confirms that for that epoch, there was still significant residual flux from the transient.
| Phaseb | MJD | UTC | Telescope | P.A. | Exposure |
|---|---|---|---|---|---|
| (d) | (d) | +Instrument | (deg) | (s) | |
| +7 | 57044.5 | 2015-01-22 11:38:56 | Keck I+LRIS | 105 | 1240 |
| +36 | 57073.5 | 2015-02-20 12:59:35 | Keck I+LRIS | 268 | 600 |
| +67 | 57104.3 | 2015-03-23 07:16:37 | Keck I+LRIS | 230 | 820 |
| +121 | 57158.3 | 2015-05-16 06:17:20 | Keck I+LRIS | 87 | 1200 |
| +149 | 57186.3 | 2015-06-13 06:11:08 | Keck I+LRIS | 270 | 610 |
| +1035 | 58072.6 | 2017-11-15 13:33:51 | Keck I+LRIS | 272 | 1160 |
aAll observations were conducted with a combination of grism 400/3400 and grating 400/8500, and a long 1′′-wide slit, providing a resolution of Å. bThe phase is relative to discovery date with MJD 57037.3.
2.5 UV Spectroscopy
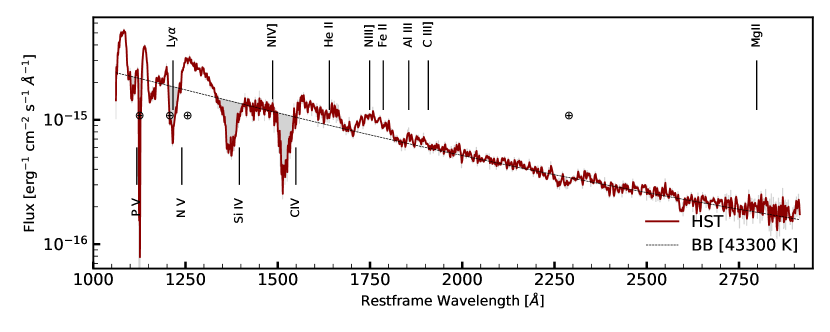
UV spectroscopy of iPTF15af was obtained (PI S. B. Cenko, proposal GO-13853) with the Space Telescope Imaging Spectrometer (STIS) on the Hubble Space Telescope (HST) on UTC 2015 March 08.1 (MJD 57089.1), at 52 days after discovery. The combined data from the far-UV (FUV) and the near-UV (NUV) MAMA detectors provide coverage in the 1145–3145 Å range. The spectrum is represented in Figure 4 and the log of the UV observations is provided in Table 4.
| UTC | Grating | Scale | Res. power | Exposure |
|---|---|---|---|---|
| (Å pix-1) | () | (s) | ||
| 2015-03-08 01:12:13 | G230L | 1.58 | 5001010 | 2130.0 |
| 2015-03-08 02:32:38 | G230L | 1.58 | 5001010 | 2922.0 |
| 2015-03-08 04:08:06 | G140L | 0.60 | 9601440 | 2922.0 |
| 2015-03-08 05:43:35 | G140L | 0.60 | 9601440 | 2922.0 |
| 2015-03-08 07:19:03 | G140L | 0.60 | 9601440 | 2922.0 |
aSTIS instrument and FUV-MAMA and NUV-MAMA detectors. All measurements were taken with slit 52X0.2.
Given the good signal-to-noise ratio (S/N) of the trace in the two-dimensional images, we used the one-dimensional spectra output by the HST pipeline. The spectra from each detector were combined using an inverse-variance-weighted average of the one-dimensional spectra.
2.6 X-Rays
We used the X-Ray Telescope (XRT; Burrows et al. 2005) onboard the Swift satellite to observe iPTF15af in the 0.3–10.0 keV bandpass using the photon counting (PC) mode. The observations, with typical exposure times of ks, were taken simultaneously with the UVOT exposures. The single-epoch data only yielded non-detections, with an average 3 upper limit of counts s-1 in this bandpass.
We measured the flux assuming that the source spectrum follows a power law with a photon index of , and a line-of-sight absorption in the Milky Way of cm-2 (Willingale et al., 2013). Our count rate corresponds to an upper limit for the unabsorbed flux of erg cm-2 s-1 in the 0.3–10.0 keV bandpass. At the distance of iPTF15af, this value translates to an upper limit on the X-ray luminosity of erg s-1.
The total flux from the source in the stacked image of 33 ks was estimated using the 99.7% Bayesian confidence interval (Kraft et al., 1991), encoded in the astropy Python package (assuming only a non-negativity prior). We used the exposure-weighted correction factor provided by the Swift XRT pipeline to calculate the total of number of counts. The 3 level is counts s-1, corresponding to an upper limit for the luminosity of erg s-1 in the Swift band.
When comparing the X-ray luminosity of iPTF15af to that of other BAL QSOs, we first used the UV spectrum to derive the UV/X-ray luminosity relation, quantified by the parameter (Avni & Tananbaum, 1982; Just et al., 2007),
| (1) |
where (2 keV) is the monochromatic unabsorbed flux density at 2 keV, derived using the stacked image counts and a power law with photon index , and Å) is the flux density at 2500 Å, both in erg s-1 cm-2 Hz-1.
For iPTF15af we obtained for the X-ray upper confidence level interval. In order to compare this value to that of standard QSOs, we derived the expected X-ray luminosity for a typical QSO given its UV luminosity using the relation found by Just et al. (2007):
| (2) |
The difference between the two ratios, parametrized as
| (3) |
is used as an indication of X-ray weakness as compared to the general QSO population.
For our TDE, we derive a value of , which indicates that the transient is weaker in X-rays by a factor of than a typical QSO of the same UV luminosity. This value is in agreement with the weakest X-ray BAL QSOs from Gibson et al. (2009) (their Figure 16).
2.7 Radio
Radio follow-up observations of iPTF15af were carried out with the Jansky Very Large Array (VLA; PI A. Horesh) on UTC 2015 Jan. 31, at 15 days after discovery. The source was not detected either in the C (6.1 GHz), or K (22 GHz) bands with a root mean square (RMS) of 28 Jy and 36Jy respectively. The corresponding upper limits for the monochromatic radio luminosities are erg s-1 and erg s-1 at 6.1 and 22 GHz.
These early-time observation of iPTF15af cannot completely rule out an emission mechanism equivalent to that of ASASSN-14li (Holoien et al., 2016b), which a month after discovery registered peak luminosities of erg s-1 and erg s-1 at 5 GHz and 15.7 GHz, respectively (van Velzen et al., 2016b; Alexander et al., 2016). In case of jetted on-axis emission, these limits would constrain the jet energy to erg s-1 (Generozov et al., 2017).
2.8 Mid-Infrared Photometry
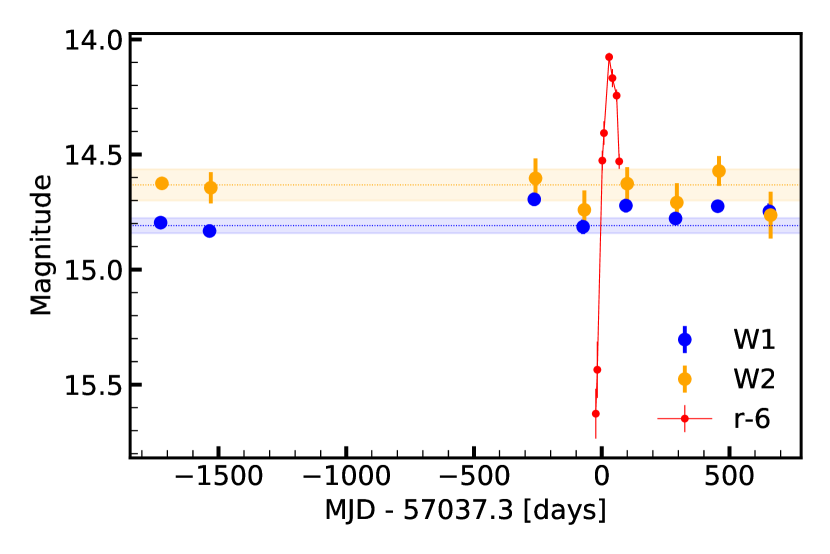
We retrieved archival mid-IR data prior to and after the event from the WISE survey and the 2017 release of NEOWISE (Mainzer et al., 2014). The WISE data correspond to the all-sky survey run in 3.4, 4.6, 12, and 22 m (W1, W2, W3, W4) taken in 2010. The NEOWISE data cover three years after the reactivation of the mission in December 2013 in the W1 and W2 bands.
Using the IRSA archive333http://irsa.ipac.caltech.edu, we selected W1 and W2 magnitudes for sources detected in single exposures within of the position of the transient. After discarding the measurements marked as upper limits (“U” value in the ph_qual column), we obtained the flux-weighted average combining the remaining measurements per epoch. The results are shown in Figure 5, where we also include the -band light curve of the transient for comparison.
Although the NEOWISE light curve shows small variations around the archival value of the source in the allWISE catalogue, none of them is more significant than 3. Hence, for iPTF15af we can rule out a detection of a strong IR echo as in the case of PTF09ge (van Velzen et al., 2016a) or PS16dtm (Jiang et al., 2017).
3 Spectral Energy Distribution Analysis
For our spectral energy distribution (SED) analysis, we used Swift UVOT aperture photometry for , , and (subtracting the host synthetic magnitude from our best fit model spectra), and difference-image photometry in the and bands, to derive the black-body temperature and radius of the emission from the transient. We fixed the time of the Swift observations as our reference epoch and interpolated the optical bands to derive the magnitudes at the same epoch. The fluxes, corrected for Milky Way extinction, were fit with an SED corresponding to a single-temperature black-body model. We have excluded the optical Swift bands from our analysis, as they had considerable contamination from the host galaxy, which was still present in our last epochs. The band from the P60 exhibited larger scatter than usual, so it was excluded as well.
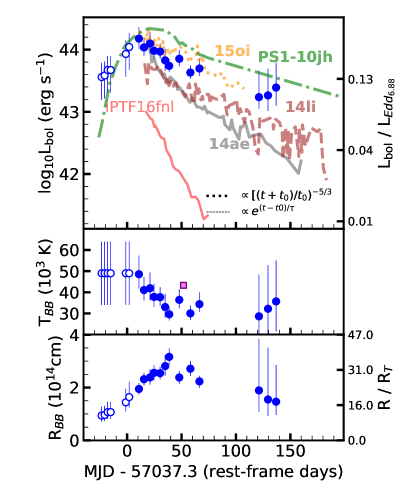
The initial value for the temperature prior was derived from the fit to the UV spectrum (see Section 4.2). Our posterior distributions for temperature and radius are based on Markov Chain Monte Carlo (MCMC) simulations, run using the Python package emcee (Foreman-Mackey et al., 2013). The black-body bolometric luminosity, along with the best fit for the temperature and the radius (median, 16% and 84% percentiles) as derived from the SED, are shown as filled circles in Figure 6 and given in Table 5.
| MJD | Rest epoch | |||
|---|---|---|---|---|
| (days) | (days) | ( K) | ( cm) | ( erg s-1) |
| 57012* | -23.4 | 4.90 | 0.94 | 3.62 |
| 57015* | -20.7 | 4.90 | 0.97 | 3.83 |
| 57018* | -17.9 | 4.90 | 1.07 | 4.70 |
| 57021* | -15.1 | 4.90 | 1.07 | 4.70 |
| 57036* | -1.2 | 4.90 | 1.44 | 8.51 |
| 57039* | 1.9 | 4.90 | 1.64 | 11.02 |
| 57049 | 10.8 | 4.86 | 1.95 | 15.03 |
| 57054 | 15.5 | 4.11 | 2.32 | 10.84 |
| 57060 | 21.0 | 4.19 | 2.38 | 12.54 |
| 57064 | 24.7 | 3.78 | 2.56 | 9.56 |
| 57070 | 30.3 | 3.77 | 2.55 | 9.30 |
| 57075 | 34.9 | 3.30 | 2.81 | 6.71 |
| 57079 | 38.6 | 2.96 | 3.16 | 5.47 |
| 57089 | 47.9 | 3.64 | 2.38 | 7.12 |
| 57100 | 58.1 | 3.00 | 2.71 | 4.27 |
| 57109 | 66.5 | 3.44 | 2.23 | 4.96 |
| 57168 | 121.1 | 2.86 | 1.89 | 1.72 |
| 57177 | 129.5 | 3.22 | 1.55 | 1.84 |
| 57185 | 136.9 | 3.57 | 1.46 | 2.46 |
aFits to the optical and UV SED, giving the temperature (), radius (), and luminosity (). Epochs marked with “*” were estimated from -band images only (see §3).
The rising part in our light curve only contains optical measurements, mainly in -band. Our Swift measurements start a month after the detection of the source in stacked iPTF data. In order to derive the luminosity and the radius of the emitting region without Swift NUV photometry, we proceed as follows. We initially assume that the temperature of the emission does not deviate significantly from our first estimate from Swift photometry. We use this value of K to simulate black-body emission and scale it to our -band measurements. The results are shown in Figure 6 as open circles. Their error bars indicate the change in luminosity and radius if our assumed temperature varied by K.
The bolometric light curve obtained for iPTF15af shows a slow rise over the initial 30 days, reaching erg s-1 and gradually decaying over the next five months, providing a rest-frame -folding time of days. The overall luminosity and timescales for this TDE, as shown in Figure 6, agree well with those of PS1-10jh (Gezari et al., 2012) and slowly evolving events like ASASSN15oi (Holoien et al., 2016a).
The integrated bolometric light curve over the observed interval (Figure 6) shows a total energy of erg. Assuming an efficiency of for transforming the accreted mass into the observed luminosity, , the inferred lower limit for the mass of the accreted material is M⊙.
Analogous to the trend seen in other optical TDEs (see figure 11 in Hung et al. (2017)), the temperature of iPTF15af remains relatively constant for nearly 200 days. The emission initially appears hotter, with K, and only two months later evolves toward lower temperatures in the 30,000 K range. The cooling is related to an expansion of the photosphere from cm during the rise, up to a maximum of cm (4300 R⊙) during peak, placing the emission at tidal radii from the SMBH. This value is similar those reported for other optical TDEs (Hung et al., 2017; Wevers et al., 2017).
To further constrain the characteristics of iPTF15af, we used the same Swift UVW2, UVM2, and UVW1 bands, together with the difference-imaging and photometry, to model the light curve with the open-source code MOSFiT (Guillochon et al., 2018), based on the TDE model of Guillochon & Ramirez-Ruiz (2013). In order to avoid host-galaxy contamination, we excluded the bands , , and . Provided the mass of the SMBH was available from the literature (see §2.1), we used it as our prior probability, allowing our uniform distribution to vary within 3.
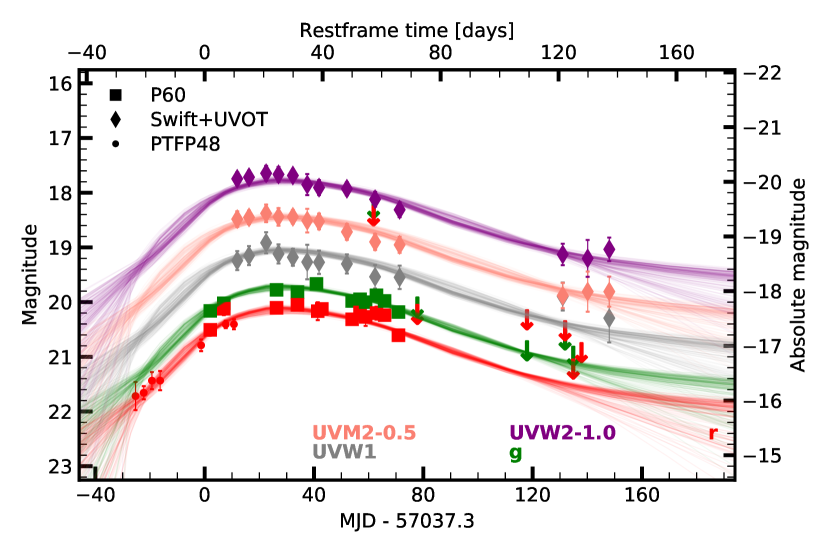
The lightcurves for a set of best fit models are shown in Figure 7. The parameters derived from the simulation correspond to a tidal disruption of a star with mass M⊙ by a black hole with log , consistent within the errors with our literature prior. This mass would be on the heavy end for the sample of TDE fits from Mockler et al. (2018), similar to the one computed for PS1-10jh. The estimated disruption time of the star is at days. The impact parameter, defined as the ratio between the star’s disruption radius and the radius of the star at pericentre , is the lowest compared to the previous sample. The value would imply an extremely shallow encounter, corresponding to only a partial disruption (Guillochon & Ramirez-Ruiz, 2013). Since the event is among the brightest in the sample, its luminosity could be attributed to a highly efficient conversion of to luminosity of . The reddening in the host estimated by the model is log , corresponding to an extinction of mag when assuming the relation provided by Güver & Özel (2009).
4 Spectroscopic Analysis
4.1 Optical Spectroscopy
The optical spectroscopic evolution of iPTF15af is shown in the left panel of Figure 3. In the last two spectra, taken at four and five months after the event, the broad emission lines have disappeared, with the exception of a residual flux possibly associated with H at +121 days. However, the contribution from a blue continuum is still noticeable in both spectra, as compared with the quiescent host at +1035 days.
For our line analysis, we used the late-time (+1035 days) spectrum of the galaxy to perform host subtraction, following the method described by Blagorodnova et al. (2017). To ensure that the TDE features were completely gone, we compared our spectrum to the archival SDSS pre-flare spectrum, taken 13 years before the detection of the transient. Except a small scaling factor, we found no significant deviation between the two. We then fit simultaneously the host and a black-body component to the TDE emission spectrum and subtracted this fit from the transient spectrum. A low-order polynomial was used to level up any leftover broad component in the continuum. The residuals are shown in the right-hand panel of Figure 3.
Using the Python package lmfit, we model the emission lines of the residual spectra with one and two Gaussian profiles and a broad exponential profile for the local continuum. The best fits are shown in Figure 8 and the measurements are logged in Table 6.
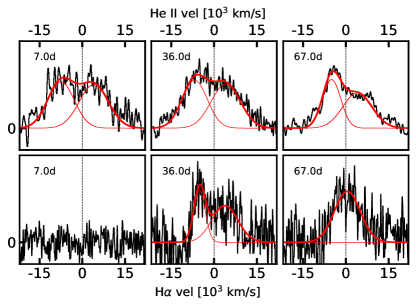
The H line is not detected in our first residual spectrum. However, at later epochs emission is present with possibly two distinct components at +36 days, with velocities similar to those of the He II line. Toward +67 days, it evolves into a single broad ( km s-1) line centered on its rest-frame wavelength.
The He ii 4686 line is clearly detected in all three spectra, which show a bimodal profile. While the redshifted wing has constant km s-1 and a full width at half-maximum (FWHM) of km s-1, there is a noticeable narrowing of the blueshifted component at later times. The velocity shifts toward lower values and the emission becomes narrower, evolving from an average FWHM of km s-1 to 7500 km s-1.
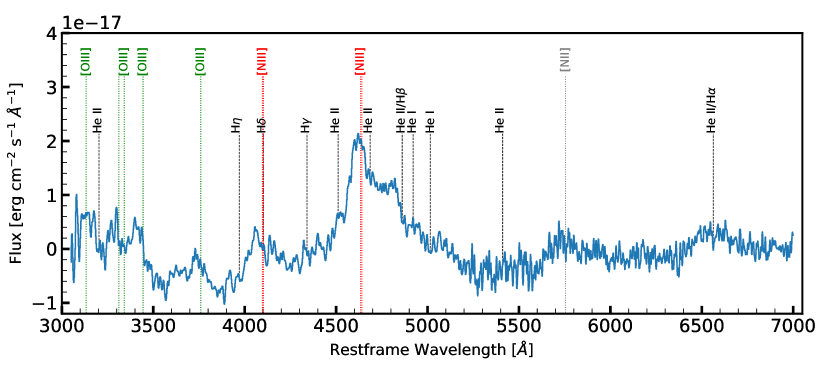
The blueshifted component in the double-peaked He II region is very interesting. Previous spectroscopic studies of optical TDEs attributed the blueshifted component to a blend of C iii/N iii, usually detected in Wolf Rayet stars and supernovae having high temperatures (Gezari et al., 2015; Brown et al., 2018). Figure 9 shows that the centroid of this line appears to be blueshifted with respect to the rest-frame wavelengths of N iii and C iii . Here we propose that this line and other emission features blueward of 4500 Å are caused by the Bowen fluorescence mechanism.
The Bowen fluorescence mechanism (Bowen, 1934, 1935) was initially proposed to explain the unusually strong metallic lines observed in planetary nebulae. The source of the emission lies in the recombination of fully ionized He ii and its de-excitation toward its ground state. While the jumps between the outer orbits produce optical emission (such as the He ii 4686 line), the final transition corresponding to the He II Ly line produces an extreme-UV 303.780 Å photon. After scattering within the nebula, this photon can be either reabsorbed by another He ii atom, or enter in resonance with the O iii lines at 303.800 (O1) and 303.695 (O3). The de-excitation of these lines produces the primary and secondary Bowen decays in the optical, following a tertiary decay emitting a 374.436 Å photon.
The O iii line photons created here can easily escape from the nebula, resulting in transitions at 3047, 3133, 3312, 3341, 3444 and 3760. However, the extreme UV photons are likely to be reabsorbed, this time by the resonance N iii line, with transitions at 374.434 and 374.442 Å. The recombination of the nitrogen atom toward its ground state is converted into a primary transition at 4640 and a secondary one at 4100, along with a 452 Å photon. While the extreme-UV photons are optically thick and suffer multiple absorptions and re-emissions within the nebula, the optical photons will easily escape. Observations of planetary nebulae suggest that high optical depths are required for the Bowen fluorescence to work (Selvelli et al., 2007), as the O iii photons would need to suffer several scatterings in order to increase the pumping efficiency for N iii.
Bowen fluorescence was predicted to occur also around accreting black holes several decades ago (Netzer et al., 1985). However, only recently it has been robustly identified in TDEs (present work) and AGN flares (Trakhtenbrot et al., 2019).
Figure 9 shows the main Bowen transition lines overplotted on the spectrum taken at +67 days. In the earlier spectra at +7 days and +36 days we can also identify the lines associated to nitrogen 4100, 4640. However, the broader line profile at those epochs makes the identification of the oxygen lines challenging.
In addition, in the early-time spectra we tentatively identify an emerging line around 5700 Å, close to the He i 5875 region. However, the origin of this line is less clear, as its blueshift velocity would be around km s-1, higher than the one observed for He II and H ( to km s-1). Provided other nitrogen lines were detected, another possible candidate would be the N ii forbidden line, with a wavelength of 5754.8 Å.
| Phase | Ion | Velocity1 | FWHM1 | Velocity2 | FWHM2 |
|---|---|---|---|---|---|
| (day) | ( km s-1) | ( km s-1) | ( km s-1) | ( km s-1) | |
| +7 | He ii | 7.42.1 | 11.01.2 | 4.12.6 | 12.10.7 |
| +36 | H | 5.10.1 | 4.70.3 | 3.80.3 | 10.81.1 |
| +36 | He ii | 6.80.3 | 10.40.4 | 4.10.1 | 12.10.1 |
| +67 | H | 0.50.2 | 10.80.5 | … | … |
| +67 | He ii | 4.90.2 | 7.60.3 | 4.10.4 | 12.10.3 |
aThe index “1” indicates the blueshifted component and the index “2” the redshifted one.
4.2 UV Spectroscopy
The UV spectrum of iPTF15af, corrected for Milky Way extinction, is shown in Figure 4. Assuming negligible UV flux contribution from the host galaxy, we use the featureless part of the spectrum with Å to fit a black-body spectrum. Our best fit provides a temperature of K, consistent with the value derived from our Swift SED analysis at a similar epoch, as shown in Figure 6.
The spectrum exhibits a combination of narrow absorption lines of low-ionization elements both in the Milky Way and in the TDE host galaxy, and broad lines associated with highly ionized outflows in the host. The description of each set of features is detailed below.
4.2.1 Milky Way Absorption
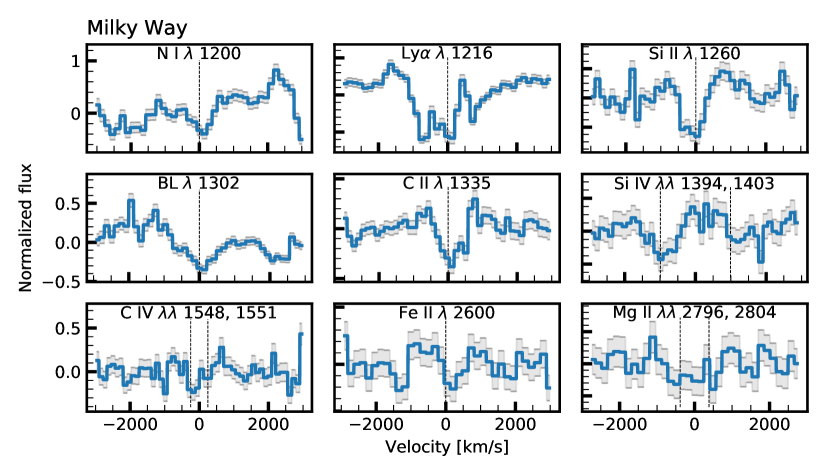
Figure 10 shows the line identification for elements close to their rest-frame values. Although the uncertainties in the flux appear to be small, several lines show signs of blending, biasing the line-center measurements. The average resolution of our FUV ( km s-1) and NUV ( km s-1) spectra makes the precise identification of nearby absorption lines challenging. Tentatively, we identified several transitions associated with the Galactic interstellar medium (ISM), containing low-ionization elements N i (14.5 eV), Ly (13.6 eV), Si ii (16.3 eV), C ii (24.4 eV), Fe ii (16.2 eV), and possibly Mg ii (15.0 eV). We identify and mark in the spectrum in Figure 4 the geocoronal airglow lines of Ly, O i 1304, O i] 1356, and [O ii] 2471. The high-ionization metal states correspond to Si iv (45.1 eV) and C iv (64.5 eV). Around 1302 Å we identify an absorption corresponding to a blend of O i 1302 and Si ii 1304 lines (identified as BL).
| Ion | z | FWHM | EW | velocity | ||
| (Å) | (Å) | (Å) | (Å) | (km s-1) | ||
| N I | 1200.0 | 0.0 | 1200.30.2 | 2.4 | 0.32 | 7550 |
| Ly | 1215.9 | 0.0 | 1214.680.3 | … | … | -30074 |
| Si II | 1260.4 | 0.0 | 1260.060.1 | 2.6 | 0.7 | 8124 |
| BL | 1302.0 | 0.0 | 1303.00.3 | 2.4 | 0.2 | 23070 |
| C II | 1334.5 | 0.0 | 1335.00.1 | 3.21 | 0.90 | 11222 |
| Si IV | 1393.8 | 0.0 | 1394.20.1 | 3.86 | 0.54 | 8622 |
| C IV | 1548.2 | 0.0 | 1548.50.3 | 1.13 | 0.38 | 5858 |
| Fe II | 2600.2 | 0.0 | 2602.00.3 | 4.7 | 1.20 | 20835 |
| Mg II | 2803.5 | 0.0 | 2801.10.3 | … | … | 25732 |
| Ly | 1215.7 | 0.07897 | 1311.60.2 | 2.65 | 0.96 | 10050 |
| C II | 1334.5 | 0.07897 | 1439.40.4 | … | … | 9090 |
| C IV | 1548.2 | 0.07897 | 1669.70.6 | … | … | 140110 |
| C IV | 1550.8 | 0.07897 | 1672.20.7 | … | … | 200 125 |
4.2.2 Host-Galaxy Absorption
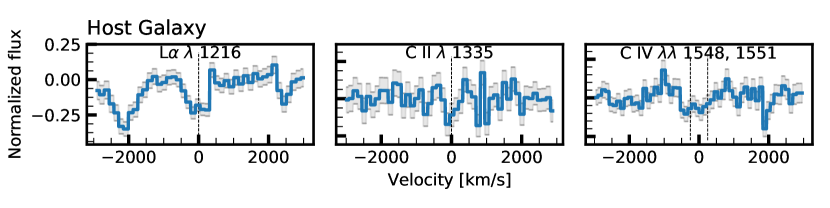
In agreement with the UV spectroscopic signature for ASASSN-14li, the spectrum of iPTF15af also shows weak Ly absorption from the host. The majority of low-ionization elements are also missing. Some narrow absorption lines that were identified correspond to Ly at 1216 Å, C ii 1334, and higher-ionization line corresponding to the C iv 1548, 1551 doublet (64.5 eV). The N v 1239, 1243 doublet, if present, is likely blended into the C ii line at 1335 Å at Galactic redshift. We also measure a slight blueshift in our lines, with velocities of 90–200 km s-1. These values would be consistent with the motion of gas inside of the host galaxy. However, there is a chance of a low-velocity outflow in this TDE as well, similar to the one observed for ASASSN-14li (Miller et al., 2015).
4.2.3 Broad Lines
According to the classical definition by Weymann et al. (1981), a BAL is a trough at % below the continuum level which extends for more than 2000 km s-1. This definition has been formalized by the so-called “balnicity index” (Weymann et al., 1991), computing the equivalent width (EW) of the broad ( km s-1) absorption-line troughs for each element. Using the best-fit black-body spectrum as our continuum level, we compute that iPTF15af has balnicity indices of 3856 for Si v, 3495 for N v, and 3392 for C iv, consistent with the distribution observed for BAL QSOs (Gibson et al., 2009). The main BALs in the spectrum of iPTF15af have been identified and marked in Figure 4.
We also identified a feature in the region around 1100 Å, known to contain the resonance multiplet of Fe iii (UV1), with a rest wavelength of 1122.5 Å. However, based on the similarity between the spectra of iPTF15af and high-ionization BAL QSOs (HiBAL), we attribute the broad depression in that region to P v 1118, 1128 (65.0 eV), observed in 3.0–6.2% of BAL QSOs (Hamann, 1998; Capellupo et al., 2017).
Figure 4 shows several broad emission lines (BEL) that were also identified at the host redshift. We detect strong emission from N iii] 1759 (47.5 eV) and also He ii 1641 (54.4 eV). The resonance line transitions produced by C iv 1548, 1551 (64.5 eV), Si iv 1394, 1403 (45.1 eV), and N v 1239, 1243 (97.9 eV) are also present, accompanied by broad blueshifted absorption analogous to BAL QSOs.
Similar to other TDEs in quiescent galaxies (Cenko et al., 2016; Brown et al., 2018), we notice the lack of emission for the low-ionization lines of Mg ii 2796, 2804, Al iii 1854, 1862, and Fe ii. Furthermore, C iii] 1908, having a similar ionization potential to that of N iii] (47.9 eV vs. 47.5 eV), is also absent. Since the ratio C iii]/N iii] has only a moderate dependence on the physical conditions of the gas (under local thermodynamic equilibrium conditions), the lack of C in the spectra of TDEs has been attributed to the unusually high abundance ratio of N to C in the debris of the disrupted star (Kochanek, 2016a; Yang et al., 2017).
Table 8 shows the bulk velocity and the FWHM of each broad line, as modeled with a combined absorption and emission Gaussian line profiles. He ii and N iii] are only detected in emission, with their centroids redshifted by km s-1 and 100 km s-1, respectively. The observed widths of the emission lines are in the km s-1 regime, corresponding to a virialized gas orbiting a log SMBH at a distance of cm. This value is four times larger than our inferred black-body photospheric radius, suggesting that the line formation region is located likely in an outflow outside the continuum emitting zone.
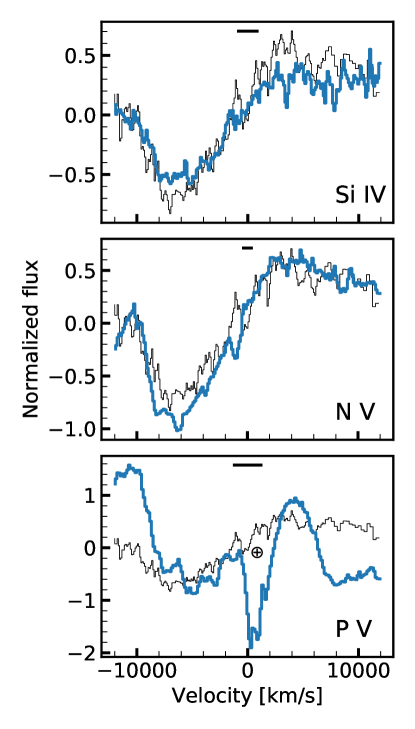
In Figure 11, we compare the normalized absorption profile of C iv to the other high-ionization broad lines. The velocity shifts for broad absorption components in iPTF15af are km s-1, consistent with the outflow velocities of 5000–10,000 km s-1 observed in BAL QSOs. Despite some differences in the level of continuum, the widths of the absorption troughs are consistent with each other, suggesting that the absorption is produced by the same cloud.
Assuming that the outflow in iPTF15af was initiated around the bolometric peak light (as observed in the spectral signature of PS1-11af), we can estimate the distance traveled by the cloud until the moment the UV spectrum was taken (30 days). Considering the outflow’s fastest absorption component traveling at 8000 km s-1, we can deduce an upper limit for the distance of the absorber of cm, which is in agreement with the virial radius computed from the emission lines width.
| Ion | Velocityabs | FWHMabs | Velocityem | FWHMem |
|---|---|---|---|---|
| ( km s-1) | ( km s-1) | ( km s-1) | ( km s-1) | |
| Si iv | 6.10.5 | 11.02.2 | … | … |
| N iii] | … | … | 0.20.3 | 10.81.0 |
| He ii | … | … | 2.60.4 | 4.10.9 |
| C iv | 5.30.5 | 9.11.4 | 1.66.2 | 14.04.0 |
| P v | 4.600.2 | 7.40.8 | … | … |
| N v | 5.10.2 | 7.70.5 | 4.20.1 | 6.10.5 |
aIdentified in iPTF15af. The suffix em symbolizes the values corresponding to the emission and abs to the absorption components. The elements are ordered from lower to higher ionization potentials: Si iv 45.1 eV, N iii] 47.5 eV, He ii 54.4 eV, C iv 64.5 eV, P v 65.0 eV, and N v 97.9 eV.
5 Discussion
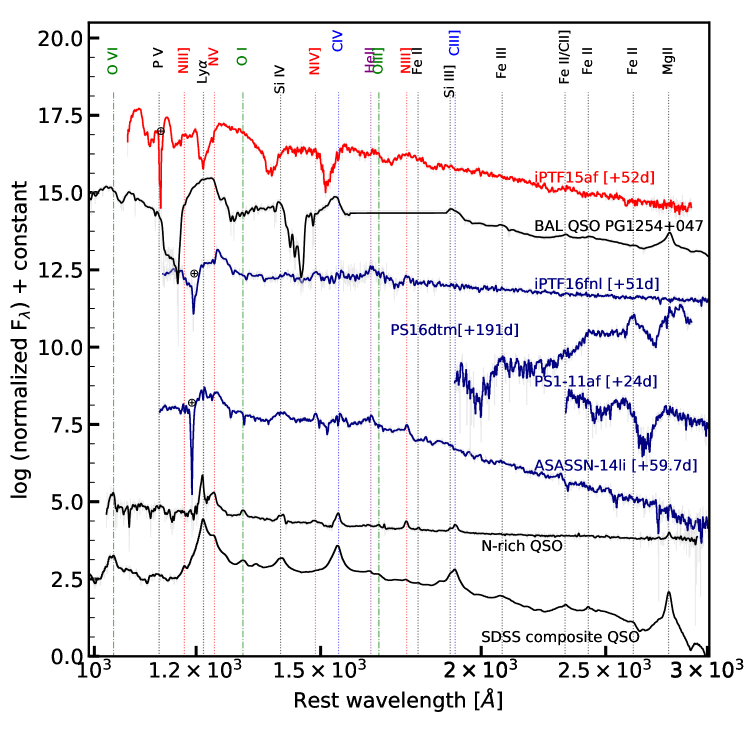
iPTF15af is one of the four optical TDEs spectroscopically observed in the NUV and FUV. From these, PS16dtm and ASASSN-14li were discovered in galaxies with low-ionization nuclear emission-line regions. The latter was previously detected in X-ray and radio. Although the host of iPTF16fnl did not show any signs of activity, this event was the faintest and fastest TDE amongst all the optical sample explored so far. In this context, iPTF15af is quite representative of the general TDE population that we have seen so far: slowly evolving events with peak luminosities around erg s-1, generally in non-active galaxies. iPTF15af also had non-detections in radio and had weak (if any) soft X-ray emission. The characteristics observed for this transient may be relevant for the interpretation of the bulk of TDEs observed at UV wavelengths.
A comparison of iPTF15af with other optically discovered TDEs is shown in Figure 12. Several AGN spectra are also included: a BAL QSO from Hamann (1998), a composite QSO from the SDSS spectroscopic survey (Vanden Berk et al., 2001), and the nitrogen-rich QSO J164148.19+223225.2 (Batra & Baldwin, 2014).
An initial remarkable difference is that none of the early-time emission in TDEs shows the presence of low-ionization elements such as Mg ii (15.0 eV) and Fe ii (16.2 eV), which are commonly observed in AGN spectra. The origin of these lines is believed to be in the partly neutral, low-ionization regions in optically thick gas clouds, which are being irradiated by X-ray photons from the central engine. For such lines to exist, the BLR clouds would require a lower limit on the column density on the order of cm-2 (Blandford et al., 1990). The lack of strong lines redward of 1900 Å can be attributed to insufficient shielding from high-energy photons, which keep the ionization continuum in the cloud well above their ionizaiton potential of eV.
The absorption components for low-ionization ions Mg ii and possibly Fe ii can be observed for two TDEs in our comparison sample: PS1-11af (Chornock et al., 2014) and PS16dtm (Blanchard et al., 2017), which also differ from other TDEs in optical wavelengths. The absorption in PS1-11af was not present in the spectrum taken at days, suggesting that it formed in an outflow outside of the continuum region, analogous to our interpretation of iPTF15af.
The higher redshift of iPTF15af allows us to reach shorter wavelengths, where we putatively identify broad absorption corresponding to the ion P v 1118, 1128. This element is also observed in % of BAL QSOs and its presence implies the existence of large column densities of cm-2 (Capellupo et al., 2017). In most QSOs, the P v lines do not appear saturated, providing an impression of an extreme metal-to-hydrogen abundance ratio for the circum-nuclear gas (Hamann, 1998). However, if the absorbing outflows are concentrated in small optically thick cloudlets, they only would cover a fraction of the background emission source, supplying an extra continuum component.
As most BAL QSOs are weak in X-rays (Brandt et al., 2000; Gallagher et al., 2001), we can argue that the high column density outflows in iPTF15af would also act as an absorber for the soft X-rays, which would explain the early-time non-detections. The delayed reflection of high-energy emission in these cloudlets would possibly generate a highly enhanced He ii/H ratio, as observed in several optical TDEs (Saxton et al., 2018). However, the drop in density at late times would allow this emission to leak out, explaining the soft X-ray brightening of ASASSN-15oi reported by Gezari et al. (2017); Holoien et al. (2018). This lower density would also contribute to the narrowing of the optical line profiles, as observed in most optical TDEs (Roth & Kasen, 2018).
The lack of detectable radio and X-ray emission for iPTF15af further confirms that optical TDEs are predominantly radio quiet (van Velzen et al., 2013), which seems to contrast with the high radio-loud fraction of AGNs among the nitrogen-rich population (Jiang et al., 2008).
One traditional diagnostic of the gas density is the strength of the line C iii] 1909, which has been extensively used in quasars to derive an upper limit for the density of the line-forming gas region (Osterbrock, 1970). Collisional de-excitation of this line becomes comparable to the spontaneous radiation rate at values approaching its critical density cm-3. Hence, C iii] and other semiforbidden lines such as N iii] 1750 ( cm-3), O iii] 1663 ( cm-3), and N iv] 1486 ( cm-3), are expected to be weaker in the interior of the BLR, where the density exceeds their critical value. These lines are expected to gain importance in the external part of the BLR, where the density is lower.
In the case of iPTF15af and other TDEs, we encounter a puzzle, as the spectrum shows unequal contributions for C iii] and N iii]. The nitrogen atom has similar ionization potential to carbon and the same ionization structure dependencies. Naively, we would expect the less denser BLR regions to form both lines at the same time, with the N iii]/N iv ratio enhanced in a similar way to C iii]/C iv. However, as previously discussed in the literature (Cenko et al., 2016; Brown et al., 2018), this assumption fails for TDE spectra. While the semi-forbidden N iii] lines are clearly detected with broad velocity spread, the C iii] is lacking in all three TDEs having FUV spectra. The origin for this discrepancy has been associated with the nitrogen-enhanced composition of the stellar debris for super-solar-mass stars (Kochanek, 2016b; Yang et al., 2017). The carbon-nitrogen-oxygen cycle would have substantially altered the star’s composition with enhanced nitrogen at the expenses of carbon, translated into the observed line ratios. The debris of such a star would pollute the broad-line region (BLR), providing a possible link with nitrogen-rich QSOs (Kochanek, 2016b).
Additionally, the existence of strong nitrogen emission around AGNs has been discussed by several recent studies. Some support the hypothesis that strong nitrogen lines imply highly super-solar metallicity in the vicinity of the SMBH (Batra & Baldwin, 2014), increased by continuous circumnuclear star formation. Others argue that the observed strong emission is most likely attributed to an exceptionally nitrogen-rich composition in the BLR, rather than overall enhanced metallicity (Matsuoka et al., 2017). The origin for this N-rich material would be linked to strong winds from the young asymptotic giant branch (AGB) stellar population in the nuclear regions of the galaxy. The studies agree, though, that the N-loud AGN sample has on average lower SMBH masses as compared to the general population in the sample. This is a good indication that these galaxies are just initiating their main growth stage via high accretion episodes.
TDE discoveries have been predominantly associated with post-starburst galaxies having high stellar densities in the bulge (French et al., 2016; Law-Smith et al., 2017; Graur et al., 2018). For these galaxies, we would expect a young stellar population actively polluting the circumnuclear regions with both metal-rich supernova winds and N-enhanced AGB stellar winds. Regardless of the enrichment mechanism, TDEs would primarily be hosted in galaxies with already altered chemical abundances, translated into unusually strong nitrogen component in their UV spectra. However, an additional mechanism would need to be invoked to explain the apparent lack of C iii] and strong C iv emission, suggesting that the composition of the star indeed plays an important role in shaping the observed UV signature of TDEs.
One important difference between iPTF15af and BAL QSOs is the shape of the absorption. While the TDE shows a smooth gradient from lower to higher velocities and a sharp cut at km s-1, BAL QSOs generally exhibit the opposite trend: their absorption profile is detached from their emission. Their spectra show a sharp cut at lower velocities and a broader wing corresponding to higher velocity outflows. In BAL QSOs this means that the gas in our line of sight has already been radiatively accelerated to higher speeds. Closer to the emitting region, the gas will have higher column density, but lower velocity, appearing as a sharp trough in the spectra next to the emission line. In the case of iPTF15af we see that most of the absorption is caused by high-velocity gas transitioning to lower-velocity outflows.
Outflows with km s-1 have been predicted to occur in TDEs with radiatively inefficient accretion flows (Metzger & Stone, 2016). Here we present UV spectroscopic data that confirms the existence of the outflow, and discuss the acceleration mechanism. For a given SMBH mass, the maximum velocity of the TDE outflow will depend on the Eddington ratio of the flare, the density of the gas and its distance to the central engine, as shown for AGN (Risaliti & Elvis, 2010). At smaller radii, the gas will become overionized and the radiative wind will fail. At larger radii, the UV radiation field will be too weak to provide a noticeable acceleration. Therefore, the highest velocity for the bulk of stellar debris is likely to be achieved for dense gas at intermediate radius (100 Rs). The remaining bound material returning to the SMBH will progressively feel weaker acceleration, as the central source will be quickly fading with time, but also the material will be less dense. As the density of the ejecta decreases, it will become easier for the ionizing radiation to eventually penetrate this material and escape to infinity, making the mechanism less efficient. Continuous monitoring of these absorption-line profiles can provide a new tool to better understand the outflow geometry in TDEs.
6 Conclusions
iPTF15af is a TDE discovered in the core of a galaxy with signs of a short recent starburst episode and high nuclear stellar density in its core. The photometric optical and UV evolution of this event is consistent with previously studied TDEs, such as PS1-10jh and ASASSN-15oi. The event has a comparably slow rise time of days and peaks at erg s-1, with an estimated temperature of K.
The optical spectral evolution of iPTF15af shows broad characteristic He II and later H lines superposed on a blue featureless continuum, which persists beyond four months past discovery. During the first three months the optical lines exhibits a fast evolution in their line profile, with the H line appearing and becoming narrower at later times. The lines are no longer detected after days post-discovery.
Our spectroscopic analysis reveals fluorescence lines of O iii and N iii, likely related to the Bowen fluorescence mechanism observed in planetary nebulae. The fluorescence between He iiO iii and O iiiN iii would explain the pumping of extreme-UV flux into optical emission.
We find that the medium producing the absorption in iPTF15af would come from a highly ionized source shielded by high-density material, justifying the lack of low-ionization lines of Mg ii and Fe ii and the appearance of broad absorption lines for highly ionized states of C, N, Si, and P. The density of the gas would act as an absorber of the flare in X-rays, irradiating it toward lower-density gas enriched with nitrogen and/or metals supplied by a young stellar population in the bulge. The composition of the gas would then tip the N/C ratio to higher values than usually found in AGNs. In addition, the nitrogen enhanced and carbon depleted stellar debris of an evolved star can help justify the observed lack of C iii in the UV spectrum.
Contrary to BAL QSOs, the broad absorption line profiles observed in iPTF15af suggest that the highest column density material is moving at the outflow maximum velocity. We propose that the radiation pressure generated by the TDE flare at early times can supply the acceleration mechanism for this high-density gas. Future multi-epoch observations of TDEs in the UV would help to constrain the geometry, density and kinematics of the absorbing material, allowing to test this hypothesis. Late-time observations in X-rays are required to verify the change in the outflow’s density, allowing high energy to escape.
7 Acknowledgements
We thank the anonymous referee, whose comments and suggestions helped to improve the paper. We are grateful to Peter Maksym, Sterl Phinney, Eliot Quataert, Clément Bonnerot, Tiara Hung, and Sjoert Van Velzen for valuable discussions and comments on this work. We are grateful to Eric Bellm, Melissa Graham, Anna Ho, and Daniel Perley for carrying out some of the spectroscopic observations and/or reductions, and Linda Strubbe for her support with the HST proposal. We thank the HST staff for the prompt scheduling of these ToO observations, as well as the PI Neil Gehrels and the Swift ToO team for the timely execution of our observations.
This work was supported by the GROWTH project funded by the National Science Foundation (NSF) under grant AST-1545949. This work is part of the research programme VENI, with project number 016.192.277, which is (partly) financed by the Netherlands Organisation for Scientific Research (NWO). Support for I.A. was provided by NASA through the Einstein Fellowship Program, grant PF6-170148.
A.H. acknowledges support by the I-Core Program of the Planning and Budgeting Committee and the Israel Science Foundation. This research was supported by a Grant from the GIF, the German-Israeli Foundation for Scientific Research and Development. A.V.F.’s group at UC Berkeley is grateful for financial assistance from the TABASGO Foundation, the Christopher R. Redlich Fund, and the Miller Institute for Basic Research in Science (UC Berkeley).
Some of the data presented herein were obtained at the W. M. Keck Observatory, which is operated as a scientific partnership among the California Institute of Technology, the University of California, and the National Aeronautics and Space Administration (NASA); the observatory was made possible by the generous financial support of the W. M. Keck Foundation. This work makes use of observations from Las Cumbres Observatory. This publication makes use of data products from the Two Micron All Sky Survey, which is a joint project of the University of Massachusetts and the Infrared Processing and Analysis Center/California Institute of Technology, funded by NASA and the NSF. This publication makes use of data products from the Wide-field Infrared Survey Explorer, which is a joint project of the University of California, Los Angeles, and the Jet Propulsion Laboratory/California Institute of Technology, funded by NASA. Based on observations made with the NASA Galaxy Evolution Explorer. GALEX is operated for NASA by the California Institute of Technology under NASA contract NAS5-98034.
References
- Alam et al. (2015) Alam, S., Albareti, F. D., Allende Prieto, C., et al. 2015, ApJS, 219, 12
- Alexander et al. (2016) Alexander, K. D., Berger, E., Guillochon, J., Zauderer, B. A., & Williams, P. K. G. 2016, ApJ, 819, L25
- Arcavi et al. (2014) Arcavi, I., Gal-Yam, A., Sullivan, M., et al. 2014, ApJ, 793, 38
- Avni & Tananbaum (1982) Avni, Y., & Tananbaum, H. 1982, ApJ, 262, L17
- Bade et al. (1996) Bade, N., Komossa, S., & Dahlem, M. 1996, A&A, 309, L35
- Batra & Baldwin (2014) Batra, N. D., & Baldwin, J. A. 2014, MNRAS, 439, 771
- Bianchi et al. (2011) Bianchi, L., Herald, J., Efremova, B., et al. 2011, Ap&SS, 335, 161
- Blagorodnova et al. (2017) Blagorodnova, N., Gezari, S., Hung, T., et al. 2017, ApJ, 844, 46
- Blanchard et al. (2017) Blanchard, P. K., Nicholl, M., Berger, E., et al. 2017, ApJ, 843, 106
- Blandford et al. (1990) Blandford, R. D., Netzer, H., Woltjer, L., Courvoisier, T. J.-L., & Mayor, M., eds. 1990, Active Galactic Nuclei, 97
- Bloom et al. (2011) Bloom, J. S., Giannios, D., Metzger, B. D., et al. 2011, Science, 333, 203
- Bowen (1934) Bowen, I. S. 1934, PASP, 46, 146
- Bowen (1935) —. 1935, ApJ, 81, 1
- Brandt et al. (2000) Brandt, W. N., Laor, A., & Wills, B. J. 2000, ApJ, 528, 637
- Breeveld et al. (2010) Breeveld, A. A., Curran, P. A., Hoversten, E. A., et al. 2010, MNRAS, 406, 1687
- Brown et al. (2018) Brown, J. S., Kochanek, C. S., Holoien, T. W.-S., et al. 2018, MNRAS, 473, 1130
- Brown et al. (2013) Brown, T. M., Baliber, N., Bianco, F. B., et al. 2013, PASP, 125, 1031
- Bruzual & Charlot (2003) Bruzual, G., & Charlot, S. 2003, MNRAS, 344, 1000
- Burrows et al. (2005) Burrows, D. N., Hill, J. E., Nousek, J. A., et al. 2005, Space Sci. Rev., 120, 165
- Burrows et al. (2011) Burrows, D. N., Kennea, J. A., Ghisellini, G., et al. 2011, Nature, 476, 421
- Capellupo et al. (2017) Capellupo, D. M., Hamann, F., Herbst, H., et al. 2017, MNRAS, 469, 323
- Cenko et al. (2012) Cenko, S. B., Krimm, H. A., Horesh, A., et al. 2012, ApJ, 753, 77
- Cenko et al. (2016) Cenko, S. B., Cucchiara, A., Roth, N., et al. 2016, ApJ, 818, L32
- Chang et al. (2015) Chang, Y.-Y., van der Wel, A., da Cunha, E., & Rix, H.-W. 2015, ApJS, 219, 8
- Chornock et al. (2014) Chornock, R., Berger, E., Gezari, S., et al. 2014, ApJ, 780, 44
- Condon et al. (1998) Condon, J. J., Cotton, W. D., Greisen, E. W., et al. 1998, AJ, 115, 1693
- Drake et al. (2009) Drake, A. J., Djorgovski, S. G., Mahabal, A., et al. 2009, ApJ, 696, 870
- Foreman-Mackey et al. (2013) Foreman-Mackey, D., Hogg, D. W., Lang, D., & Goodman, J. 2013, PASP, 125, 306
- Fremling et al. (2016) Fremling, C., Sollerman, J., Taddia, F., et al. 2016, A&A, 593, A68
- French et al. (2016) French, K. D., Arcavi, I., & Zabludoff, A. 2016, ApJ, 818, L21
- French et al. (2017) —. 2017, ApJ, 835, 176
- Gallagher et al. (2001) Gallagher, S. C., Brandt, W. N., Laor, A., et al. 2001, The Astrophysical Journal, 546, 795
- Gehrels et al. (2004) Gehrels, N., Chincarini, G., Giommi, P., et al. 2004, ApJ, 611, 1005
- Generozov et al. (2017) Generozov, A., Mimica, P., Metzger, B. D., et al. 2017, MNRAS, 464, 2481
- Gezari et al. (2017) Gezari, S., Cenko, S. B., & Arcavi, I. 2017, ApJ, 851, L47
- Gezari et al. (2015) Gezari, S., Chornock, R., Lawrence, A., et al. 2015, ApJ, 815, L5
- Gezari et al. (2006) Gezari, S., Martin, D. C., Milliard, B., et al. 2006, ApJ, 653, L25
- Gezari et al. (2008) Gezari, S., Basa, S., Martin, D. C., et al. 2008, ApJ, 676, 944
- Gezari et al. (2012) Gezari, S., Chornock, R., Rest, A., et al. 2012, Nature, 485, 217
- Gibson et al. (2009) Gibson, R. R., Jiang, L., Brandt, W. N., et al. 2009, ApJ, 692, 758
- Graur et al. (2018) Graur, O., French, K. D., Zahid, H. J., et al. 2018, ApJ, 853, 39
- Guillochon et al. (2018) Guillochon, J., Nicholl, M., Villar, V. A., et al. 2018, ApJS, 236, 6
- Guillochon & Ramirez-Ruiz (2013) Guillochon, J., & Ramirez-Ruiz, E. 2013, ApJ, 767, 25
- Güver & Özel (2009) Güver, T., & Özel, F. 2009, MNRAS, 400, 2050
- Hamann (1998) Hamann, F. 1998, ApJ, 500, 798
- Henden et al. (2016) Henden, A. A., Templeton, M., Terrell, D., et al. 2016, VizieR Online Data Catalog, 2336
- Holoien et al. (2018) Holoien, T. W.-S., Brown, J. S., Auchettl, K., et al. 2018, MNRAS, arXiv:1804.00006 [astro-ph.HE]
- Holoien et al. (2016a) Holoien, T. W.-S., Kochanek, C. S., Prieto, J. L., et al. 2016a, MNRAS, 463, 3813
- Holoien et al. (2016b) —. 2016b, MNRAS, 455, 2918
- Hung et al. (2017) Hung, T., Gezari, S., Blagorodnova, N., et al. 2017, ApJ, 842, 29
- Jiang et al. (2008) Jiang, L., Fan, X., & Vestergaard, M. 2008, ApJ, 679, 962
- Jiang et al. (2017) Jiang, N., Wang, T., Yan, L., et al. 2017, ApJ, 850, 63
- Jones et al. (2001–) Jones, E., Oliphant, T., Peterson, P., et al. 2001–, SciPy: Open source scientific tools for Python, [Online; accessed ¡today¿]
- Just et al. (2007) Just, D. W., Brandt, W. N., Shemmer, O., et al. 2007, ApJ, 665, 1004
- Kochanek (2016a) Kochanek, C. S. 2016a, MNRAS, 458, 127
- Kochanek (2016b) —. 2016b, MNRAS, 458, 127
- Komossa & Bade (1999) Komossa, S., & Bade, N. 1999, A&A, 343, 775
- Kormendy & Richstone (1995) Kormendy, J., & Richstone, D. 1995, ARA&A, 33, 581
- Kraft et al. (1991) Kraft, R. P., Burrows, D. N., & Nousek, J. A. 1991, ApJ, 374, 344
- Laher et al. (2014) Laher, R. R., Surace, J., Grillmair, C. J., et al. 2014, PASP, 126, 674
- LaMassa et al. (2015) LaMassa, S. M., Cales, S., Moran, E. C., et al. 2015, ApJ, 800, 144
- Law-Smith et al. (2017) Law-Smith, J., Ramirez-Ruiz, E., Ellison, S. L., & Foley, R. J. 2017, ApJ, 850, 22
- Mainzer et al. (2014) Mainzer, A., Bauer, J., Cutri, R. M., et al. 2014, ApJ, 792, 30
- Masci et al. (2017) Masci, F. J., Laher, R. R., Rebbapragada, U. D., et al. 2017, PASP, 129, 014002
- Matsuoka et al. (2017) Matsuoka, K., Nagao, T., Maiolino, R., et al. 2017, A&A, 608, A90
- Mendel et al. (2014) Mendel, J. T., Simard, L., Palmer, M., Ellison, S. L., & Patton, D. R. 2014, ApJS, 210, 3
- Metzger & Stone (2016) Metzger, B. D., & Stone, N. C. 2016, MNRAS, 461, 948
- Miller et al. (2015) Miller, J. M., Kaastra, J. S., Miller, M. C., et al. 2015, Nature, 526, 542
- Mockler et al. (2018) Mockler, B., Guillochon, J., & Ramirez-Ruiz, E. 2018, ArXiv e-prints, arXiv:1801.08221 [astro-ph.HE]
- Netzer et al. (1985) Netzer, H., Elitzur, M., & Ferland, G. J. 1985, ApJ, 299, 752
- Newville et al. (2014) Newville, M., Stensitzki, T., Allen, D. B., & Ingargiola, A. 2014, LMFIT: Non-Linear Least-Square Minimization and Curve-Fitting for Python¶
- Ofek et al. (2012) Ofek, E. O., Laher, R., Surace, J., et al. 2012, PASP, 124, 854
- Oke & Gunn (1983) Oke, J. B., & Gunn, J. E. 1983, ApJ, 266, 713
- Oke et al. (1995) Oke, J. B., Cohen, J. G., Carr, M., et al. 1995, PASP, 107, 375
- Osterbrock (1970) Osterbrock, D. E. 1970, ApJ, 160, 25
- Poole et al. (2008) Poole, T. S., Breeveld, A. A., Page, M. J., et al. 2008, MNRAS, 383, 627
- Rau et al. (2009) Rau, A., Kulkarni, S. R., Law, N. M., et al. 2009, PASP, 121, 1334
- Rees (1988) Rees, M. J. 1988, Nature, 333, 523
- Risaliti & Elvis (2010) Risaliti, G., & Elvis, M. 2010, A&A, 516, A89
- Roming et al. (2005) Roming, P. W. A., Kennedy, T. E., Mason, K. O., et al. 2005, Space Sci. Rev., 120, 95
- Roth & Kasen (2018) Roth, N., & Kasen, D. 2018, The Astrophysical Journal, 855, 54
- Saxton et al. (2018) Saxton, C. J., Perets, H. B., & Baskin, A. 2018, MNRAS, 474, 3307
- Saxton et al. (2012) Saxton, R. D., Read, A. M., Esquej, P., et al. 2012, A&A, 541, A106
- Schlafly & Finkbeiner (2011) Schlafly, E. F., & Finkbeiner, D. P. 2011, ApJ, 737, 103
- SDSS Collaboration et al. (2016) SDSS Collaboration, Albareti, F. D., Allende Prieto, C., et al. 2016, ArXiv e-prints, arXiv:1608.02013
- Selvelli et al. (2007) Selvelli, P., Danziger, J., & Bonifacio, P. 2007, A&A, 464, 715
- Simard et al. (2011) Simard, L., Mendel, J. T., Patton, D. R., Ellison, S. L., & McConnachie, A. W. 2011, ApJS, 196, 11
- Skrutskie et al. (2006) Skrutskie, M. F., Cutri, R. M., Stiening, R., et al. 2006, AJ, 131, 1163
- Stern et al. (2012) Stern, D., Assef, R. J., Benford, D. J., et al. 2012, ApJ, 753, 30
- Stone et al. (2018) Stone, N. C., Kesden, M., Cheng, R. M., & van Velzen, S. 2018, ArXiv e-prints, arXiv:1801.10180 [astro-ph.HE]
- The Astropy Collaboration et al. (2018) The Astropy Collaboration, Price-Whelan, A. M., Sipőcz, B. M., et al. 2018, AJ, 156, 123
- Trakhtenbrot et al. (2019) Trakhtenbrot, B., Arcavi, I., Ricci, C., et al. 2019, Nature Astronomy, arXiv:1901.03731
- Valenti et al. (2016) Valenti, S., Howell, D. A., Stritzinger, M. D., et al. 2016, MNRAS, 459, 3939
- van der Walt et al. (2011) van der Walt, S., Colbert, S. C., & Varoquaux, G. 2011, Computing in Science and Engineering, 13, 22
- van Velzen et al. (2013) van Velzen, S., Frail, D. A., Körding, E., & Falcke, H. 2013, A&A, 552, A5
- van Velzen et al. (2016a) van Velzen, S., Mendez, A. J., Krolik, J. H., & Gorjian, V. 2016a, ApJ, 829, 19
- van Velzen et al. (2018) van Velzen, S., Stone, N. C., Metzger, B. D., et al. 2018, ArXiv e-prints, arXiv:1809.00003 [astro-ph.HE]
- van Velzen et al. (2011) van Velzen, S., Farrar, G. R., Gezari, S., et al. 2011, ApJ, 741, 73
- van Velzen et al. (2016b) van Velzen, S., Anderson, G. E., Stone, N. C., et al. 2016b, Science, 351, 62
- Vanden Berk et al. (2001) Vanden Berk, D. E., Richards, G. T., Bauer, A., et al. 2001, AJ, 122, 549
- Voges et al. (1999) Voges, W., Aschenbach, B., Boller, T., et al. 1999, A&A, 349, 389
- Wevers et al. (2017) Wevers, T., van Velzen, S., Jonker, P. G., et al. 2017, MNRAS, 471, 1694
- Weymann et al. (1981) Weymann, R. J., Carswell, R. F., & Smith, M. G. 1981, ARA&A, 19, 41
- Weymann et al. (1991) Weymann, R. J., Morris, S. L., Foltz, C. B., & Hewett, P. C. 1991, ApJ, 373, 23
- Willingale et al. (2013) Willingale, R., Starling, R. L. C., Beardmore, A. P., Tanvir, N. R., & O Brien, P. T. 2013, MNRAS, 431, 394
- Wright et al. (2010) Wright, E. L., Eisenhardt, P. R. M., Mainzer, A. K., et al. 2010, AJ, 140, 1868
- Yang et al. (2017) Yang, C., Wang, T., Ferland, G. J., et al. 2017, ApJ, 846, 150
- Yaron & Gal-Yam (2012) Yaron, O., & Gal-Yam, A. 2012, PASP, 124, 668