Towards Accountable AI: Hybrid Human-Machine Analyses
for Characterizing System Failure
Abstract
As machine learning systems move from computer-science laboratories into the open world, their accountability becomes a high priority problem. Accountability requires deep understanding of system behavior and its failures. Current evaluation methods such as single-score error metrics and confusion matrices provide aggregate views of system performance that hide important shortcomings. Understanding details about failures is important for identifying pathways for refinement, communicating the reliability of systems in different settings, and for specifying appropriate human oversight and engagement. Characterization of failures and shortcomings is particularly complex for systems composed of multiple machine learned components. For such systems, existing evaluation methods have limited expressiveness in describing and explaining the relationship among input content, the internal states of system components, and final output quality. We present Pandora, a set of hybrid human-machine methods and tools for describing and explaining system failures. Pandora leverages both human and system-generated observations to summarize conditions of system malfunction with respect to the input content and system architecture. We share results of a case study with a machine learning pipeline for image captioning that show how detailed performance views can be beneficial for analysis and debugging.
Introduction
In light of growing competencies, machine learning and inference are being increasingly pressed into service for analyses, automation, and assistance in the open world. Efforts with machine learning have been undertaken in transportation, healthcare, criminal justice, education, and productivity. Applications include uses of automated perception and classification in high-stakes decisions with significant consequences for people and broader society (?; ?; ?; ?). Standard methods for evaluating the performance of models constructed via machine learning provide a superficial view of system performance. Single-score success metrics, such as the area under the receiver-operator characteristic curve (AUC) or false positive and false negative rates, are computed over test datasets. Such summarizing measures are useful for broad understandings of the statistics of performance and for comparisons across systems. However, they do not provide insights into the details on when and how systems fail. The common metrics on performance are particularly limited for systems composed of multiple components as they fail to reflect how interactions among sets of machine-learned components contribute to errors.
Detailed characterization of system performance through systematic and fine-grained failure analyses has important implications for deploying AI systems in the real world. Identifying and explaining errors at execution time is essential for enabling people to complement or override the system. Understanding when and where errors occur is also a crucial step in detecting and addressing bias. For example, a medical diagnostic system that is 95% accurate can be experienced as being highly unreliable if the bulk of its errors occur when interpreting symptoms from an under-represented population group. Finally, system designers can use detailed error analyses to make informed decisions on next steps for system improvement.
We present a set of hybrid human-in-the loop and machine learning methods named as Pandora that facilitate the process of describing and explaining failures in machine learning systems. We apply these methods to systems that have a human-interpretable input and that integrate multiple learning components. Failure analysis in these systems presents two main challenges. First, the system may exhibit a non-uniform error behavior across various slices of the input space. For instance, the accuracies of a face recognition system may depend on the demographic properties of people (e.g., race, gender, age) (?). Traditional evaluation metrics like error scores and confusion matrices have limited expressiveness in reporting such non-uniformity of error. Second, the complex interactions among the uncertainties of different components can lead to a complex compounding of error that prevents practitioners from understanding the internal dynamics of system failure.
Pandora addresses these challenges by modeling the relationships among input instances, system execution signals, and errors to develop detailed predictive summaries of performance. First, it clusters the input domain into topical clusters constructed either from human-generated content features or from automated system-generated features representing content. Next, it uses the examples in each cluster to learn interpretable decision-tree classifiers for predicting and summarizing conditions of failure. The classifiers provide transparent performance views explaining under which circumstances the system is most likely to err.
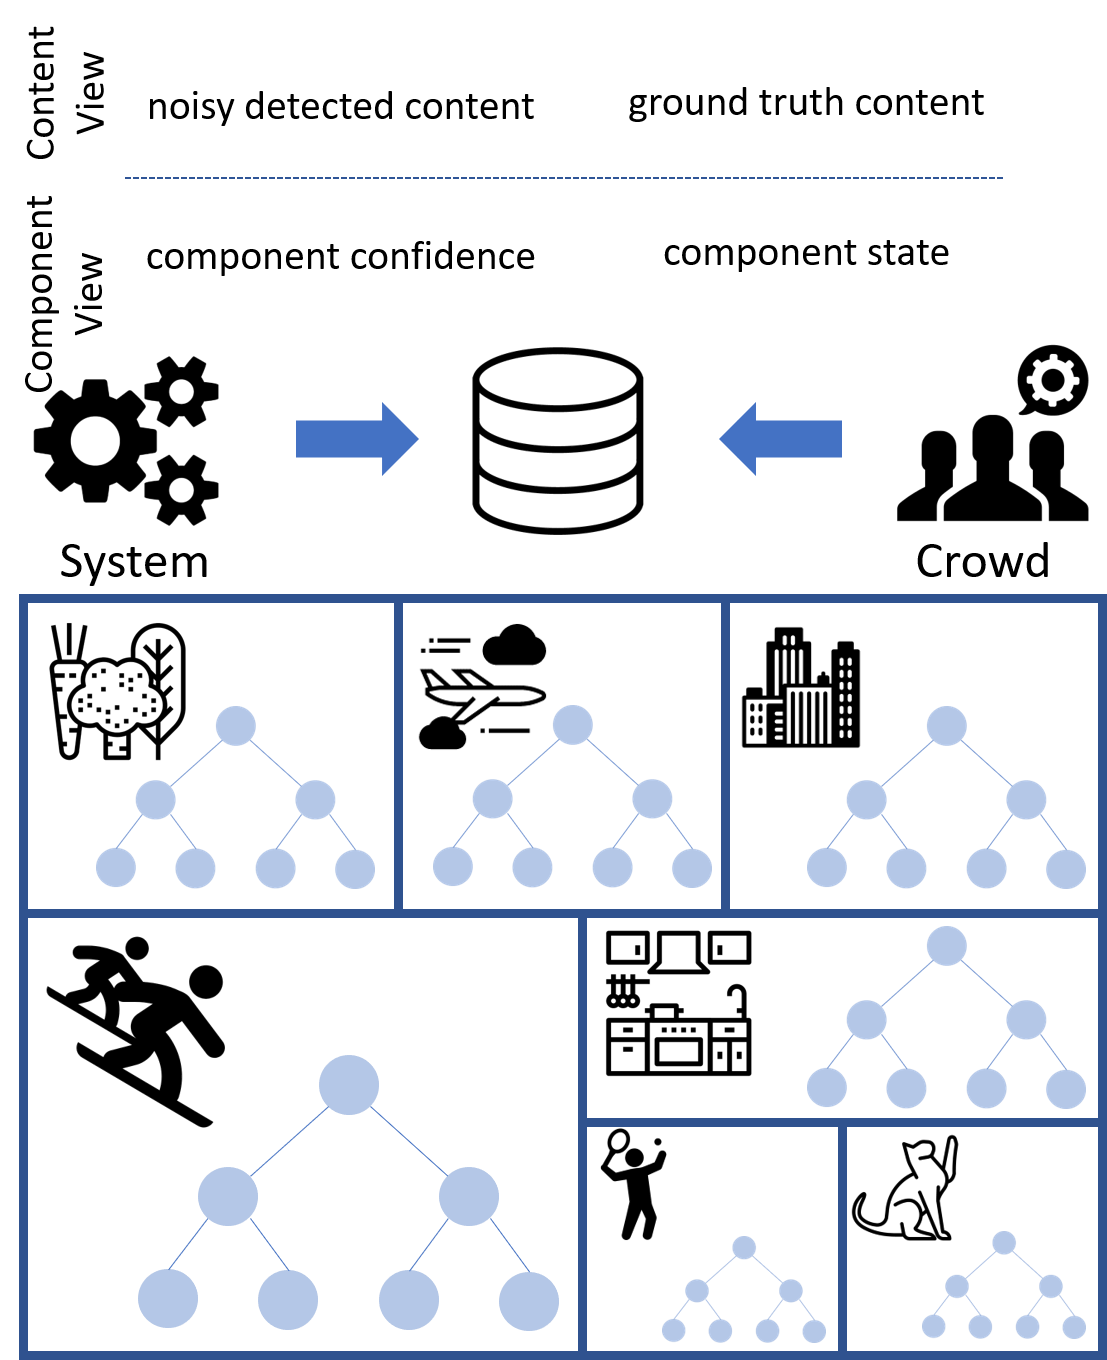
Pandora provides multiple views to highlight different relationships between input data, system execution and system errors. Along one dimension, the views choose the type of data being used for error analysis: signals drawn from content being analyzed or signals collected from component execution. Content-based views use detailed ground truth or automatically detected content (i.e., input data) features to learn common situations associated with poor performance. For instance, a face recognizer could report that the system may make more mistakes in recognizing faces of old men wearing eyeglasses. Component-based views instead model the relationship between the uncertainty as well as the individual performance state of each component and system failures. For a face recognizer that includes a face detector, component-based views can describe how often the system fails when the detector is uncertain (i.e., low confidence) or wrong (i.e., false detection).
The second dimension for generating views varies the source of data used to provide a multi-faceted error analysis. For this, the views can either choose data generated by the system itself or data collected via human computation. The different views created by varying the data source have complementary purposes: Views generated based on system data characterize performance from an inner system perspective, i.e., what the system knows. Views generated based on crowd input describe system performance from an outer user perspective, i.e., what an ideal system should know (ground-truth). The inner perspective is important to teach the system itself about its failures, whereas the outer perspective helps users understand when to expect failures and cannot be created without the input from human computation. The whole process highlights how human computation can be valuable for machine learning not only for simply collecting training data but also for solving complex problems like understanding failure modes.
Figure 1 shows an overview of the approach when applied to an Image Captioning System as a real-world case study. The goal of the system is to automatically generate image captions for given images and it consists of three machine learning components in a pipeline (?). Pandora creates content topical clusters (e.g., city, snowboarding, kitchen etc.) and reports the system performance for each distinct cluster. Most importantly, it generates custom decision trees, which uncover surprising facts about the system behavior relevant to its input conditions and the internal state of its architecture.
In summary, this work makes the following contributions:
-
•
A new systematic approach for describing and explaining system failure in component-based machine learning systems. Pandora supports system designers and machine learning practitioners in understanding system failure and it can be used as an effective tool for debugging and revealing hidden artifacts of system malfunction.
-
•
An end-to-end case study of applying Pandora to a real-world system for image captioning. The application showcases how such an approach can be implemented in practice to a multi-modal system with a rich input domain as well as multiple machine learning components.
-
•
An experimental study for showing and comparing the benefits of the various performance views generated by Pandora.
Background
We first describe our main case study, an image captioning system for generating textual descriptions of images. This system was chosen as one of the winners of the 2015 captioning challenge111http://cocodataset.org/#captions-challenge2015 and is the blueprint for several applications including the provision of descriptions for assisting visually impaired people222https://www.microsoft.com/en-us/seeing-ai/(?). Then, we use this system as a running example to illustrate the functionalities of Pandora. Figure 2 shows the system architecture, consisting of three machine learning components. The first and third components use convolutional neural networks, while the second one is a maximum-entropy language model (?).
Visual Detector. The first component takes an image as an input and detects a list of words associated with recognition scores. The detector recognizes only a restricted vocabulary of the 1000 most common words in the training captions. The vocabulary contains different parts of speech (e.g. verbs, nouns etc.) possibly relevant to the image.
Language Model. This component is a statistical model trained on the human captions for the training images. It generates likely word sequences as captions, based on the words recognized from the Visual Detector, without having access to the input image. The set of the 500 most likely image captions and the respective log-likelihood scores are forwarded to the Caption Reranker. Notice that since the Language Model does not see the image, the log-likelihood captures the linguistic likelihood of the sequence but does not have a notion of how adequate the sentence is for the image.
|
|
|||||
| Content View (When does the system fail?) | ground truth objects list | detected objects list | ||||
| ground truth activities list | detected activities list | |||||
| ground truth count objects | detected count objects | |||||
| ground truth count activities | detected count activities | |||||
| Component View (How does the system fail?) | precision,recall (objects Visual Detector) | avg,std,max,min(confidence Visual Detector) | ||||
| precision,recall (activities Visual Detector) | avg,std,max,min(confidence Language Model) | |||||
| language,commonsense (sentences Language Model) | avg,std,max,min(confidence Caption Reranker) | |||||
| satisfaction (top10_captions Caption Reranker) | confidence Best Caption Visual Detector | |||||
| confidence Best Caption Language Model |
Caption Reranker. The task of the component is to rerank the captions generated from the Language Model and to select the best match for the image. The Reranker uses multiple features including the similarity between the vector representations of both images and captions, the log-likelihood of the sentence from the Language Model, and the length of the sequence. The caption with the highest ranking score is selected as the final best caption.
Dataset. All components are individually trained on the MSCOCO dataset (?), a case library of captioned photos, constructed to define the image captioning challenge. The database contains 160,000 images as well as five human-generated captions for all images. We use images randomly sampled from the validation part of the dataset to evaluate our approach.
Pandora
Problem
We seek to develop tools that provide more transparent views on performance for system designers. The tools should help designers to understand when and how machine-learned classifiers make mistakes. The approach assumes that the system is composed by a set of modules or components and that the inputs and outputs of the components and the system are interpretable by people. Interpretability facilitates analyses of content via human computation. For interpretable, component-based systems, performance views serve as analytical summaries of system quality that answer the following questions:
Q1: When does the system fail? - For a system with a rich input domain or a highly dimensional feature space, evaluation metrics like accuracy, AUC or multi-class confusion matrices do not depict a complete view of system performance. Often, relying only on these generic metrics can hide serious underlying quality issues, especially for data partitions with low representation. Hence, recognizing the input characteristics that are more prominently related to failure, is essential to engineering accountable systems.
Q2: How does the system fail? - When a system is composed or makes use of different machine learning services, errors can originate from different parts of the system. It is also not uncommon that failure is caused as a combinatorial state of multiple smaller and hidden errors in the composing components. Although blame assignment is challenging for such systems (?; ?), it is nevertheless important to know how internal component failures and uncertainties are related to the overall system failure.
Performance views
Pandora uses two types of data to answer the above questions. Content-based views use content features to describe when the system fails, while component-based views use component state features to explain in depth how the system fails. Content and component feature data can be collected from two different data sources: human feedback in the form of crowdsourcing tasks (ground-truth data) or internal system data flows (noisy system signals). Table 1 shows in a grid style a summary of the two dimensions (data type and data source) along with the features being used from each view for the image captioning system. Below, we explain in detail the meaning of these features. In the last part of the section, we also briefly describe how this process would look for another multi-modal interactive system.
Content-based views create a mapping between the input and the overall system failure. For the image captioning system, each input instance is represented by a list of objects and activities. For views created from crowdsourcing data, this list consists of words (verbs or nouns) that crowdsourcing workers think should be mentioned in the final caption. This gives a ground truth perspective to the view and helps system designers to understand the types of input content that the system handles well (or not). Such perspective can also be helpful for reporting performance to customers and end users.
For views created from system data, the list of objects and activities is the list of words recognized from the Visual Detector as shown in Figure 2. Since automatic detection is not always correct, this perspective provides information on how the system’s self-knowledge relates to its output state. For example, by using this analysis, one can identify detections that are commonly linked to system failure.
Component-based views model how internal component dynamics lead to errors. Depending on the data source, features here can express: i) the component output quality as judged by crowdsourcing workers, or ii) the component output confidence as perceived by the component itself. The component output quality is evaluated as follows. For every image in the evaluation dataset, we expose the output of each component to workers and ask them to correct the output, taking into consideration the task of the component and the system as a whole. This feedback simulates the performance of the system with ground-truth output for components, which can then be used to compute quality performance metrics. For instance, workers can flag sentences generated by the Language Model that have bad language or no commonsense (see Table 1). The number of such sentences per image can then be used as a predictive and descriptive feature for output failure. The views built using output quality data show the sensitivity of the system to internal errors.
The component view that models the relationship between component confidence scores and system errors makes use of a number of handcrafted features, computed as follows: For every image, we aggregate the confidence of the component as the average, standard deviation, maximum, and the minimum of all output scores. In particular, the maximum(confidence Caption Reranker) feature represents the final confidence score of the Caption Reranker for the best caption. Besides the individual component scores, the feature set also includes scores linked to the best caption with respect to previous components in the pipeline. For example, if the final caption for an image is ”A man flying through the air on a snowboard”, we aggregate the Visual Detector confidence scores for the composing words (man, flying, air, snowboard). These features are reflected in features confidence Best Caption Visual Detector. Similarly, the feature confidence Best Caption Language Model contains the log-likelihood of the best caption according to the Language Model.
View creation and reports
Now, we describe the process of creating performance views in Pandora and the specific reports associated with each view. The end-to-end process is focused on a sample evaluation dataset chosen by the system designer. The sample might come from the training or test dataset depending on the use case, depending on the goal of explaining the current system behavior on the training data versus debugging errors arising when challenged with a previously unseen test set. Pandora can create generic as well as clustered reports for a given performance view. Generic reports analyze the evaluation dataset as a whole, while clustered reports decompose the analysis according to distinct semantic clusters. As we show in the experimental evaluation, although there is value in extracting generic failure information, clustered reports are more predictive for system performance and they discover cluster-specific errors, which cannot be identified via generic views.
View generation is a two-step process: 1) clustering the evaluation dataset based on content signals, and 2) detailed reporting globally and per cluster. The process generalizes to all views created in Pandora.
Evaluation dataset clustering. To decompose performance evaluation, Pandora initially clusters the evaluation dataset into topical clusters. Each image is represented as a document of objects. Depending on which data source the system designer wants to use (crowd data or system data), the list of objects comes either from the object terms reported by crowdsourcing workers or recognized by the Visual Detector. Note that this list is necessary for any type of clustered performance views (both content and component-based) before generating any report.
We use agglomerative hierarchical clustering (?) and the Euclidean distance as a similarity measure. While other clustering algorithms may also be relevant, the hierarchical clustering representation brings important usability advantages as it gives freedom to users to reduce the number of clusters by easily merging together similar clusters whose performance they want to explain and evaluate jointly. For example, the crowd data clusters in our analysis contain both snowboarding and skiing separately, but it may also be useful to merge and analyze them together as they share the same parent in the cluster hierarchy.
Reports. The content of failure analysis reports (generic and clustered) consists of:
1- Evaluation metrics are computed from human satisfaction provided by crowd workers. Clustered variants aggregate satisfaction over selected clusters, highlighting the topical strengths and the weaknesses of the system.
2- Decision-tree performance predictors are trained as generic or separate decision tree classifiers per cluster using the features part of the performance view. The choice of decision trees was motivated by the interpretability properties of these classifiers. For example, a branch of a decision tree from the component-based views for the image captioning system may summarize failure prediction as: ”If the precision of the Visual Detector is less then 0.8 and there are less than five satisfactory captions for humans in the Caption Reranker, the system fails in 95% of the cases.”. Moreover, system designers can zoom into the decision tree and explore the concrete instances classified in each leaf. This functionality makes decision trees for performance prediction a tool for fine-grained debugging, error reproducibility, and, perhaps most importantly, a tool for humans to decide when to complement and override the system.
Finally, it is important to note that such decision tree classifiers are not unique. As the process of training decision trees tends to find a minimal set of features as splitting conditions, the tree frequently omits features that are correlated with the parents. For more extensive explorations, the system designer can intentionally leave a feature out of the tree to investigate other failure conditions in depth or generate feature rankings, as described next.
3- Feature rankings identify the most informative features in the view for predicting system failure. We compute the mutual information between the feature and system performance (i.e. human satisfaction) as the ranking criterion. The same criterion is used for splitting nodes in the decision trees. Mutual information not only captures the correlation between two variables but also other statistical dependencies that can be useful for failure prediction. Knowing the most important features is beneficial to having a full view of all the failure conditions in the system.
Applications to other systems
Pandora is designed for component-based machine learning systems with human-interpretable input and output for components and for the performance of the system as a whole. We use image captioning as a case study. However, the methodology generalizes to other composable machine learning systems. As an example, consider a multimodal assistant that helps users through single-turn dialog interactions. This hypothetical system combines computer vision for recognizing users as well as speech recognition and dialog systems to understand and communicate with users. The input data is the combination of face images with sound files for human speech. The output is the system response to the human user. This system satisfies the conditions above; the input instances with images and speech are human interpretable as humans can analyze whether the image contains a human face, or transcribe speech. The output of each component (face recognizer, speech recognizer and dialog manager) is human interpretable. Finally, humans can also evaluate the overall system behavior for satisfaction.
Once these properties are verified, adapting Pandora to a new system requires customizing the data collection steps to the system at hand. These customization steps include designing human computation tasks for analyzing the input data content (labeling images and transcribing sound), for correcting the output of each component (face recognition, speech recognition and dialog manager) and for evaluation (analyzing final user satisfaction). In addition to the details of acquiring human effort, customization may also include generating additional features describing system execution to enhance the features given in Table 1 on demand. The analytical process of Pandora would operate in the same way, but on revised features (as per Table 1) developed for the new system to adequately summarize the content, component execution, and final satisfaction.
Crowdsourced Data Collection
In addition to the data flowing between the system components, Pandora makes significant use of data from crowdsourced micro-tasks. These tasks are used for three purposes: 1) system evaluation (for all views), 2) content data (for clustering and for all views using crowd assessments of ground-truth), and 3) component quality features (for component-based views with crowd data). For these purposes, we leverage the task design and dataset we collected in prior work for troubleshooting the image captioning system (?). The dataset had been collected mainly for simulating component fixes with crowdsourcing. We adapted the fix data by generating features that directly express the ground truth input content and the original quality of each component.
System evaluation. There are multiple evaluation metrics for image captioning, including BLEU(1-4) (?), CIDEr (?) and METEOR (?). These metrics are largely adopted from the machine translation domain. They compare the automatic caption to five image captions retrieved from crowdsourcing workers that are made available as part of the MSCOCO dataset. While this evaluation is generally less expensive than directly asking people to report their satisfaction, it does not always correlate well with human satisfaction (?). Hence, we center this study around direct assessments of human satisfaction with the system output. For this task, we show workers an (image, caption) pair and ask them whether they find the caption satisfactory ïf the caption was used to describe the image to a visually impaired user.̈
Content data collection. As we describe each input with a list of recognized words, the task for ground-truth content data collection corresponds to the task of evaluating the Visual Detector. Here, workers correct the list of objects and activities generated by the Visual Detector by adding or removing items from the list. Workers are instructed to include in the list only words relevant to be mentioned in the caption. The resulting list after majority vote aggregation is considered as the input content for the image. The content is used for i) building ground truth clusters from objects, and for ii) generating content feature data where the presence of each word constitutes a separate binary feature.
Component quality feature data collection. Component views with crowd data work on the same clustering as the content views. They build features that express the quality of components. For the dataset on fixes acquired in prior work (?), crowd workers introduced repairs to the component outputs. For the current study, we leverage these fixes to evaluate the original quality state of the components. For instance, by contrasting the output of the Visual Detector before and after the crowd intervention, we can measure both its precision and recall. Similarly, by knowing how many sentences are not commonsense or with bad language from the Language Model, it is possible to find out the percentage of good (or bad) sentences generated by the component. Finally, for the Caption Reranker, workers are allowed to select up to three good captions from the top 10 captions. Based on these signals, we compute features that tell us whether (and how often) the best Reranker caption is selected from workers and whether workers have found any caption in the top 10 set that could be satisfactory.
Quality control. For all crowdsourcing tasks we applied the following techniques for quality control: 1) worker training via examples and online feedback, 2) low-quality work detection based on worker disagreement, and 3) small batching to avoid worker exhaustion and bias reinforcement.
Experimental Evaluation
We now report on the main findings obtained with applying our approach to the image captioning system. The study is based on an evaluation dataset of 1000 images selected randomly from the validation dataset in MSCOCO (?). The evaluation reports that we present here are concrete examples of reports that can be generated with Pandora for various performance views.
| Description | Top 5 objects | Satisfactory |
| baseball | baseball:field:bat:game:ball | 0.800 |
| kitchen | kitchen:counter:cabinets:stove:oven | 0.586 |
| waterfront | water:ocean:beach:man:boat | 0.604 |
| snowboard | snow:snowboard:slope:hill:mountain | 0.750 |
| man | man:phone:cell:tie:hat | 0.455 |
| tennis | tennis:court:racket:player:game | 0.656 |
| trains | train:tracks:station:platform:engine | 0.774 |
| city scene | street:city:traffic:road:people | 0.667 |
| vegetables | vegetables:broccoli:food:plate:table | 1.000 |
| desk | desk:keyboard:laptop:table:computer | 0.724 |
| all clusters | 0.578 |
| Cluster | Human agreement | Content view | Component view |
| baseball | 0.860 | 0.900 | 0.850 |
| kitchen | 0.807 | 0.767 | 0.700 |
| waterfront | 0.871 | 0.670 | 0.750 |
| snowboard | 0.863 | 0.950 | 0.850 |
| man | 0.867 | 0.675 | 0.842 |
| tennis | 0.863 | 0.825 | 0.775 |
| trains | 0.884 | 0.775 | 0.833 |
| city scene | 0.813 | 0.710 | 0.700 |
| vegetables | 0.832 | 1.000 | 1.000 |
| desk | 0.786 | 0.867 | 0.733 |
| all clusters | 0.841 | 0.756 | 0.747 |
| generic model | 0.597 | 0.711 |
| Description | Top 5 objects | Satisfactory |
| baseball | baseball:player:man:ball:field | 0.628 |
| kitchen | sink:kitchen:stove:refrigerator:cabinets | 0.609 |
| tennis | court:man:player:tennis:ball | 0.523 |
| vegetables | plate:table:vegetables:broccoli:food | 0.889 |
| animals | dog:cat:man:bear:bed | 0.321 |
| animals | giraffe:zebra:field:giraffes:zebras | 0.800 |
| trains | train:tracks:street:man:bus | 0.613 |
| skateboard | man:skateboard:skate:trick:person | 0.700 |
| surfing | surfboard:board:wave:water:man | 0.900 |
| desk | computer:table:desk:laptop:keyboard | 0.556 |
| all clusters | 0.578 |
| Cluster | Human agreement | Content view | Component view |
| baseball | 0.851 | 0.890 | 0.790 |
| kitchen | 0.817 | 0.683 | 0.783 |
| tennis | 0.864 | 0.770 | 0.790 |
| vegetables | 0.852 | 0.950 | 0.967 |
| animals | 0.845 | 0.813 | 0.777 |
| animals | 0.890 | 0.800 | 0.925 |
| trains | 0.907 | 0.850 | 1.000 |
| skateboard | 0.870 | 0.950 | 0.750 |
| surfing | 0.940 | 0.900 | 0.900 |
| desk | 0.775 | 0.650 | 0.800 |
| all clusters | 0.841 | 0.786 | 0.780 |
| generic model | 0.628 | 0.678 |
System evaluation
As part of system evaluation, Tables 2 and 4 summarize clusters that were discovered with ground-truth crowd data and system data respectively, and report system performance for each cluster. Each row shows the top five most frequent words for the cluster and the fraction of instances for which crowd workers found the image caption satisfactory. Due to space restrictions, we present results for 10 (out of 30) representative clusters.
Result 1: System performance is non-uniform and varies significantly across topical clusters. The tables highlight with green clusters where the system has a high human satisfaction rate ( 0.75) and with red for those with low human satisfaction rate ( 0.65). For example, we see that the captioning system has a much better performance in crowd data clusters talking about baseball than in clusters about kitchen. Decomposing system performance in this form, provides system designers with insights about the topical strengths and weaknesses of their system.
Result 2: Reports generated for crowd and system data clusters reveal different insights about the system. By contrasting results in both tables, we see that the baseball cluster constructed by crowd annotations has a higher satisfactory rate than the same cluster built with annotations detected by the Visual Detector: 0.8 versus 0.628. This demonstrates that although the system does well for images that indeed contain baseball, it performs poorly for images where the Visual Detector recognizes words related to baseball. This observation provides hints that the Visual Detector has a high recall but low precision for words relevant to the baseball topic.
Performance prediction
Next, we evaluate the performance prediction accuracy of decision trees generated by Pandora, as shown in Table 3 and 5. The accuracy here expresses the fraction of instances for which the decision tree can predict whether the final image caption is going to be satisfactory to crowd workers. Since this is a highly subjective task and people may have slightly different expectations, we include human agreement as a point of reference, i.e., how many workers agree with the majority vote aggregation. The tables highlight in red clusters with the lowest agreement. The main observation with respect to human agreement is that workers have low agreement for images that contain a high number of possibly relevant objects (e.g., kitchen, desk).
The prediction accuracy per cluster is averaged over five folds of cross validation within the cluster data. The last two rows of each table show i) the overall accuracy of decision trees for each view per cluster (i.e., all clusters), and ii) the accuracy of views if they would use a single generic decision tree trained on non-clustered data (i.e., generic model).
Result 3: Cluster-specific models are more accurate in predicting system performance due to the non-uniform distribution of errors and as we show in the next reports, the feature set most predictive for failure is also cluster specific. The discrepancy between generic models and cluster models is lower for component views. This shows that condition rules expressing either the components’ quality or their confidence generalize better than rules about content.
Result 4: Content views and component views are complementary to each other in terms of describing and predicting failure. Although, we do not observe overall differences in the prediction accuracy, for particular clusters one type of view can be better than the other as they describe different failure conditions. For instance, for images where it is crucial to mention specific terms (e.g., snowboard, tennis), content views are more accurate.
Result 5: Performance views trained on system data are at least as accurate as views trained from crowd data. This confirms that features expressing the internal operations of the system can indeed be informative. Although they provide observational evidence versus ground-truth assessments, they contain useful information regarding system confusion. This result highlights the promise of building systems that can predict system failure in real time.
| Generic model Crowd data | tennis Crowd data | Generic model System data | tennis System data |
| cluster obj. | count obj. | cluster obj. | people |
| cluster act. | cluster act. | cat | racquet |
| vegetables | grass | cluster act. | count obj. |
| count obj. | people | sitting | swinging |
| riding | net | bench | grass |
| zoo | swinging | man | riding |
| sitting | man | count obj. | women |
| broccoli | holding | bear | skate |
| snowboarder | crowd | dog | sign |
| rice | swing | broccoli | sitting |
Feature rankings
We also make available feature rankings according to their mutual information with human satisfaction. We note that not all the highly ranked features are present in the final decision tree. This is because the training algorithm adaptively selects as next splitting conditions those features that are most informative after the parent feature has been observed. Thus, feature rankings are still necessary for completely understanding failure conditions.
| Generic model — Crowd data |
| satisfaction(top10_captions Caption Reranker) |
| precision(objects Visual Detector) |
| cluster objects |
| recall(objects Visual Detector) |
| commonsense(sentences Language Model) |
| Generic model — System data |
| max(confidence Best Caption Visual Detector) |
| max(confidence Visual Detector) |
| avg(confidence Visual Detector) |
| cluster objects |
| avg(confidence Best Caption Visual Detector) |
Table 6 shows the 10 best features extracted from content data for the tennis cluster and for the whole evaluation dataset (generic model). The table highlights in gray the features observed in both generic and cluster models.
Result 6: The sets of best features for single models and cluster-specific models have low intersection. Features in the intersection are generic features (e.g., clusterings and counts. However, as we show in our previous results, these features are not sufficient for making instance-based decisions that hold for specialized clusters.
Result 7: Best content features from crowd data can identify terms that indicate whether the system will perform either very well or very poorly. For example, the system has good satisfactory rate for images that contain broccoli. Best features from system-generated content data have a similar function but they are automatically detected terms. From our observations, many of these features are misrecognitions. A prominent example is the feature cat. The Visual Detector detects a cat for 20% of the images, while only 3.8% of the images contain a cat. This result shows that some system execution signals (e.g.,, cat detection) can identify system confusion and these signals can be discovered by Pandora.
Table 7 shows the best features for component views from both crowd and system-generated data. By comparing these sets with those for particular clusters, we note that the intersection is larger for component views. Nevertheless, we notice visible differences in the exact rankings and in the way how these features are used to construct splitting conditions for the decision trees.
Result 8: Component data views reveal concrete facts about system failure such as the respective importance of precision and recall of the Visual Detector, and the confidence of the Visual Detector on the terms included in the final caption.
Decision tree examples
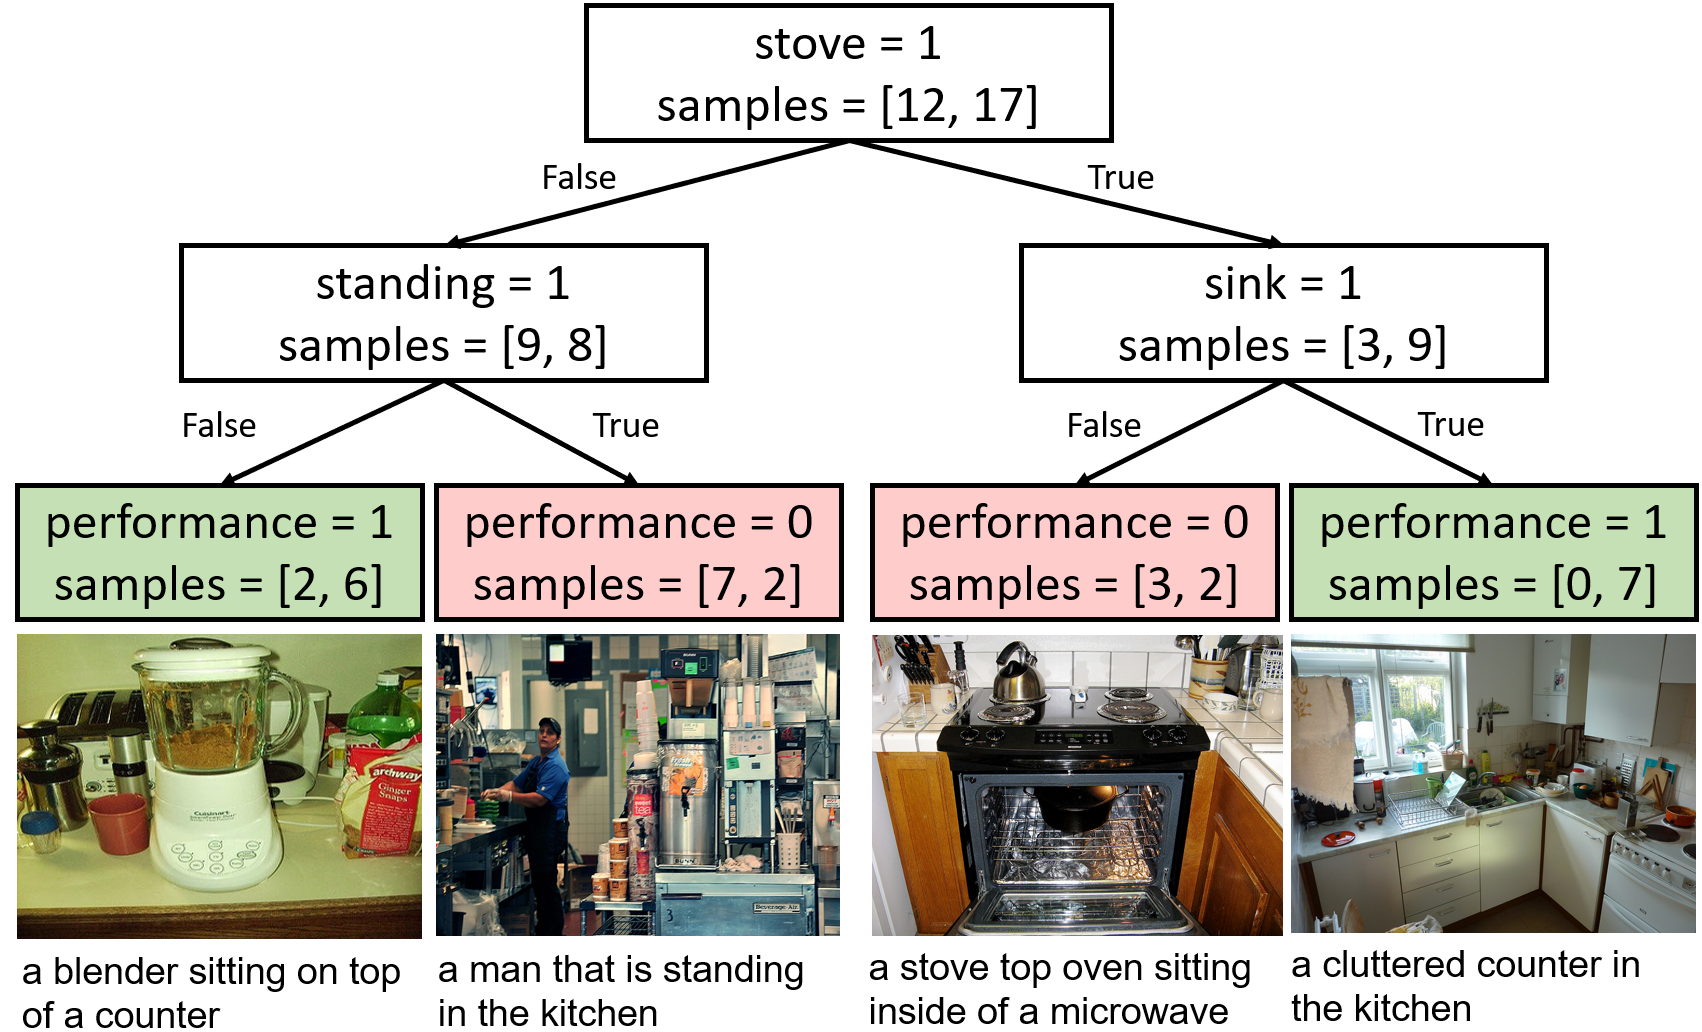
To illustrate the failure conditions learned by decision trees in Pandora, we show tree examples for different types of views. The leaf nodes represent a set of (image,caption) instances, which the decision tree classifies as of the same performance (i.e., green for satisfactory captions and red otherwise). The images displayed below leaf nodes are representative examples for the set. The samples tuple shows the number of instances with non-satisfactory captions in its first element and the number of instances with satisfactory captions in the second. The ratio between the two defines how discriminative a leaf node is. This information is available to system designers who can interactively explore failure leaves.
Figure 3 visualizes the decision tree for a content view from crowd data for the cluster kitchen. An example of a condition failure that this tree expresses is that the system has a high failure rate for images where someone is standing. After investigating the images in this leaf and comparing outputs with human-generated captions, we find that the standing activity is too generic and that people rate more highly captions referring to more specific kitchen-related activities (e.g., cook, prepare).
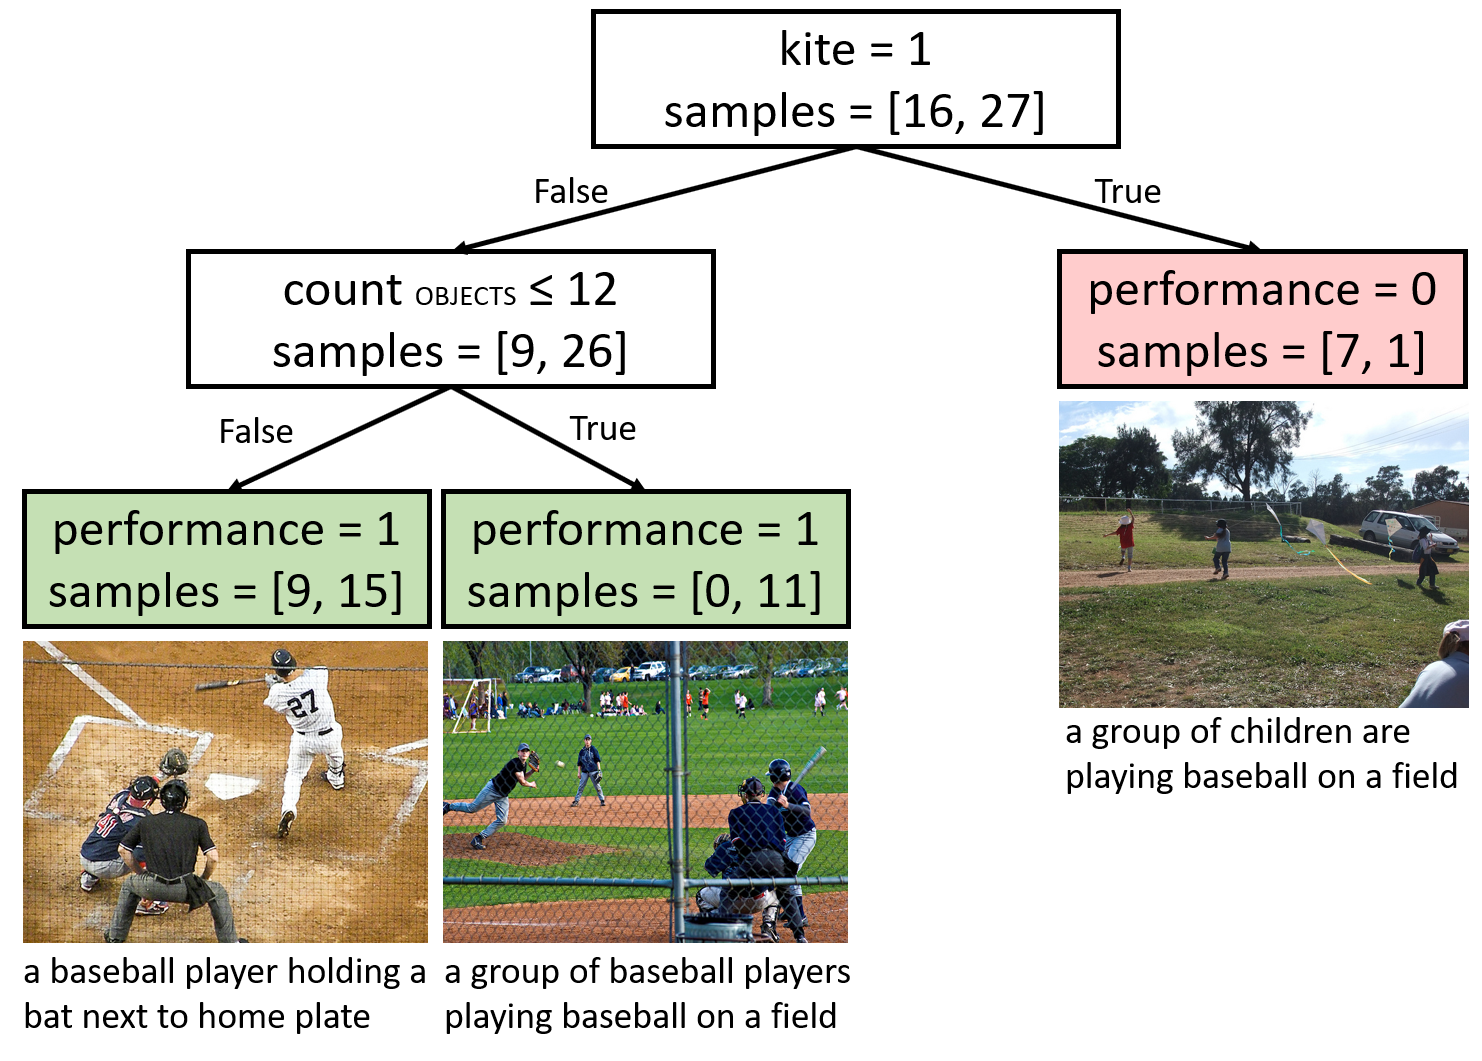
Figure 4 shows a content view built with system data for the cluster baseball. Interestingly, from analyzing the right tree branch (kite=1), one can notice that these are images for which the Visual Detector recognizes both baseball and kite scenes. In fact, the caption is wrong most of the time when the Detector recognizes a kite in this cluster. The system on the other hand performs very well for images in which it does not detect a kite and it detects less than 12 objects.
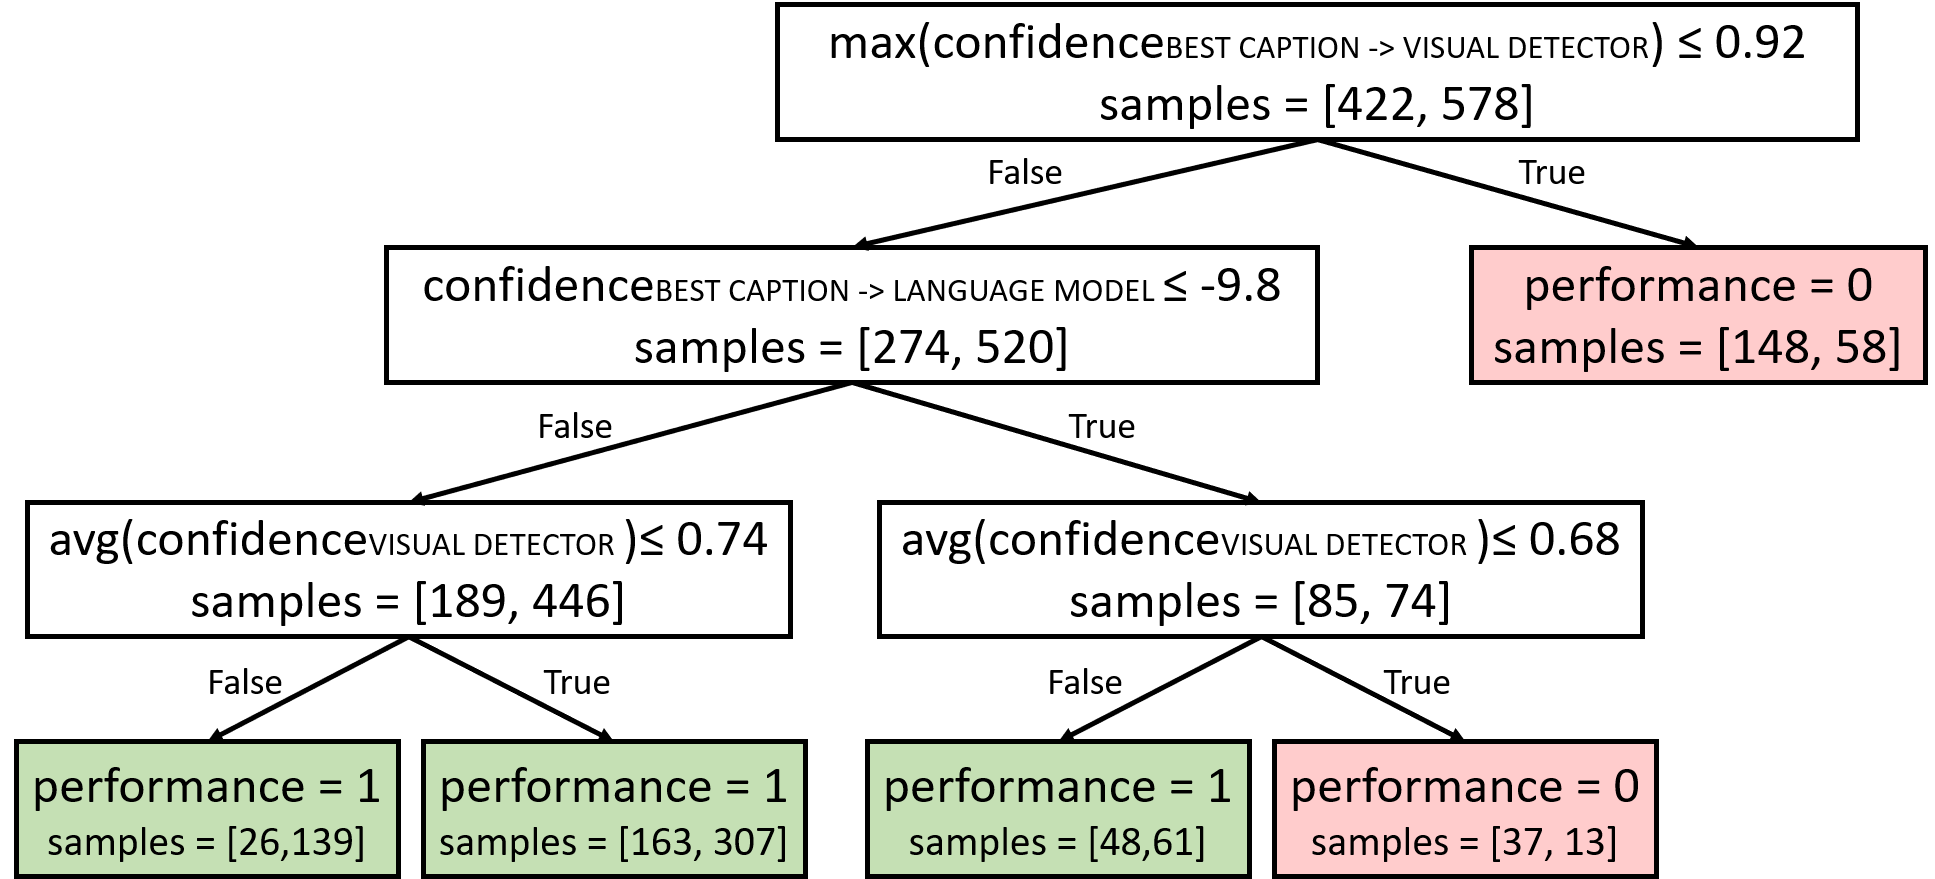
To illustrate more general failure situations, Figure 5 displays a simplified generic-model tree from a component view with system data (component confidences). The tree reveals interesting condition rules to the system designer. For example, it conveys that the system is more likely to fail for instances where the terms mentioned in the final best caption have a low confidence from the Visual Detector ( 0.92).
Related Work
Failure explanation. There has been increasing interest in the intelligibility of algorithmic decision making in the private and public sectors (?). The European Union’s General Data Protection Regulation333https://www.eugdpr.org/ (GDPR) contains articles on the right of explanation for consequential decisions made in an automated manner. DARPA’s project on Explainable AI (?) is aimed at stimulating research to create a suite of machine learning techniques that produce more explainable models, while maintaining a high level of performance. These interests are closely related to the challenges of transparency and interpretability in machine learning (?; ?; ?; ?; ?).
Previous work in error detection (?; ?) and model explanation (?) focused on individual models. Pandora widens the scope with analyses of failures for integrative systems that leverage multiple components. Related work on component-based systems have been aimed at finding weakest links in learning pipelines (?) and troubleshooting by identifying the best components to fix (?). Pandora is complementary to these approaches by providing rich, detailed explanations of error conditions. Related work includes efforts on predicting the behavior of problem-solving systems (?; ?) via learning jointly from evidence about attributes of input instances and about system operation. Other works have used decision trees (?), support vector machines (?), and Bayesian networks (?) for diagnosing (non-learning) machine failure.
Human-AI systems. Human computation has traditionally been an integral part of artificial intelligence systems as a means of generating labeled training data (?; ?). Most recently, there is increasing interest in human computation as a framework for enabling hybrid intelligence systems (?; ?) as forms of fundamental human-machine collaboration. A recent study (?) on use cases for crowdsourcing emphasizes potential and current benefits of seamlessly integrating human computation with machine learning. Related efforts include research on interactive machine learning (?; ?) for building systems that interactively learn from their users.
In the context of system performance analysis, human input has been leveraged for system evaluation (?; ?) and testing (?; ?). Other relevant work on system explanation (?) introduces the concept of explanatory debugging, where the system explains to users the rationale behind predictions of a single classifier, and users correct erroneous outputs for personalizing the system. Our approach extends these efforts by explaining the behavior of component-based systems rather than single classifiers.
Conclusion and Future Work
We presented Pandora, a hybrid human-machine approach to analyzing and explaining failure in component-based machine learning systems. The methodology can provide machine learning practitioners with insights about performance via a set of views that reveal details about failures related to the system input and its internal execution. We demonstrated Pandora with an application to an image captioning system. The results show the power of Pandora as a new kind of lens on the performance of component-based AI systems that can reveal details about failures hidden in the aggregate statistics of traditional metrics.
We see great opportunity ahead for employing the methods to inspect and refine the operation of inferential pipelines. Future directions with this work include the conceptualization of views that can jointly cluster different types of failures and system execution signals and extensions of the methods to provide insights about less interpretable, monolithic learning systems.
References
- [Amershi et al. 2014] Amershi, S.; Cakmak, M.; Knox, W. B.; and Kulesza, T. 2014. Power to the people: The role of humans in interactive machine learning. AI Magazine 35(4):105–120.
- [Amodei et al. 2016] Amodei, D.; Olah, C.; Steinhardt, J.; Christiano, P. F.; Schulman, J.; and Mané, D. 2016. Concrete problems in AI safety. CoRR abs/1606.06565.
- [Anderson et al. 2016] Anderson, P.; Fernando, B.; Johnson, M.; and Gould, S. 2016. Spice: Semantic propositional image caption evaluation. In European Conference on Computer Vision, 382–398. Springer.
- [Attenberg, Ipeirotis, and Provost 2011] Attenberg, J.; Ipeirotis, P. G.; and Provost, F. J. 2011. Beat the machine: Challenging workers to find the unknown unknowns. Human Computation 11(11):2–7.
- [Baehrens et al. 2010] Baehrens, D.; Schroeter, T.; Harmeling, S.; Kawanabe, M.; Hansen, K.; and MÞller, K.-R. 2010. How to explain individual classification decisions. Journal of Machine Learning Research 11(Jun):1803–1831.
- [Banerjee and Lavie 2005] Banerjee, S., and Lavie, A. 2005. Meteor: An automatic metric for mt evaluation with improved correlation with human judgments. In ACL, volume 29, 65–72.
- [Bansal, Farhadi, and Parikh 2014] Bansal, A.; Farhadi, A.; and Parikh, D. 2014. Towards transparent systems: Semantic characterization of failure modes. In European Conference on Computer Vision, 366–381. Springer.
- [Berger, Pietra, and Pietra 1996] Berger, A. L.; Pietra, V. J. D.; and Pietra, S. A. D. 1996. A maximum entropy approach to natural language processing. Computational linguistics 22(1):39–71.
- [Breese and Heckerman 1996] Breese, J. S., and Heckerman, D. 1996. Decision-theoretic troubleshooting: A framework for repair and experiment. In Proceedings of the Twelfth international conference on Uncertainty in artificial intelligence, 124–132. Morgan Kaufmann Publishers Inc.
- [Buolamwini and Gebru 2018] Buolamwini, J., and Gebru, T. 2018. Gender shades: Intersectional accuracy disparities in commercial gender classification. In Conference on Fairness, Accountability and Transparency, 77–91.
- [Caruana et al. 2015] Caruana, R.; Lou, Y.; Gehrke, J.; Koch, P.; Sturm, M.; and Elhadad, N. 2015. Intelligible models for healthcare: Predicting pneumonia risk and hospital 30-day readmission. In Proceedings of the 21th ACM SIGKDD International Conference on Knowledge Discovery and Data Mining, 1721–1730. ACM.
- [Chen et al. 2004] Chen, M.; Zheng, A. X.; Lloyd, J.; Jordan, M. I.; and Brewer, E. 2004. Failure diagnosis using decision trees. In Autonomic Computing, 2004. Proceedings. International Conference on, 36–43. IEEE.
- [Deng et al. 2009] Deng, J.; Dong, W.; Socher, R.; Li, L.-J.; Li, K.; and Fei-Fei, L. 2009. Imagenet: A large-scale hierarchical image database. In Computer Vision and Pattern Recognition, 2009. CVPR 2009. IEEE Conference on, 248–255. IEEE.
- [Dietterich and Horvitz 2015] Dietterich, T. G., and Horvitz, E. J. 2015. Rise of concerns about ai: reflections and directions. Communications of the ACM 58(10):38–40.
- [Fang et al. 2015] Fang, H.; Gupta, S.; Iandola, F. N.; Srivastava, R. K.; Deng, L.; Dollár, P.; Gao, J.; He, X.; Mitchell, M.; Platt, J. C.; Zitnick, C. L.; and Zweig, G. 2015. From captions to visual concepts and back. In IEEE Conference on Computer Vision and Pattern Recognition, CVPR 2015, Boston, MA, USA, June 7-12, 2015, 1473–1482.
- [Goodman and Flaxman 2016] Goodman, B., and Flaxman, S. 2016. Eu regulations on algorithmic decision-making and a “right to explanation”. In ICML workshop on human interpretability in machine learning (WHI 2016), New York, NY. http://arxiv. org/abs/1606.08813 v1.
- [Groce et al. 2014] Groce, A.; Kulesza, T.; Zhang, C.; Shamasunder, S.; Burnett, M.; Wong, W.-K.; Stumpf, S.; Das, S.; Shinsel, A.; Bice, F.; et al. 2014. You are the only possible oracle: Effective test selection for end users of interactive machine learning systems. IEEE Transactions on Software Engineering 40(3):307–323.
- [Gunning 2017] Gunning, D. 2017. Explainable artificial intelligence (xai). Defense Advanced Research Projects Agency (DARPA), nd Web.
- [Horvitz et al. 2001] Horvitz, E.; Ruan, Y.; Gomes, C.; Kautz, H.; Selman, B.; and Chickering, M. 2001. A bayesian approach to tackling hard computational problems. In Proceedings of the Seventeenth conference on Uncertainty in artificial intelligence, 235–244. Morgan Kaufmann Publishers Inc.
- [Jain and Dubes 1988] Jain, A. K., and Dubes, R. C. 1988. Algorithms for clustering data.
- [Kamar, Hacker, and Horvitz 2012] Kamar, E.; Hacker, S.; and Horvitz, E. 2012. Combining human and machine intelligence in large-scale crowdsourcing. In Proceedings of the 11th International Conference on Autonomous Agents and Multiagent Systems-Volume 1, 467–474. International Foundation for Autonomous Agents and Multiagent Systems.
- [Kamar 2016] Kamar, E. 2016. Directions in hybrid intelligence: Complementing ai systems with human intelligence. In IJCAI, 4070–4073.
- [Kautz et al. 2002] Kautz, H.; Horvitz, E.; Ruan, Y.; Gomes, C.; and Selman, B. 2002. Dynamic restart policies. Aaai/iaai 97:674–681.
- [Kulesza et al. 2015] Kulesza, T.; Burnett, M.; Wong, W.-K.; and Stumpf, S. 2015. Principles of explanatory debugging to personalize interactive machine learning. In Proceedings of the 20th International Conference on Intelligent User Interfaces, 126–137. ACM.
- [Lakkaraju et al. 2017] Lakkaraju, H.; Kamar, E.; Caruana, R.; and Leskovec, J. 2017. Interpretable & explorable approximations of black box models. arXiv preprint arXiv:1707.01154.
- [Lin et al. 2014] Lin, T.; Maire, M.; Belongie, S. J.; Hays, J.; Perona, P.; Ramanan, D.; Dollár, P.; and Zitnick, C. L. 2014. Microsoft COCO: common objects in context. In Computer Vision - ECCV 2014 - 13th European Conference, Zurich, Switzerland, September 6-12, 2014, Proceedings, Part V, 740–755.
- [Nushi et al. 2017] Nushi, B.; Kamar, E.; Horvitz, E.; and Kossmann, D. 2017. On human intellect and machine failures: Troubleshooting integrative machine learning systems. In Proceedings of the Thirty-First AAAI Conference on Artificial Intelligence, February 4-9, 2017, San Francisco, California, USA., 1017–1025.
- [Papineni et al. 2002] Papineni, K.; Roukos, S.; Ward, T.; and Zhu, W.-J. 2002. Bleu: a method for automatic evaluation of machine translation. In ACL, 311–318. ACL.
- [Parikh and Zitnick 2011] Parikh, D., and Zitnick, C. L. 2011. Finding the weakest link in person detectors. In Computer Vision and Pattern Recognition (CVPR), 2011 IEEE Conference on, 1425–1432. IEEE.
- [Poursabzi-Sangdeh et al. 2017] Poursabzi-Sangdeh, F.; Goldstein, D. G.; Hofman, J. M.; Vaughan, J. W.; and Wallach, H. 2017. Manipulating and measuring model interpretability. In NIPS 2017 Transparent and Interpretable Machine Learning in Safety Critical Environments Workshop.
- [Ribeiro, Singh, and Guestrin 2016a] Ribeiro, M. T.; Singh, S.; and Guestrin, C. 2016a. Model-agnostic interpretability of machine learning. arXiv preprint arXiv:1606.05386.
- [Ribeiro, Singh, and Guestrin 2016b] Ribeiro, M. T.; Singh, S.; and Guestrin, C. 2016b. Why should i trust you?: Explaining the predictions of any classifier. In Proceedings of the 22nd ACM SIGKDD International Conference on Knowledge Discovery and Data Mining, 1135–1144. ACM.
- [Russell, Dewey, and Tegmark 2015] Russell, S. J.; Dewey, D.; and Tegmark, M. 2015. Research priorities for robust and beneficial artificial intelligence. AI Magazine 36(4).
- [Salay, Queiroz, and Czarnecki 2017] Salay, R.; Queiroz, R.; and Czarnecki, K. 2017. An analysis of ISO 26262: Using machine learning safely in automotive software. CoRR abs/1709.02435.
- [Salisbury, Kamar, and Morris ] Salisbury, E.; Kamar, E.; and Morris, M. R. Toward scalable social alt text: Conversational crowdsourcing as a tool for refining vision-to-language technology for the blind.
- [Sculley et al. 2015] Sculley, D.; Holt, G.; Golovin, D.; Davydov, E.; Phillips, T.; Ebner, D.; Chaudhary, V.; Young, M.; Crespo, J.; and Dennison, D. 2015. Hidden technical debt in machine learning systems. In Advances in Neural Information Processing Systems 28: Annual Conference on Neural Information Processing Systems 2015, December 7-12, 2015, Montreal, Quebec, Canada, 2503–2511.
- [Shinsel et al. 2011] Shinsel, A.; Kulesza, T.; Burnett, M.; Curran, W.; Groce, A.; Stumpf, S.; and Wong, W.-K. 2011. Mini-crowdsourcing end-user assessment of intelligent assistants: A cost-benefit study. In Visual Languages and Human-Centric Computing (VL/HCC), 2011 IEEE Symposium on, 47–54. IEEE.
- [Steinfeld et al. 2007] Steinfeld, A.; Bennett, S. R.; Cunningham, K.; Lahut, M.; Quinones, P.-A.; Wexler, D.; Siewiorek, D.; Hayes, J.; Cohen, P.; Fitzgerald, J.; et al. 2007. Evaluation of an integrated multi-task machine learning system with humans in the loop. In Proceedings of the 2007 Workshop on Performance Metrics for Intelligent Systems, 168–174. ACM.
- [Vaughan 2017] Vaughan, J. W. 2017. Making better use of the crowd. Technical report, Working paper.
- [Vedantam, Zitnick, and Parikh 2015] Vedantam, R.; Zitnick, L.; and Parikh, D. 2015. Cider: Consensus-based image description evaluation. In CVPR, 4566–4575.
- [Ware et al. 2001] Ware, M.; Frank, E.; Holmes, G.; Hall, M.; and Witten, I. H. 2001. Interactive machine learning: letting users build classifiers. International Journal of Human-Computer Studies 55(3):281–292.
- [Widodo and Yang 2007] Widodo, A., and Yang, B.-S. 2007. Support vector machine in machine condition monitoring and fault diagnosis. Mechanical systems and signal processing 21(6):2560–2574.
- [Zhang et al. 2014] Zhang, P.; Wang, J.; Farhadi, A.; Hebert, M.; and Parikh, D. 2014. Predicting failures of vision systems. In Proceedings of the IEEE Conference on Computer Vision and Pattern Recognition, 3566–3573.