Unfolding the Complexity of the Global Value Chain: Strength and Entropy in the Single-Layer, Multiplex, and Multi-Layer International Trade Networks
Abstract
The worldwide trade network has been widely studied through different data sets and network representations with a view to better understanding interactions among countries and products. Here we investigate international trade through the lenses of the single-layer, multiplex, and multi-layer networks. We discuss differences among the three network frameworks in terms of their relative advantages in capturing salient topological features of trade. We draw on the World Input-Output Database to build the three networks. We then uncover sources of heterogeneity in the way strength is allocated among countries and transactions by computing the strength distribution and entropy in each network. Additionally, we trace how entropy evolved, and show how the observed peaks can be associated with the onset of the global economic downturn. Findings suggest how more complex representations of trade, such as the multi-layer network, enable us to disambiguate the distinct roles of intra- and cross-industry transactions in driving the evolution of entropy at a more aggregate level. We discuss our results and the implications of our comparative analysis of networks for research on international trade and other empirical domains across the natural and social sciences.
I Introduction
Network perspectives have long been advocated to investigate international trade among countries Allard et al. (2017); Caldarelli et al. (2012, 2018); Cingolani et al. (2017); Cristelli et al. (2015); De Benedictis and Tajoli (2011); Fagiolo et al. (2009); Formichini et al. (2018); Garlaschelli and Loffredo (2004, 2005); He and Deem (2010); Hidalgo et al. (2007); Hidalgo and Hausmann (2009); Serrano and Boguná (2003); Tacchella et al. (2012), and to study several other economic systems, including the global economy of transnational credit and investments, supply chains and production markets Schweitzer et al. (2009). The idea of representing the worldwide trade system as a complex network can be traced back to the 20th century De Benedictis and Tajoli (2011), when it was used to describe the patterns of international transactions among countries before World War II. Different frameworks have helped researchers to better understand how countries interact with each other in the different industries of the economy as well as to uncover the intricacies that might affect countries’ competitive advantage and economic performance Hidalgo and Hausmann (2009); Tacchella et al. (2012).
Different network models and representations have been proposed to describe the structure of the worldwide trade network. The most common, perhaps, is the single-layer framework De Benedictis and Tajoli (2011), where the countries are represented as the nodes of the network and economic transactions as directed edges that are established from (to) one country to (from) another when the former exports (imports) products of services to (from) the latter. Using this approach, researchers have shed light on a number of structural features of trade. For example, it has been suggested that the worldwide trade network is characterized by a community structure Barigozzi et al. (2011a, b); Piccardi and Tajoli (2012), a heavy-tailed degree distribution Fagiolo et al. (2009), and small-world and clustering properties Serrano and Boguná (2003). Another widely adopted representation of trade is the bipartite network, which is a special case of the single-layer network characterized by two sets of distinct nodes (e.g., countries and products) such that connections are only allowed between nodes in different sets (e.g., a country to the products exported or imported) Newman (2018). For instance, using the bipartite representation, it has been shown that topological changes of the network can be regarded as early signals of economic downturns in the worldwide trade Saracco et al. (2015). Additionally, researchers have used the bipartite network representation to unveil the competitiveness of countries and the complexity of products from trade data Cristelli et al. (2013); Hidalgo and Hausmann (2009).
Recently, there has been a growing interest in examining several economic systems using multiplex and multi-layer networks Battiston et al. (2014); Kivelä et al. (2014). Because international trade unfolds within and across industries and the countries can be involved in multiple stages of production along the global value chain, using network frameworks in which industries can be represented as the layers of the network and connections among countries can be investigated through the lenses of such layers can offer invaluable insights into the structure of trade. For instance, recent studies have adopted a multiplex network perspective to investigate the role of layer-specific local constraints in shaping international trade Mastrandrea et al. (2014), to simulate the emergence and unfolding of cascading failures in the trade system Lee and Goh (2016), to study the structural position and influential role of countries based on betweenness centrality measures Ghariblou et al. (2017). More recently, other studies have drawn on multi-layer networks to investigate the structural organization of the worldwide trade Alves et al. (2018) and the impact of technological innovations on industrial products Formichini et al. (2018).
A network representation should be adopted when it has clear advantages over the others regarding the quality of the information that can be extracted from trade data and the suitability of the framework for capturing salient topological features of the underlying structure and dynamics of trade. While multiplex and multi-layer networks have been increasingly used to study trade over recent years, the actual benefits of using more complex network structures over simpler and more parsimonious ones still remain to be fully investigated. In this work, we take a step in this direction and propose a general framework for investigating the relative advantages of using the single-layer, multiplex, and multi-layer networks for representing international trade. To this end, we draw on trade data to construct the global value chain of the worldwide production network. We focus on one specific network property—node strength—and show how the distribution of such property varies from one network representation to the other. We further shed light on the heterogeneity of strength in the system by computing entropy and its evolution over time, and show that different ways of aggregating economic transactions (i.e., by country, by country and industry, and by country and combinations of industries) enable different market structures and sources of heterogeneity to be detected.
The article is organized as follows. First, we present the data and the methods (Section II.1). We then outline the approach to building each network representation (Section II.2). Next, in Section III, we describe a number of measures for computing the strength of nodes in each network representation, and use these measures to construct and compare the strength distributions. We further investigate differences between the three networks by measuring the entropy of strength and assessing how heterogeneously trade value is distributed in each network. Finally, we focus on the evolution of entropy in each network, and uncover the components of trade that are responsible for the overall trend observed at the aggregate level. In Section IV, we summarize and discuss our findings.
II Materials and Methods
II.1 The Data Set
Our analysis draws on the World Input-Output Database (WIOD) Timmer et al. (2015). This database contains information about the transactions among countries, including European Union countries and other major countries within the period from 2000 to 2014. Moreover, the database provides details on transactions within and between industries and the final demand, including transactions involving the same country within and across industries, thus enabling us to analyze the production stages along the whole global value chain.
For every year, transactions among countries are expressed in millions of US dollars, in current prices, and a matrix representing the world input-output table (WIOT) is provided. The final demand is articulated into five distinct components: the final consumption expenditure, the final consumption expenditure by non-profit institutions serving households (NPISH), the final consumption expenditure by government, the gross fixed capital formation, and the changes in inventories and valuable. Because our study is directly concerned with the values (weights) of transactions, and because changes in inventories can be both positive and negative over the years, we filtered out from the analysis the individual transactions involving the final demand that were associated with a total negative value. Notice that such negative values could only be found in the multi-layer network where transactions are disaggregated within and between industries. As a result of this filtering, only approximately 0.03% of observations per year were removed. A detailed description of the data set can be found in References Alves et al. (2018); Timmer et al. (2015).
II.2 Building the Single-Layer, Multiplex, and Multi-Layer Networks
We started our analysis by representing the WIOT as a network. Traditionally, the worldwide trade network has been investigated as a single-layer (or monoplex) network Barigozzi et al. (2011a, b); Piccardi and Tajoli (2012); Saracco et al. (2015); Serrano and Boguná (2003). Thus, a first approach to studying the WIOD would be to extract information about the dynamics of the interactions among countries by focusing on the single-layer representation of the network. In this representation, a directed link is established from one country to another country if there is a transaction from to . Moreover, the intensity of each economic transaction is given by the weight of the link connecting the countries, which is equal to the total amount of value (in US dollars) exchanged in the transaction.
Formally, we define our single-layer network as a directed graph given by , where is a set of nodes, with equal to the number of countries (), is a set of directed edges between pairs of nodes (including self-loops), and is the set of the weights associated with the edges. Thus, a given element of the adjacency matrix of the single-layer network can be defined as
| (1) |
For example, let us consider a simplified version of the WIOT where there are only five countries (, , , , and ), and three different production sectors (, , and ). In the single-layer representation, all transactions from one country to another country across the different production sectors are collapsed into one single layer, and contribute to a single directed link , with weight equal to the sum of all transactions from country to country , as represented in Figure 1A. Notice that, in this representation, we cannot distinguish between transactions that take place within (and across) different production sectors.
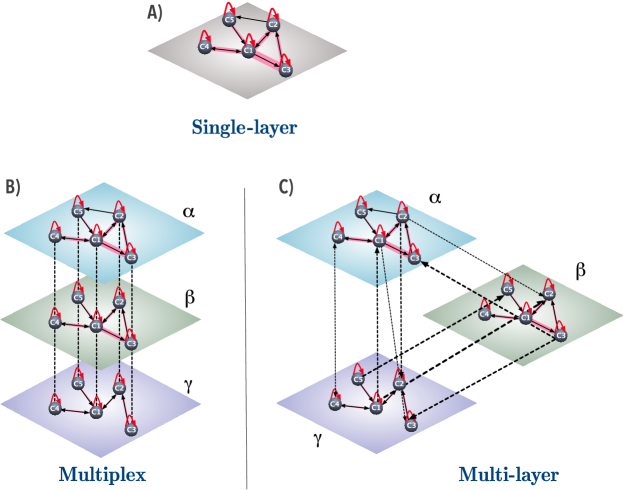
To properly distinguish between transactions according to the production stages from which they originate, we can introduce the concept of layer and represent the complex system of interactions among countries in different industries as a multiplex network Mastrandrea et al. (2014). In this network representation, layers, each representing a distinctive industry, are populated by countries. In each layer , a connection is established from country to country if there is an economic transaction from country to country in layer . These within-layer transactions are referred to as intra-layer connections. Moreover, each country is assumed to be connected to itself across any two layers and , and these inter-layer connections represent the only couplings between industries. Formally, we can define the multiplex network as a pair , where is a family of directed graphs associated with the layers of , and is the set of interconnections between (the same) nodes in a different layers. Thus, the intra-layer adjacency matrix of each directed graph will be denoted by , where:
| (2) |
for and , where is the sum of the values of all transactions originating from country within a particular industry and directed towards country in any other industry (including itself).
In our simple example, the multiplex representation of trade implies that now there are three layers representing the different production sectors, and we can therefore distinguish between transactions among countries in different sectors (see Figure 1B). Moreover, the weights of the transactions are now split among the sectors. For instance, in the single-layer case, the intensity of the transaction from country to country is very strong and is represented by a very thick line (Figure 1A), whereas, in the multiplex case, the same link connecting the two countries can be found in two distinct layers ( and ), and thus the intensity of the link in each layer varies. Notice that the sum of the weights in each layer is equal to the weight of the corresponding link in the single-layer representation, that is, . However, the cross-layer connections have no empirical interpretation as they simply serve the purpose of ensuring node alignment across layers. A multiplex network representation of international trade therefore neglects transactions that occur between different countries across different layers as well as transactions that involve the same country across layers.
The multi-layer network is indeed the only structure that can capture all such interactions among countries and industries and that can fully represent the information provided by the WIOT Alves et al. (2018). As in the case of the multiplex network, in the multi-layer network, each layer represents a different industry, and each layer is populated by the same number of nodes representing the countries. The main difference between a multiplex and a multi-layer network lies in the way in which the connections are represented. In the multi-layer network, the intra-layer connections represent the transactions between countries that originate from, and terminate at, the same industry, whereas the cross-layer connections refer to the transactions that occur among countries across different sectors. Formally, we define a multi-layer network as a pair , where is a family of directed graphs associated with the layers of , and is the set of interconnections between nodes belonging to different graphs and with . Formally, is a family of directed graphs , where , and . Notice that, unlike the multiplex network, the multi-layer network allows the same country to be involved in economic transactions with itself across layers (i.e., ).
The definition of the multi-layer network is similar to the one of the multiplex network, except for the way in which the intra-layer weights and the cross-layer connections are defined. Formally, we can define the element of the intra-layer adjacency matrix of each graph as
| (3) |
where: ; ; ; and is the sum of the weights associated with all transactions originating from country within a particular industry and directed to country within the same industry . Thus, an intra-layer link between country and country in industry is established when there is at least one transaction between and in .
The element of the cross-layer adjacency matrix corresponding to the set of interconnections can be defined as
| (4) |
where ; ; ; ; , and is the sum of the weights associated with all transactions originating from country within a particular industry and directed towards country in industry . Thus, a cross-layer link between country in industry and country in industry is established when there is at least one transaction between and across the corresponding industries.
Figure 1C illustrates the multi-layer network using our example of five countries and three industries. The weights are now re-distributed among the intra- and cross-layer connections and not only among the intra-layer connections as was the case with the multiplex network. This enables us to extract more information from the WIOT, and properly capture the roles that countries play in the various production stages within the global value chain. Notice that, to recover the weights of the single-layer network, we need to sum the weights within and between layers—i.e., .
III Results
We started by computing the in- and out-strength distributions for each network. The in-strength of a node is defined as the sum of the weights of all edges pointing to node . Analogously, the out-strength of a node is defined as the sum of the weights of all edges departing from node . For the single-layer network, the in- and out-strengths of node can be formalized, respectively, as
| (5) |
Using the above definitions, we can compute the in- and out-strength sequences of the single-layer network of length equal to , i.e., . These sequences can then be used to obtain the strength distributions. To this end, we calculated the frequencies with which a given value of strength appears in the network by binning the data and computing the frequency of finding a specific value of strength in a given bin.
Figure 2 shows that, while there is no clear heavy-tailed behavior, the majority of nodes tend to have a small strength, whereas some have disproportionally large values. Moreover, this tendency towards heterogeneity seems to become more pronounced as time goes by.
Next, we define node strength for the multiplex and multi-layer networks. In the multiplex network, each layer is associated with a directed graph to which Equation (5) can be applied to compute the strengths. Thus, for each layer , we can define the in- and out-strengths, and of node , respectively, as
| (6) |
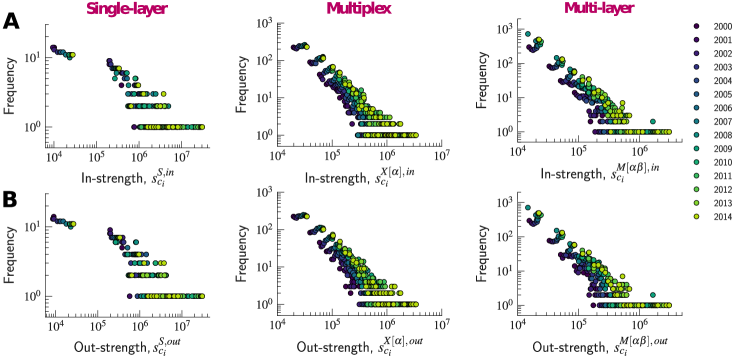
By calculating and for every node in every layer , we obtain two strength sequences of maximum length and , respectively, each equal to . Note that the actual length of the sequence may vary from year to year depending on whether some edges connecting countries within industries are absent from the network. Both sequences are therefore longer than the strength sequences obtained with the single-layer network (). In fact, in the multiplex network, we are able to measure the distinct contribution of each industry to the total strength of a country. One can also recover the strength sequences of the single-layer network by computing and . In the case of the multiplex network, we can thus disentangle the strengths of countries across industries, and measure the contribution of each country to the total value exchanged in each industry. A simple plot of the distribution of strengths (Figure 2) shows that the node strengths concentrate within a much smaller range of values than was the case with the single-layer network. Nevertheless, the in- and out- strength distributions appear to be more heavy-tailed than the ones of the single-layer network, thus suggesting that countries’ competitiveness and market shares differ from one industry to another.
While the multiplex network enables us to uncover the contributions of each country to the value exchanged in each industry, it does not offer information on each country’s contribution to the value exchanged between industries. To rectify this shortcoming, we constructed the multi-layer network in which edges can connect countries both within and across layers. To properly capture the distinction between these two types of edges, the in- and out-strengths, and , of node can be formally defined, respectively, as
| (7) |
By calculating and for every node and for every pair of layers , we obtain two strength sequences of maximum length and , respectively, each equal to . Once again, the actual length of the sequence may vary from year to year because some edges connecting some countries in some industries to other countries in other industries might be absent from the network. Both sequences are therefore longer than the strength sequences obtained with the multiplex network () and the single-layer network ().
Given the above definitions, we can easily recover the node strength sequences of the multiplex network by summing the strengths over the layers, i.e., and . Moreover, we can recover the strength sequences of the single-layer network by summing the strengths over all pairs of layers, i.e., and .
Using the definition given by Equation (7), we can distinguish between strengths associated with different layers as well as between strengths originated from transactions occurring within the same layer and transactions between different layers along the global value chain. Uncovering distinct weights for different types of edges has the effect of changing the way the weights are distributed among edges and, as a result, might affect the shape of their distributions. Indeed, Figure 2 suggests that the multi-layer network is characterized by values of node strength that (by construction) concentrate within a much smaller range than was the case with the single-layer and the multiplex networks. However, most interestingly, in the case of the multi-layer network, the strength distributions seem to exhibit a clearer heavy-tailed behavior than was the case with the distributions in the other two networks.
A more suitable topology for representing the trade system, such as the multiplex or the multi-layer network, can provide us with a more detailed description of the interactions among countries and industries. In particular, a multi-layer representation can offer new insights into the role each country plays at the local level, in each industry, and at the same time it can unveil properties of the network at the global level, as suggested by the strength distribution with different ranges of values. Thus, by changing the level of analysis of the interactions among countries and industries, from the single-layer to the multiplex and the multi-layer networks, we are able to extract and analyze more information about production stages, the structure of the global value chain, and the different roles of countries and products in the international production network.
To quantify the information gained from one representation to another, in what follows we shall propose to evaluate a metric for characterizing and comparing the diversity of each network. Traditionally, a measure that has been widely used to describe the distribution of a given amount of a resource across the various elements of a system is the Shannon entropy of the resource Battiston et al. (2014). In our case, the resource is the total value exchanged among the countries, and the elements across which this value can be distributed are the various (combinations of) transactions among countries. Thus, entropy aims to measure the extent to which the total traded value is uniformly distributed among transactions or rather it is concentrated on a small set of economic transactions. Moreover, since the level of granularity varies across the various network representations of trade, we would expect entropy to take on different values reflecting the different distributions of values across countries and industries. Formally, the entropies and of the in- and out-strengths observed in a trade network can be defined, respectively, as
| (8) |
where
| (9) |
In particular, we have: (i) , , and in the case of the single-layer network; (ii) , , and in the case of the multiplex network; and (iii) , , and in the case of the multi-layer network.
So conceived of, the entropy of in- or out-strength captures the degree to which in- or out-strength is uniformly distributed across the system Aleta and Moreno (2018); Battiston et al. (2014). In particular, entropy is equal to zero in the limiting case where the entire value traded in the system is concentrated on one strength. For example, this is the (unrealistic) case in which only one country imports or exports the whole value from or to other countries. Conversely, entropy takes its maximum value ( or ) when the entire value is uniformly distributed over the different strengths. Therefore, the higher the value of entropy, the more uniformly the total value traded in the system is distributed across the various in- and out-strengths. Comparing the entropies of distributions of different event spaces characterized by a different number of possible outcomes could be problematic, precisely because entropy scales with such number of outcomes and can thus take on different maximum values. Therefore, because our aim was to compare entropies across the three different networks characterized by three different event spaces, we normalized each entropy by dividing it by its possible maximum value or in the corresponding network.
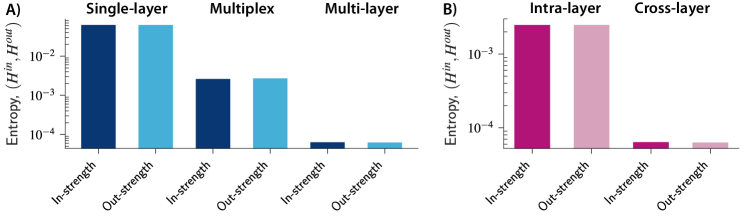
Figure 3A shows the entropy for the in- and out-strengths in the three networks in 2000. As we move from a simple representation to a more complex structure, the entropy decreases, thus suggesting that a small set of economic transactions tend to attract a disproportionally large amount of the total value traded in the system. At the same time, transactions become more similar to each other and the total value becomes more uniformly distributed at a global level when transactions are aggregated within industries (in the multiplex network) and within countries (in the single-layer network). Moreover, the multi-layer representation allows us to distinguish between strengths related to intra-layer connections and strengths associated with cross-layer transactions between different industries. Figure 3B shows the entropies of the in- and out-strengths related to intra- and cross-layer connections in 2000. The results suggest that there is much more diversity in the way value is distributed across the cross-layer connections (transactions among different industries) than across the intra-layer connections (transactions within industries). Thus, by further increasing the granularity of the level of analysis, we can uncover heterogeneous market structures that would otherwise remain concealed at a more aggregate level.
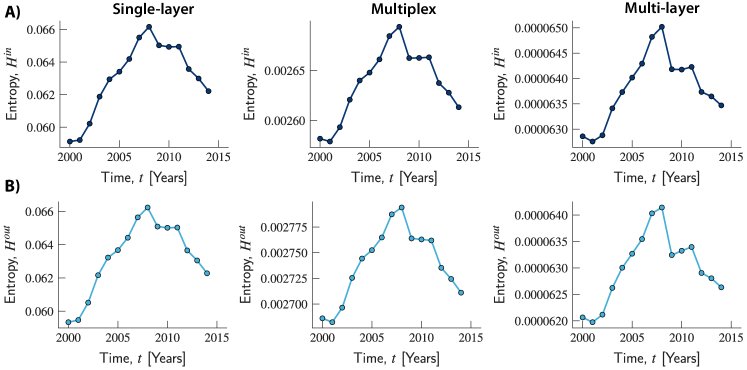
Next, we shall focus on how entropy changed over time, and whether different evolution trends can be uncovered in the three network structures. To this end, we calculated the entropy of the in- and out-strengths for the single-layer, multiplex and multi-layer networks for every year from 2000 to 2014. Figure 4 suggests that a consistent trend can be observed across the three networks. In 2001, entropy began to increase steadily over time, reaching its local maximum in 2008, at a time in which the global economic downturn was at its peak. In 2009, entropy started a declining trend that continued over time for the whole observation period (apart from a slight increase in 2010 and 2011 in the multiplex and multi-layer networks). Moreover, across all years, the relationship among the entropies of the three networks is consistent with the findings in Figure 3. Over time, entropy in the multi-layer network remained at lower values than in the multiplex network, which in turn was characterized by lower values than the single-layer network.
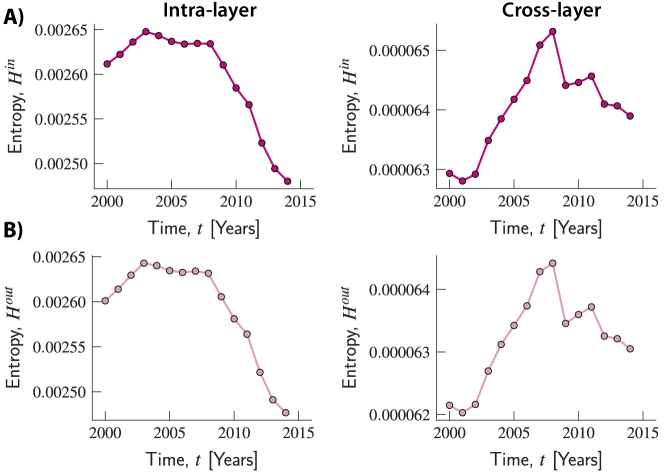
To further explore the evolution of entropy in the multi-layer representation, and the interplay between its components, we computed the entropies related to the intra- and cross-layer strengths. Figure 5 suggests that what is responsible for the increasing trend of the overall entropy observed in the multi-layer network is the component associated with cross-layer transactions. Indeed, while this increased over time until 2008, the component related to intra-layer connections slightly increased up to 2003 and then remained fairly stable until 2008. Both components then started a declining trend, although the decline was much more pronounced for the entropy related to intra-layer connections which therefore seems to be the driving force underlying the decline in global entropy. Moreover, across all years, the entropy related to intra-layer connections took values that are comparable to those observed in the multiplex network. By contrast, values of entropy related to cross-layer connections were always at a lower scale, and can therefore be seen as responsible for the lower total values compared to the ones observed in the other two networks. Once again, using a finer-grained network representation of trade can unmask market structures and sources of heterogeneity in the system that would otherwise remain undetected if values were aggregated across transactions and simpler (and less accurate) structures were used.
IV Discussion
International trade among countries can be investigated from different perspectives and at different levels of detail Allard et al. (2017); Caldarelli et al. (2012, 2018); Cingolani et al. (2017); Cristelli et al. (2015); De Benedictis and Tajoli (2011); Fagiolo et al. (2009); Formichini et al. (2018); Garlaschelli and Loffredo (2004, 2005); He and Deem (2010); Hidalgo et al. (2007); Hidalgo and Hausmann (2009); Serrano and Boguná (2003); Tacchella et al. (2012). Traditionally, a network-based perspective has been advocated to represent countries as nodes and economic transactions as directed edges connecting nodes De Benedictis and Tajoli (2011). A network representation of trade has often resulted from one-mode projections of bipartite networks in which a set of nodes represents the countries and another set includes the industries to (from) which the countries export (import) Cristelli et al. (2013); Saracco et al. (2015). However, neither a bipartite network connecting countries to (exported or imported) products nor its one-mode projections, such as the product-to-product or country-to-country networks, can account for the full extent of interactions that typically occur among countries in the international production network underpinning the global value chain. This article was aimed precisely at assessing how, by gradually increasing the complexity of the network framework, novel insights can be gained on the structure of interactions among countries as well as on the underlying forces driving the evolution of the global value chain.
Our study was based on the WIOD, which provides the most complete publicly available representation of trade between countries and industries. This enabled us to investigate the structure of connections between countries in the international production network. Notice that, while this data set comes with the price of restricting the analysis to a limited sample of countries and industries, all other available data sets that account for more countries and industries (e.g., the United Nations COMTRADE data) do not provide as detailed information as the WIOD on single economic transactions and cannot therefore be used for the analysis of the global value chain.
We focused on three network frameworks—the single-layer, multiplex, and multi-layer networks—and investigated the extent to which the total traded value is distributed within these three networks. To this end, we computed the in- and out-strengths of countries, defined as the total value imported or exported by the countries and associated with economic transactions that can be aggregated in various ways by origin or destination. In the single-layer network, transactions are aggregated by country. In this case, a country’s in- or out-strength reflects the whole value of transactions, respectively, originated from or directed to all other countries (including itself). In the multiplex network, transactions are aggregated by industry from which they originated and by country. In this case, a country’s in- or out-strength in a given industry is defined as the sum of values of all transactions departing from that industry and, respectively, originating from or directed to all other countries (including the focal country itself). Finally, in the multi-layer network, a finer-grained structure results from aggregating transactions by country and combinations of industries. In this case, a country’s in- or out-strength in a given pair of industries is defined as the sum of all values of transactions occurring between the two industries and, respectively, originating from or directed to all other countries. Thus, as we move from a single-layer network representation to more complex ones, the weights of links are re-distributed over different layers in the multiplex representation and over layers and combinations of layers in the case of the multi-layer network.
Findings suggest that the re-allocation of weights resulting from the use of more complex network representations causes the distribution of strengths to vary, making the heavy-tailed shape of the distribution appear more clearly in the case of more complex topologies. Thus, what may appear as a uniform market structure at an aggregate level can instead be represented as a more heterogeneous system where the total value traded is re-distributed among transactions by industry or by production stage. We also observed that the entropy of countries’ strengths systematically decreases from the single-layer representation to the multiplex and multi-layer ones across all years. While countries may seem to play similar roles when trade is aggregated across industries, heterogeneity can be uncovered when a more suitable network framework enables us to assess the countries’ contributions to the various production stages along which intermediary products are transformed into final ones.
In addition, we studied the evolution of entropy over time, and detected an increasing trend of entropy up to a maximum in 2008, when the global economic downturn reached its peak. These results contribute to the literature and current debates on structural changes in the economic system that can be regarded as the topological precursors and early-warning signals of an approaching crisis. For example, recent work has focused on a family of bipartite motifs and uncovered two phases in the evolution of the topological randomness of international trade. It has been suggested that the system began to exhibit increasing degrees of randomness and to weaken its internal structure four years before the onset of the financial crisis in 2007, and then reached a stationary regime characterized by a constant level of randomness during the following three years Saracco et al. (2016). Similarly, a recent study of the Dutch interbank network from 1998 to 2008 has suggested that, while the size and density of the network are uninformative about the crisis, a number of higher-order topological properties of the network (e.g., dyadic and triadic motifs) underwent a slow and continuous transition that started three years in advance of the crisis Squartini et al. (2013). In qualitative agreement with these studies, our work has also uncovered a pre-crisis build-up phase characterized by structural changes of the network related to the way the total traded value was distributed among transactions between countries and across industries (i.e., changes in the entropy of in- and out-strength). These changes in entropy can indeed be seen as warning signals of the upcoming economic downturn.
We further investigated these structural changes in the run-up to the crisis, by focusing on the multi-layer representation and by separating the contributions to strength that resulted from the different types of transactions, namely those occurring within industries and those between industries. Interestingly, the entropy related to cross-layer connections remained smaller over the years than the entropy associated with intra-layer connections, and while the former was responsible for the overall increase in global entropy up to 2008, the latter was the component that most contributed to the subsequent overall decline. Distinguishing between transactions within the global value chain can therefore shed a new light on the sources of heterogeneity in the system.
V Conclusions
In summary, our study proposed a general framework for capturing and comparing the intricacies of three increasingly complex network structures. By focusing on international trade and on two specific measures—strength and entropy—we showed how fundamental nuances of the underlying structure may remain undetected when values and interactions are aggregated and a simplified yet unrealistic representation of the system is used. Because a variety of other real-world systems, beyond trade, can also be represented in terms of the single-layer, multiplex, and multi-layer network topologies, our work can inspire a number of empirical applications and has implications for other fields within and beyond the natural and social sciences.
VI Author contributions
Conceptualization, L.G.A.A., G.M., F.A.R., P.P., and Y.M.; Methodology, L.G.A.A., G.M., P.P., and Y.M.; Software, L.G.A.A., G.M., F.A.R., P.P., and Y.M.; Validation, L.G.A.A., G.M., F.A.R., P.P., and Y.M.; Formal Analysis, L.G.A.A., G.M., F.A.R., P.P., and Y.M.; Investigation, L.G.A.A., G.M., F.A.R., P.P., and Y.M.; Resources, L.G.A.A., G.M., F.A.R., P.P., and Y.M.; Data Curation, L.G.A.A., G.M., F.A.R., P.P., and Y.M.; Writing—Original Draft Preparation, L.G.A.A., G.M., F.A.R., P.P., and Y.M.; Writing—Review and Editing, L.G.A.A., G.M., F.A.R., P.P., and Y.M.; Visualization, L.G.A.A., G.M., P.P., and Y.M.; Supervision, L.G.A.A., G.M., F.A.R., P.P., and Y.M.; Project Administration, L.G.A.A., G.M., F.A.R., P.P., and Y.M.
VII Funding
L.G.A.A. acknowledges São Paulo Research Foundation (FAPESP)(Grant No. 2016/16987-7) for financial support. F.A.R. acknowledges National Council for Scientific and Technological Development (CNPq) (Grant No. 305940/2010-4) and São Paulo Research Foundation (FAPESP) (Grants No. 2016/25682-5 and Grants 2013/07375-0). Y.M. acknowledges support from the Government of Aragón, Spain through Grant E36-17R, by Ministerio de Economía y Competitividad (MINECO) and Fondo Europeo de Desarrollo Regional (FEDER) funds (Grant FIS2017-87519-P) and by the European Commission FET-Proactive Project Dolfins (Grant 640772).
VIII Conflicts of interest
The authors declare no conflict of interest.
References
- Allard et al. (2017) Antoine Allard, M Ángeles Serrano, Guillermo García-Pérez, and Marián Boguñá, “The geometric nature of weights in real complex networks,” Nature Communications 8, 14103 (2017).
- Caldarelli et al. (2012) Guido Caldarelli, Matthieu Cristelli, Andrea Gabrielli, Luciano Pietronero, Antonio Scala, and Andrea Tacchella, “A network analysis of countries’ export flows: firm grounds for the building blocks of the economy,” PloS One 7, e47278 (2012).
- Caldarelli et al. (2018) Guido Caldarelli, Sarah Wolf, and Yamir Moreno, “Physics of humans, physics for society,” Nature Physics 14, 870 (2018).
- Cingolani et al. (2017) Isabella Cingolani, Pietro Panzarasa, and Lucia Tajoli, “Countries’ positions in the international global value networks: Centrality and economic performance,” Applied Network Science 2, 21 (2017).
- Cristelli et al. (2015) Matthieu Cristelli, Andrea Tacchella, and Luciano Pietronero, “The heterogeneous dynamics of economic complexity,” PloS One 10, e0117174 (2015).
- De Benedictis and Tajoli (2011) Luca De Benedictis and Lucia Tajoli, “The world trade network,” The World Economy 34, 1417–1454 (2011).
- Fagiolo et al. (2009) Giorgio Fagiolo, Javier Reyes, and Stefano Schiavo, “World-trade web: Topological properties, dynamics, and evolution,” Physical Review E 79, 036115 (2009).
- Formichini et al. (2018) M Formichini, G Cimini, E Pugliese, and A Gabrielli, “Measuring the impact of technological innovations on industrial products through a multilayer network approach,” Preprints 2018: 2018080081 (2018).
- Garlaschelli and Loffredo (2004) Diego Garlaschelli and Maria I Loffredo, “Fitness-dependent topological properties of the world trade web,” Physical Review Letters 93, 188701 (2004).
- Garlaschelli and Loffredo (2005) Diego Garlaschelli and Maria I Loffredo, “Structure and evolution of the world trade network,” Physica A: Statistical Mechanics and its Applications 355, 138–144 (2005).
- He and Deem (2010) Jiankui He and Michael W Deem, “Structure and response in the world trade network,” Physical Review Letters 105, 198701 (2010).
- Hidalgo et al. (2007) César A Hidalgo, Bailey Klinger, A-L Barabási, and Ricardo Hausmann, “The product space conditions the development of nations,” Science 317, 482–487 (2007).
- Hidalgo and Hausmann (2009) César A Hidalgo and Ricardo Hausmann, “The building blocks of economic complexity,” Proceedings of the National Academy of Sciences 106, 10570–10575 (2009).
- Serrano and Boguná (2003) Ma Angeles Serrano and Marián Boguná, “Topology of the world trade web,” Physical Review E 68, 015101 (2003).
- Tacchella et al. (2012) Andrea Tacchella, Matthieu Cristelli, Guido Caldarelli, Andrea Gabrielli, and Luciano Pietronero, “A new metrics for countries’ fitness and products’ complexity,” Scientific Reports 2, 723 (2012).
- Schweitzer et al. (2009) Frank Schweitzer, Giorgio Fagiolo, Didier Sornette, Fernando Vega-Redondo, Alessandro Vespignani, and Douglas R White, “Economic networks: The new challenges,” Science 325, 422–425 (2009).
- Barigozzi et al. (2011a) Matteo Barigozzi, Giorgio Fagiolo, and Giuseppe Mangioni, “Community structure in the multi-network of international trade,” in Complex Networks (Springer, 2011) pp. 163–175.
- Barigozzi et al. (2011b) Matteo Barigozzi, Giorgio Fagiolo, and Giuseppe Mangioni, “Identifying the community structure of the international-trade multi-network,” Physica A: Statistical Mechanics and its Applications 390, 2051–2066 (2011b).
- Piccardi and Tajoli (2012) Carlo Piccardi and Lucia Tajoli, “Existence and significance of communities in the world trade web,” Physical Review E 85, 066119 (2012).
- Newman (2018) Mark Newman, Networks (Oxford university press, 2018).
- Saracco et al. (2015) Fabio Saracco, Riccardo Di Clemente, Andrea Gabrielli, and Tiziano Squartini, “Randomizing bipartite networks: the case of the world trade web,” Scientific Reports 5 (2015).
- Cristelli et al. (2013) Matthieu Cristelli, Andrea Gabrielli, Andrea Tacchella, Guido Caldarelli, and Luciano Pietronero, “Measuring the intangibles: A metrics for the economic complexity of countries and products,” PloS One 8, e70726 (2013).
- Battiston et al. (2014) Federico Battiston, Vincenzo Nicosia, and Vito Latora, “Structural measures for multiplex networks,” Physical Review E 89, 032804 (2014).
- Kivelä et al. (2014) Mikko Kivelä, Alex Arenas, Marc Barthelemy, James P Gleeson, Yamir Moreno, and Mason A Porter, “Multilayer networks,” Journal of Complex Networks 2, 203–271 (2014).
- Mastrandrea et al. (2014) Rossana Mastrandrea, Tiziano Squartini, Giorgio Fagiolo, and Diego Garlaschelli, “Reconstructing the world trade multiplex: The role of intensive and extensive biases,” Physical Review E 90, 1–18 (2014).
- Lee and Goh (2016) Kyu-Min Lee and K-I Goh, “Strength of weak layers in cascading failures on multiplex networks: case of the international trade network,” Scientific Reports 6, 26346 (2016).
- Ghariblou et al. (2017) Saeed Ghariblou, Mostafa Salehi, Matteo Magnani, and Mahdi Jalili, “Shortest paths in multiplex networks,” Scientific Reports 7, 2142 (2017).
- Alves et al. (2018) Luiz G A Alves, Giuseppe Mangioni, Isabella Cingolani, Francisco A Rodrigues, Pietro Panzarasa, and Yamir Moreno, “The nested structural organization of the worldwide trade multi-layer network,” arXiv preprint arXiv:1803.02872 (2018).
- Timmer et al. (2015) Marcel P Timmer, Erik Dietzenbacher, Bart Los, Robert Stehrer, and Gaaitzen J Vries, “An illustrated user guide to the world input–output database: the case of global automotive production,” Review of International Economics 23, 575–605 (2015).
- Aleta and Moreno (2018) Alberto Aleta and Yamir Moreno, “Multilayer networks in a nutshell,” arXiv preprint arXiv:1804.03488 (2018).
- Saracco et al. (2016) Fabio Saracco, Riccardo Di Clemente, Andrea Gabrielli, and Tiziano Squartini, “Detecting early signs of the 2007–2008 crisis in the world trade,” Scientific Reports 6, 30286 (2016).
- Squartini et al. (2013) Tiziano Squartini, Iman Van Lelyveld, and Diego Garlaschelli, “Early-warning signals of topological collapse in interbank networks,” Scientific Reports 3, 3357 (2013).