Electron paramagnetic resonance enhanced crystal field analysis for low point-group symmetry systems:
C2v sites in Sm3+:CaF2/SrF2
Abstract
We present a comprehensive spectroscopic study of C2v point-group symmetry sites in Sm3+:CaF2/SrF2 codoped with either NaF or LiF. Data includes electron paramagnetic resonance measurements of Zeeman and hyperfine interactions for the ground state, as well as site-selective excitation and fluorescence spectroscopy up to the 4G5/2 multiplet. Inclusion of the EPR data allowed us to determine unique crystal-field parameters. The parameters provide information about the geometry of the sites and the nature of the interactions between the Sm3+ dopant and the alkaline earth co-dopant.
pacs:
31.15.-p,32.30.-r,33.35.+r1 Introduction
Accurate crystal-field calculations of magnetic and hyperfine interactions for rare-earth ions in low point-group symmetry systems is a difficult problem [1, 2]. While previous studies have employed ground-state values to enhance crystal-field calculations [2, 3, 4, 5, 6], accurately reproducing magnetic and hyperfine interactions for low point-group symmetry systems is still challenging. Crystal-field models for low-symmetry materials such as yttrium orthosilicate have potential to aid in the development of the many recently demonstrated rare-earth ion based applications employing low-symmetry host materials. This includes advances for optical quantum memories, quantum-gate implementations, and optical-to-microwave modulators [7, 8, 9, 10, 11, 12, 13].
Here we present a detailed optical and magnetic characterization of the C2v centre in Sm3+ doped crystals. The data is analysed using a crystal-field fitting scheme that simultaneously employs optical fluorescence, magnetic Zeeman, and hyperfine data. Our parameters are largely consistent with those for Dy3+ orthorhombic centres in alkaline-earth co-doped fluorides [4]. This work demonstrates that hyperfine interactions can be accurately modelled using a crystal-field approach in low-symmetry systems.
There are two main substitutional sites for Sm3+ in CaF2 and SrF2: the tetragonal C4v(F-) centre and cubic () [5, 14, 15, 16, 17, 18]. For crystals grown under oxidizing conditions, a C3v(O2-) centre is also present, having an O2- ion in a nearest neighbour position along the direction from the Sm3+ ion. Co-doping of rare-earth doped alkaline earth fluoride crystals with Li+ or Na+ ions is known to enhance the concentration of cubic centres [19, 20] but also gives rise to rare earth centres charge compensated by monovalent alkali ions. Various configurations for these centres are given by Pack et al. [21] who studied the transitions of Na+ codoped Ce3+:CaF2 and Ce3+:SrF2 crystals. While their work suggested the presence of multiple Na+ charge compensated centres, a later study focusing on EPR intra- and inter- configurational transitions, of Ce3+:CaF2 optimally codoped with either Li+ or Na+, suggests the presence of three main centres [22]. A remotely charge compensated cubic () centre, an orthorhombic C2v symmetry centre associated with a nearest neighbour alkali ion, and a modified tetragonal centre having an on-axis alkali ion in the next nearest neighbour position.
2 Theoretical description
This section details both the basic elements of the crystal field and spin Hamiltonian formalisms before describing the method employed to perform the enhanced crystal-field fit outlined in the introduction.
2.1 Crystal field Hamiltonian
The term “crystal-field Hamiltonian” in the context of rare-earth doped insulators is used to describe an effective Hamiltonian for the configuration, containing parameters fit to phenomenological data [23, 24]. The complete Hamiltonian reads
| (1) |
where corresponds to the free-ion Hamiltonian, is the Hamiltonian describing the effect of the crystal on the ion, is the Zeeman Hamiltonian, and is the hyperfine Hamiltonian.
The two dominant interactions of the free-ion Hamiltonian are the electrostatic repulsion and the spin-orbit interaction. We follow Carnall et al. [25] in defining the free-ion Hamiltonian by
| (2) | |||||
where is the spherically symmetric one-electron part of the Hamiltonian; are the Slater parameters; is the spin-orbit coupling constant; and and are the angular parts of the electrostatic repulsion and the spin-orbit coupling, respectively. The constants , , and parametrize two-body interactions (Trees parameters) and the constants parametrize three-body interactions (Judd parameters). The and parameters are higher-order relativistic corrections.
We now consider the second term in Eq. (1), . For a cubic system, is commonly written as [16]:
| (3) | |||||
Here, the are the crystal-field parameters for cubic-symmetry sites and C are spherical tensors, expressed in Wybourne’s normalization [26]. The subscript “” on indicates that the axis is a four-fold axis.

| Ion | |||
|---|---|---|---|
| F- | |||
| F- | |||
| F- | |||
| F- | |||
| Ca2+/Sr2+ |
For this form of , the , , and axes are four-fold axes. This is not suitable for our analysis, since a C2v symmetry system is best described with an axis choice where the axis is two-fold symmetric while the mirror planes are perpendicular to and . The structure of such a site, with the choice that the and axes are two-fold axes (through the edge of the cube formed by the F- ligands), and the axis is a four-fold axis (through a face of the cube), is given in Fig. 1 and Tab. 1. We may define a cubic crystal-field Hamiltonian for this geometry as follows:
| (4) | |||||
The subscript “” on indicates that the axis is a two-fold axis. The signs and normalizations were chosen so that the crystal-field parameters from Ref. [16] could be used without modification.
The local structure of the C2v sites is modified by the replacement of a Ca2+ or Sr2+ ion by an Na+ or Li+, and thus the Sm3+-Na+/Li+ direction defines the C2v symmetry axis. For the geometry of Tab. 1, this means that the substitution is for a Ca2+ or Sr2+ on the axis. In Sec. 4.3 we will discuss the EPR data using the knowledge that the above Hamiltonian requires that the two-fold axis, , is along the direction (prior to any distortion caused by the substitution), and that the and axes are along the and directions, respectively (so that is a four-fold axis).
We expect the C2v symmetry sites to only have small distortions from the cubic sites due the substitution of a Na+ or Li+ ion. We therefore write the C2v crystal field Hamiltonian in terms of the above cubic crystal field Hamiltonian and changes from the cubic parameters:
| (5) | |||||
Here is the change in the crystal-field parameter from the cubic value. We fix and to the values obtained by fitting to the purely cubic centers [16], and then vary all of the parameters of Eq. (5), which represent the distortion from cubic introduced by codoping with Na+ or Li+ ions.
The Zeeman term describes the effect of an external magnetic field. We define [27]
| (6) |
where is the Bohr magneton, and and are the orbital and spin angular momenta of the th electron for in the configuration, respectively.
The final term in Eq. (1), , describes the coupling of nuclear spin with the spin of the electrons. Following Judd [27], the hyperfine Hamiltonian is
| (7) |
with
| (8) |
where is the position of the th electron. Furthermore, is the total angular momentum of the nucleus, and the constant factor is defined by
| (9) |
where is the nuclear magneton, is the nuclear -factor and is the mean cube radius of the orbital. For details on how the hyperfine interaction is treated in terms of tensor operators, the reader is referred to Refs. [28, 29]
Having defined the complete Hamiltonian, the energies and wavefunctions can be calculated by diagonalizing in the basis. Here the state label corresponds to all additional degrees of freedom of the electronic configuration. The reader is referred to the monographs of Wybourne [26] and Judd [27] for a detailed discussion of these quantum numbers.
2.2 Superposition Model
The superposition model, developed by Newman and co-workers in the late 60s [30, 31, 32], has proved an important framework for the understanding of crystal-field parameters. The model uses the approximation that the contributions to the effective potential from different ligands is superposeable (for an electrostatic potential this is obviously exact). If we had a single ligand on the axis at distance the resulting cylindrical symmetry would restrict only crystal-field parameters with to be non-zero. We define the intrinsic parameters for this ligand as to be parameters for this single ligand. Adding together the effects of all the ligands yields
| (10) |
In this equation, is required to take into account the effect of rotating a ligand from the axis to orientation . This angular term has the same form as in a point-charge model. The term , which takes into account the variation of the interactions with distance, would be the same as for a point-charge potential if we chose . However, analyses of experimental crystal-field parameters suggest that the power law is generally higher than electrostatic power laws, because the quantum-mechanical effects that give rise to the majority of the “crystal field” involves overlap of ligand orbitals, which falls off faster than electrostatic potentials.
2.3 Spin Hamiltonian
Most studies of magnetic and hyperfine interactions make use of a spin Hamiltonian. It is defined as [33]
| (11) |
The first two bracketed terms account for free-ion and crystal-field interactions as defined by Eqs. (2) and (5), respectively. Provided the state under consideration is sufficiently separated from adjacent states, the terms and amount to a constant off-set due to the spin-orbit and crystal-field interactions. The hyperfine structure of the state in the presence of a magnetic field can then be accurately characterized by the interactions in the second set of parentheses. These terms are the nuclear hyperfine interaction and the electronic Zeeman interaction [33]. We note that contributions due to the nuclear quadrupole as well as nuclear Zeeman interactions have been neglected here. The effective Hamiltonian for a specific electronic state is referred to as the spin Hamiltonian. The details of the components that contribute to the matrix elements of these interactions depends on whether one is dealing with a Kramers or non-Kramers ion, as well as the local site symmetry.
In the case of samarium in a C2v symmetry center, the appropriate spin Hamiltonian has the form
| (12) |
If is symmetric (which is the normal choice), the -tensor can be diagonalized by an Euler rotation according to
| (13) |
with principal -values , , and and Euler rotation parameters , , and . The orientation for which the -tensor is diagonal is referred to as the principal axes of the Zeeman term. Similarly, the hyperfine parameter matrix can be diagonalized by an Euler rotation to their respective principal axes. We shall see below that our choice of C2v axes automatically diagonalises the tensor, considerably simplifying the analysis.
2.4 Crystal-field analysis
In order to fit the parameters of Eqs. (2) and (5) to both energy level and spin Hamiltonian data we must calculate the theoretical spin Hamiltonian for a given set of free-ion and crystal-field parameters. Consequently, we must calculate the theoretical spin-Hamiltonian parameters for a given configuration Hamiltonian, . This projection can be cast in the language of effective operators [34, 35]. We proceed by defining the configuration as the complete space and the spin Hamiltonian basis as the model space. Then, if we have eigenstates of the complete Hamiltonian of the form
we require the matrix elements of the model space Hamiltonian, such that
where is the spin Hamiltonian defined by Eq. (11). Since the spin Hamiltonian method assumes that and can be considered as a zero-order Hamiltonian, the transformation to the spin Hamiltonian basis can be performed by diagonalizing and then, given the resulting eigenvectors , one can transform the Zeeman and hyperfine operators according to
| (14) |
for operator, , and effective operator, .
3 Experimental techniques
The samples of CaF2 or SrF2 codoped with either SmF3 with LiF or SmF3 with NaF were prepared using the vertical Bridgman-Stockbarger method. The growth was performed in a positive argon atmosphere using a 38 kW Arthur D. Little radio frequency furnace. The resulting crystal boules were oriented along the axis using Laue x-ray diffraction, and cut into 5 mm3 samples which were further polished for optical spectroscopy.
A series of crystals with various dopant concentrations were prepared from which the following were chosen for detailed study: two crystals of 0.075%Sm3+:1.09%Na+:CaF2 and 0.026%Sm3+:0.99%Li+:CaF2, in addition to two crystals of 0.01%Sm3+:0.86%Na+:SrF2 and 0.037%Sm3+:1.17%Li+:SrF2. These dopant concentrations were selected since they yielded primarily single-ion centers for crystals prepared without the NaF or LiF codopant [16]. We note that in the case of CaF2 preferentially formed clusters will be present at the selected dopant levels.
The Sm3+ ions were excited for both excitation and fluorescence spectroscopy using a Spectra Physics 375B dye laser, employing Rhodamine 560 dye dissolved in ethylene-glycol, pumped by a 5 W Coherent Innova 70 argon-ion laser. The samples were cooled to 10 K using a closed-cycle CTI-Cryogenics model 22C cryostat. A Spex Industries 500M single monochromator was employed for dispersing fluorescence. Dispersed light in the 18,000 cm-1 to 12,000 cm-1 wavelength range was then detected using a thermoelectrically cooled Hamamatsu R9249 photomultipler. For fluorescence in the infrared, phase sensitive detection was performed with a liquid nitrogen cooled germanium detector in conjunction with an Ortholoc model 9502 lock-in amplifier.
The electron-paramagnetic resonance (EPR) measurements were performed at temperatures between 5-50 K using a Bruker EMX10/12 X-band spectrometer with microwave frequencies in the range 9.695-9.710 GHz, a microwave power of 0.1 mW, and 100 kHz field modulation. The angular variations of the EPR spectra were measured by rotating the sample in the cavity. The full range of the applied magnetic field was between 0-1.5 T.
4 Results and discussion
4.1 Energy levels of Sm3+ ions
The valence electrons of Sm3+ are of the configuration, which consists of a total of 1001 Kramers doublets. Fluorescence in the visible region was detected from the 4G5/2 multiplet to all 6HJ and 6FJ multiplets, with the exception of the 6F11/2.
The standard notation of Dieke to label specific crystal-field levels is used throughout this communication. Specifically, the ground multiplet is labelled as , with the ground electronic state designated as . Further, the first excited multiplet is labelled by the letter , and the 4G5/2 multiplet is labelled by the letter . Again, numerical subscripts are used to indicate a specific electronic state. For the 4F1/2, 6F3/2, and 6H13/2 multiplets we adopt the notation employed in our previous work in which we opted to label them by the letter since crystal-field -mixing means the corresponding wavefunctions of these multiplets are heavily mixed.
4.2 Laser spectroscopy
Site-selective and broadband excitation spectroscopy was performed on all four materials. A representative broadband excitation spectrum for 0.075%Sm3+:1.09%Na+:CaF2 recorded at a temperature of 10 K is shown in Figure 2 (a). Both cubic and C2v centres have been identified; the cubic centre has been investigated in detail in the past [16]. We will henceforth denote the orthorhombic symmetry centre by C2v(Na+/Li+). Additionally, we observe a phonon sideband, shifted by an energy of cm-1 from the zero-phonon line. Such sidebands are a common feature of this multiplet. Figure 2 (b) consists of an excitation spectrum selecting only the C2v(Na+) center. Fluorescence was recorded by monitoring the transition at an energy of 17622 cm-1. We note that the 17 cm-1 splitting of the level (lines 2 and 3 in Figure 2 (b)) suggests that this center is very close to cubic symmetry. This is also reflected in the non-cubic crystal-field parameters presented in Tab. 4.
The phonon sideband is due to an electron interaction with local vibronic modes around a substitutional Sm3+ ion. Similar phonon sidebands have been observed for Ce3+:Na+:CaF2(SrF2) and were located in the range from 100 to 500 cm-1 shifted from the zero-phonon lines of Ce3+ [36, 21]. In general, the difference in the relative intensities of the phonon sideband to the zero-phonon line is due to the electron-phonon coupling strength. The larger coupling constant corresponds to a larger overlap of the wavefunctions between the central Sm3+ (Ce3+) ion and the eight ligand F- ions in CaF2. This value is estimated from the superhyperfine (SHF) interaction of the central ion and the ligand ions in the EPR measurement (Fig. 5).
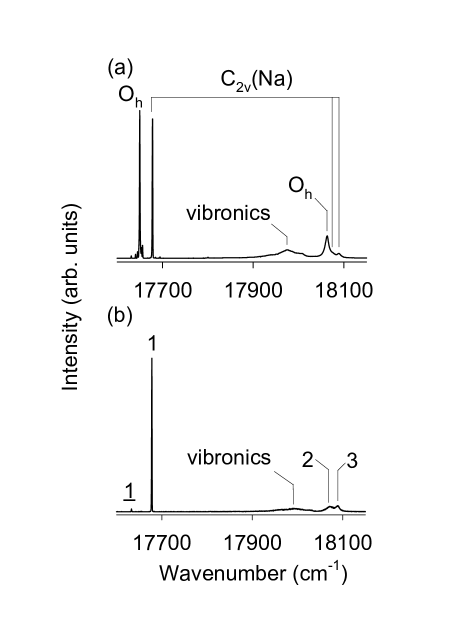
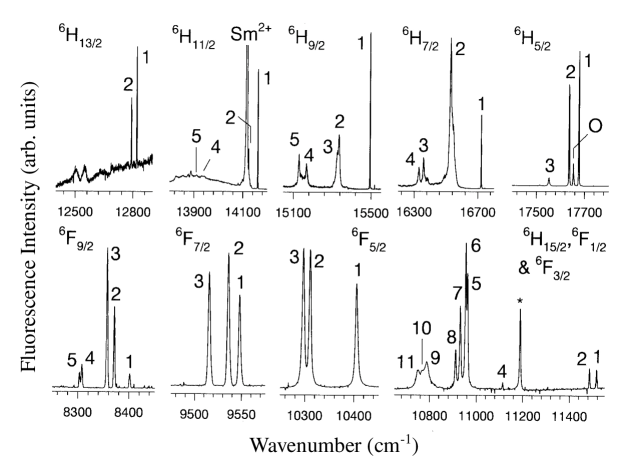
Figure 3 shows representative site-selective fluorescence spectra for the C2v(Na+) center in 0.075%Sm3+:1.09%Na+:CaF2 as measured at 10 K. The spectrum measured for the 4G5/2 6H5/2 transitions was recorded using excitation of the Z transition. This necessarily excites the cubic center as well, with the cubic A transition observed at 17653 cm-1. The fluorescence spectra of all other multiplets were obtained exciting the C2v(Na+) Z transition at 17678 cm-1. The spectra of the 6H9/2 and 6H13/2 multiplets is partially obscured by the unintentional presence of Sm2+ produced in the reducing conditions during crystal growth. A similar effect is observed for Li+ co-doped CaF2 crystals although no Sm2+ was present in the SrF2 samples studied. A strong Sm2+ peak near 14118 cm-1 with a broad sideband is observed corresponding to the single electric dipole allowed transition along with a vibrational sideband [37]. The peak observed at 11189 cm-1 is present in both Sm3+:Li+:CaF2 and Sm3+:Na+:CaF2 and is, as such, unassigned. Detailed energy level assignments for 6H and 6F terms as well as the 4G5/2 multiplet of the C2v centers in Sm3+:Na+/Li+:CaF2 and Sm3+:Na+/Li+:SrF2 are presented in Tab. LABEL:tab:eval.
4.3 Electron-paramagnetic resonance
Figure 4(a) shows a typical Sm3+ EPR spectrum measured for Sm3+:Na+:CaF2 with and at 5 K. The spectra consist of two groups of intense EPR lines, denoted by and , due to the 152Sm isotopes with and natural abundance of 26.8%. Two sets of weak octet hyperfine lines in Figure 4(b) are due to the 147Sm and 149Sm isotopes with a non-zero nuclear spin of and natural abundances of 15.1% and 13.8%, respectively. The hyperfine coupling constants are estimated from the magnetic field separation between adjacent lines using second-order perturbation theory. The coupling constants reported in Tab. 3 are the average for 147Sm and 149Sm.

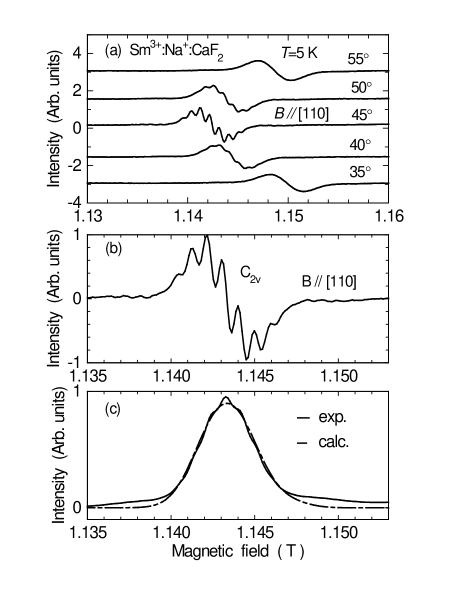
Figure 5(a) shows the angular variation of the EPR spectrum around the direction in the plane at 5 K. There are six geometrically equivalent C2v Sm3+ centres, with principal axes along the , , , , , and directions. The line at 1.143 T with B parallel to is a unique line from the single nondegenerate centre with the principal axis in the direction.
The EPR line shape for any magnetic field direction (see the spectra at and in Fig. 5(a)) is Gaussian and the linewidth is created by the superhyperfine (SHF) interaction of Sm3+ with the surrounding F- ions. However, as shown in Figure 5(a), the SHF structure only appears when the magnetic field is parallel to the direction. The number of SHF lines is clearly more than seven, as shown in Figure 5(b), suggesting that the total spin contributing to this structure must be greater than 3. Since the nuclear spin of an F- ion is this requires more than 6 F- ions. We therefore consider the eight equivalent nearest-neighbour F- ligands having a total nuclear spin of (). The nine SHF lines are calculated to have the intensity ratio of 1:8:28:56:70:56:28:8:1. The calculated curve fitted to the observed integrated EPR line is shown in Fig. 5(c). This result suggests an isotropic SHF interaction of the central samarium ion with the eight equivalent fluorine ligand ions. The resolved SHF lines of Sm3+ with eight equivalent F- ligands are not observed around 1.28 T with the magnetic field parallel to the direction in Figure 4(a). A possible explanation is that the SHF structure from the four sites with principal axes along , , , and cancel when is parallel to . The same nine resolved SHF lines are observed for SrF2:Sm3+:Na+ with parallel to , but not with parallel to . These results are explained as follows: (i) isotropic SHF interaction is dominant, (ii) although the contribution of the orbital of the F- ligands to the SHF interaction is small compared with that of the orbital, it produces an anisotropic SHF splitting for any magnetic field. This is reflected by the unexpected appearance of the resolved SHF structure. Here we consider the dominant SHF interaction represented by the Fermi contact term. The coupling constant, , is given by
| (15) |
where is the -value of the Sm3+ ground-state electron spin, is the -value of the F- ligand nuclear spin, is the electron density at the F- nucleus [38], and is the s-character amount of the F- ligand ion electron. The field separation, , between the adjacent lines of the nine SHF lines is experimentally estimated to be 0.9 mT as shown in Fig. 5(b). The relation between the SHF coupling constant and the separation magnetic field is given by
| (16) |
Using Eqs. (15) and (16), with a -value for Sm3+ of , of F- and cm-3 for the F- ligand ion [38], the value of is calculated to be 0.05%. This value is very small, but not negligible. Such an expansion of the electron wavefunction of the Sm3+ central ion towards the F- ligand ions is indicative of strong electron-phonon coupling, which results in the observed phonon-side bands shown in Fig. 2.
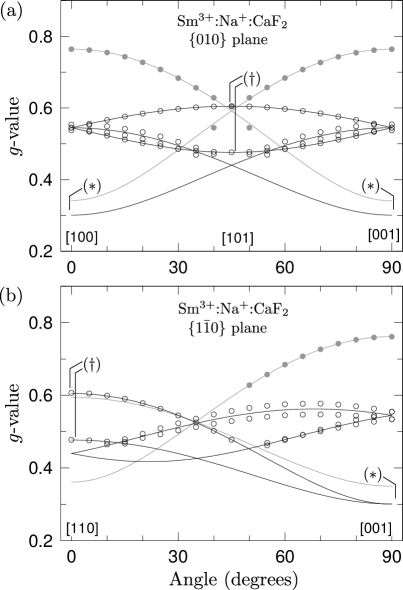
Figure 6 shows the angular variations of the -values in the and planes for the 152Sm3+ ion with zero nuclear spin in Sm3+:Na+:CaF2. As the full magnetic field range is 0-1.5 T, the -values below 0.46 were not observable. The curves in Fig. 6 are calculated using the spin Hamiltonian (12) without the hyperfine interaction. The patterns of the angular variations show tetragonal and orthorhombic symmetries. In Ref. [39], the principal , and axes of the C4v centres are defined as the , and directions, respectively. The C2v symmetry axes must be consistent with the definition of our crystal-field Hamiltonian (5). As noted earlier, the reduction from cubic symmetry is achieved by the replacement of a Ca2+ ion by an Na+ or Li+ ion, and the C2v symmetry axis is therefore along the Sm3+-Na+/Li+ direction. Observing that the C2v axis necessarily intersects an edge of the cube formed by the 8 nearest-neighbor F- ions, it follows that one of the remaining two axes also passes through a fluorine cube edge, while the other axis must intersect a fluorine cube face. From Fig. 6(a) it is apparent that there are two extrema in the direction (indicated by ()), and one extremum in the direction (equivalent to the direction in the figure, indicated by ()). The extremum must be along direction. One of or must be along and the other along , which has a unique extremum. We make the following axis identifications: the principal axis corresponds to the direction, while the and directions are in the and directions, respectively, consistent with Tab. 1 and Eq. 4. Note that the cubic crystal structure means that there will be sites with the local , and axes along different crystal directions, which explains why there are two extrema along . The distinction between these two extrema is given by our calculation, with being greater than , whereas the unique extrema is .
The cubic (Oh) symmetry centers, observed in the laser selective excitation measurements in Fig. 2, could not be detected using EPR. We tentatively ascribe this to fast spin-lattice relaxation between the magnetically split ground state ( of 6H5/2) and the consequently broadened EPR linewidths. Analogous measurements were made for Sm3+:Li+:CaF2, Sm3+:Li+:SrF2, and Sm3+:Na+:SrF2, as discussed below.
Table 3 summarizes the -values and hyperfine coupling constants, , obtained by fitting the spin Hamiltonian (12) to the recorded data. This is displayed alongside the spin Hamiltonian parameters inferred from the crystal-field Hamiltonian, as will be discussed in Sec. 4.4.
The orthorhombic C2v symmetry centers are strongly associated with Li+ and Na+ charge compensators. The principal axis of the Li+ orthorhombic center is tilted by an angle of about from the direction, whereas that of the orthorhombic C2v(Na+) center is parallel to the direction. This distinction is due to the differing ionic radii of Li+ (0.088 nm) and Na+ (0.130 nm). As the ionic radius of Na+ is closer to those of Ca2+ (0.126 nm) and Sr2+ (0.139 nm), Na+ ions substitute for Ca2+ with minimal relaxation of the surrounding ions. On the other hand, Li+ ions are smaller in size, presumably leading to two minima of the chemical potential with the Li+ ions offset from the substitutional position.
4.4 Crystal-field fit
In this section, we outline the procedure used to fit the crystal-field parameters for the C2v centres in CaF2:Sm3+:Na+/Li+ and SrF2:Sm3+:Na+/Li+. These materials have a low point-group symmetry, but the symmetry does guarantee that the principal axes of the spin Hamiltonian are aligned with the CF axes, so the Euler angles described in Sec. 2.3 are identically zero. This avoids several technical challenges associated with C1 point-group symmetry sites, while nevertheless demonstrating a crystal-field fit in a symmetry for which is is impossible to uniquely determine the crystal-field parameters from electronic energy (Stark level) data alone. The fit is performed using not only the Stark level data presented in Sec. 4.2, but also the ground-state Zeeman and hyperfine data detailed in Sec. 4.3.
For symmetry the crystal-field Hamiltonian, Eq. (5), contains eight non-zero parameters, which represent a distortion from cubic symmetry. During the fitting procedure, the eight parameters of Eq. (5) were varied, while the cubic and parameters were set to constant values that were previously determined for samples without Na+ or Li+ codopant [16]. In addition to the crystal-field parameters, the Slater parameters and the spin-orbit interaction parameter were varied, whereas the remaining parameters of Eq. (2) were fixed to literature values. In order to accurately reproduce the ground-state hyperfine splittings, the coupling constant in Eq. (7) was also varied. By diagonalizing the full Hamiltonian in the basis, and employing the projection defined by Eq. (14), it was possible to determine the theoretical energy-level and spin Hamiltonian parameters for a given set of parameters.
In order to find a global solution for the parameters discussed above, the basin-hopping algorithm was used [40, 41]. This procedure is similar to simulated annealing. However, after each step a conventional local minimization algorithm is employed. Furthermore, unlike in simulated annealing, the “temperature” in the metropolis criterion is fixed to 1. For the implementation employed here, the “Bound Approximation by Quadratic Approximation” algorithm from the NLopt library was used to perform the local minimization [42, 43]. The basin-hopping algorithm has the advantage of being less likely to become “trapped” in a local minimum compared to simulated annealing. These calculations were completed with a program suite specifically developed for crystal-field analyses of low point-group symmetry hosts [44].
Using the procedure outlined above, a crystal-field fit was performed for the C2v(Na+/Li+) centers in Sm3+:CaF2 and Sm3+:SrF2. The results are split into three tables. Table LABEL:tab:eval contains both the calculated energy level values as well as the experimental data obtained from site-selective excitation spectroscopy. Table 3 summarizes the calculated and measured -values and hyperfine parameters.
| Multiplet | State | Sm3+:CaF2 | Sm3+:SrF2 | ||||||
|---|---|---|---|---|---|---|---|---|---|
| Na+ | Li+ | Na+ | Li+ | ||||||
| Theory | Exp. | Theory | Exp. | Theory | Exp. | Theory | Exp. | ||
| 6H5/2 | Z1 | 0 | 0 | 0 | 0 | 0 | 0 | 0 | 0 |
| Z2 | 32 | 41 | 51 | 60 | 45 | 50 | 59 | 72 | |
| Z3 | 129 | 124 | 139 | 142 | 146 | - | 164 | - | |
| 6H7/2 | Y1 | 940 | 956 | 949 | 972 | 971 | 967 | 973 | 993 |
| Y2 | 1148 | 1148 | 1145 | 1162 | 1121 | 1121 | 1132 | 1140 | |
| Y3 | 1298 | 1319 | 1283 | 1304 | 1282 | 1269? | 1281 | 1283 | |
| Y4 | 1350 | 1350 | 1371 | 1371 | 1310 | 1294? | 1336 | 1365 | |
| 6H9/2 | X1 | 2179 | 2185 | 2185 | 2196 | 2201 | 2198 | 2198 | 2214 |
| X2 | 2339 | 2344 | 2331 | 2355 | 2313 | 2331 | 2333 | 2352 | |
| X3 | 2357 | 2354 | 2354 | 2369 | 2356 | 2355 | 2355 | 2367 | |
| X4 | 2518 | 2511 | 2514 | 2516 | 2492 | 2488 | 2495 | 2497 | |
| X5 | 2546 | 2550 | 2559 | 2569 | 2513 | 2548 | 2535 | 2556 | |
| 6H11/2 | W1 | 3511 | 3517 | 3506 | 3520 | 3519 | 3571 | 3519 | 3530 |
| W2 | 3550 | 3554 | 3555 | 3578 | 3572 | 3607 | 3581 | 3599 | |
| W3 | 3743 | - | 3731 | 3625 | 3710 | 3644 | 3734 | 3647 | |
| W4 | 3754 | 3742 | 3760 | 3751 | 3739 | 3726 | 3737 | 3738 | |
| W5 | 3781 | 3758 | 3777 | 3784 | 3763 | 3759 | 3759 | 3780 | |
| W6 | 3900 | - | 3901 | - | 3860 | - | 3879 | - | |
| 6H13/2 | V1 | 4850 | 4857 | 4852 | 4865 | 4871 | 4864 | 4879 | 4888 |
| V2 | 4893 | 4883 | 4902 | 4912 | 4926 | 4914 | 4933 | 4944 | |
| V3 | 5004 | - | 5010 | 5009 | 5002 | 5000 | 5020 | 5030 | |
| V4 | 5203 | 5133? | 5187 | 5142 | 5162 | 5152 | 5161 | 5152 | |
| V5 | 5209 | 5183? | 5201 | 5177 | 5181 | 5155 | 5177 | 5166 | |
| V6 | 5233 | - | 5229 | 5248 | 5208 | - | 5224 | 5238 | |
| V7 | 5268 | - | 5253 | 5275 | 5245 | 5241 | 5252 | 5263 | |
| 6F1/2, | S1 | 6165 | 6161 | 6167 | 6165 | 6189 | 6188 | 6190 | 6191 |
| 6F3/2, | S2 | 6193 | 6192 | 6209 | 6216 | 6217 | 6220 | 6228 | 6243 |
| 6H15/2 | S3 | 6286 | - | 6294 | 6312 | 6302 | - | 6335 | 6347 |
| S4 | 6572 | 6564 | 6575 | 6571 | 6540 | 6529 | 6550 | 6543 | |
| S5 | 6703 | 6717 | 6693 | 6723 | 6672 | 6682 | 6659 | 6692 | |
| S6 | 6737 | 6724 | 6723 | 6731 | 6686 | 6696 | 6690 | 6709 | |
| S7 | 6743 | 6747 | 6735 | 6758 | 6710 | 6724 | 6725 | 6744 | |
| S8 | 6760 | 6766 | 6762 | 6782 | 6727 | 6741 | 6744 | 6764 | |
| S9 | 6847 | 6891 | 6832 | 6867 | 6807 | 6835 | 6802 | 6858 | |
| S10 | 6901 | 6911 | 6882 | 6894 | 6850 | 6860 | 6855 | 6871 | |
| S11 | 6927 | 6929 | 6921 | 6940 | 6877 | 6882 | 6894 | 6906 | |
| 6F5/2 | R1 | 7253 | 7273 | 7259 | 7282 | 7229 | 7246 | 7239 | 7262 |
| R2 | 7377 | 7368 | 7376 | 7373 | 7335 | 7330 | 7338 | 7341 | |
| R3 | 7396 | 7381 | 7404 | 7395 | 7356 | 7344 | 7367 | 7366 | |
| 6F7/2 | Q1 | 8121 | 8130 | 8122 | 8136 | 8095 | 8108 | 8103 | 8120 |
| Q2 | 8130 | 8142 | 8130 | 8156 | 8107 | 8118 | 8115 | 8139 | |
| Q3 | 8151 | 8162 | 8166 | 8173 | 8127 | 8135 | 8136 | 8154 | |
| Q4 | 8275 | - | 8275 | - | 8239 | - | 8249 | - | |
| 6F9/2 | P1 | 9284 | 9277 | 9283 | 9287 | 9258 | 9260 | 9266 | 9277 |
| P2 | 9292 | 9307 | 9296 | 9313 | 9269 | 9283 | 9278 | 9296 | |
| P3 | 9316 | 9321 | 9319 | 9334 | 9291 | 9298 | 9305 | 9318 | |
| P4 | 9375 | 9370 | 9378 | 9379 | 9340 | 9345 | 9357 | 9363 | |
| P5 | 9386 | 9375 | 9388 | 9386 | 9359 | 9351 | 9371 | 9371 | |
| 4G5/2 | A1 | 17657 | 17678 | 17672 | 17690 | 17704 | 17722 | 17716 | 17735 |
| A2 | 18074 | 18072 | 18067 | 18074 | 18070 | 18087 | 18046 | 18070 | |
| A3 | 18101 | 18089 | 18107 | 18109 | 18121 | 18100 | 18146 | 18138 | |
| Parameter | Sm3+:CaF2 | Sm3+:SrF2 | ||||||
|---|---|---|---|---|---|---|---|---|
| Na+ | Li+ | Na+ | Li+ | |||||
| Theory | Exp. | Theory | Exp. | Theory | Exp. | Theory | Exp. | |
| 0.608 | 0.606 | 0.584 | 0.583 | 0.609 | 0.606 | 0.635 | 0.637 | |
| 0.301 | 0.300 | 0.300 | 0.300 | 0.346 | 0.340 | 0.335 | 0.330 | |
| 0.476 | 0.477 | 0.558 | 0.558 | 0.537 | 0.537 | 0.560 | 0.557 | |
| 0.025 | 0.021 | 0.026 | 0.022 | 0.022 | - | 0.025 | 0.024 | |
| 0.011 | 0.020 | 0.008 | 0.020 | 0.014 | - | 0.012 | - | |
| 0.008 | 0.007 | 0.010 | 0.010 | 0.011 | - | 0.012 | 0.010 | |
| Parameter | Sm3+:CaF2 (cm-1) | SmSrF2 (cm-1) | ||
|---|---|---|---|---|
| Na+ | Li+ | Na+ | Li+ | |
| 47486 | 47522 | 47488 | 47598 | |
| 79010 | 79118 | 78625 | 79307 | |
| 57172 | 57194 | 58490 | 57249 | |
| 39566 | 39545 | 39027 | 39658 | |
| 1174 | 1172 | 1172 | 1173 | |
| -2112 | -2112 | -1890 | -1890 | |
| 945 | 945 | 776 | 776 | |
| -127 | -142 | -193 | -231 | |
| -9 | -34 | 0 | -40 | |
| 38 | -3 | 158 | 372 | |
| 132 | 225 | 169 | 272 | |
| -43 | -66 | -121 | -121 | |
| -340 | -439 | -208 | -59 | |
| -3 | 2 | -34 | -88 | |
| -228 | -199 | -200 | 58 | |
| 203 | 450 | 0 | 138 | |
| 0.0049 | 0.0046 | [0.0049] | [0.0046] | |
As can be seen in Tables LABEL:tab:eval and 3, excellent agreement is found between both the energy level data and the -value data. The fit to the ground-state hyperfine values was not as accurate. However, it was well within the rather large experimental uncertainty for Sm3+:Na+/Li+:CaF2. In the fit, the -value was weighted by a factor of compared to the Stark-level , reflecting the difference in magnitude of the -values relative to crystal-field splittings. Due to the large experimental uncertainty for the hyperfine parameters, the -value was weighted by a factor of ten compared to the -value (for the hyperfine parameters in cm-1). It was found that if the -value contribution was increased beyond this, the predicted -values differed considerably from the experimental values. The hyperfine data for the SrF2 compounds is incomplete, so the hyperfine coupling parameter was fixed to the respective CaF2 values.
4.5 Analysis of crystal-field parameters
Antipin et al. [4] used optical and EPR data to obtain crystal-field parameters for orthorhombic Dy3+ centres in fluorides. Their results are quite similar to ours. In particular, the fitted and crystal-field parameters are negative. It was found that changing the sign of did not adversely affect the fit to Stark levels, but the resulting spin Hamiltonian parameters were inconsistent with experiment. For example, for Sm3+:Na+:CaF2, changing the sign of B, but leaving the other parameters as in Tab. 4, gives a very different prediction for the spin-Hamiltonian parameters: , , and , cm-1, cm-1, and cm-1. These observations mirror what was reported for Dy3+ orthorhombic centres in fluorites.
The intrinsic crystal-field parameters discussed in Section 2.2 are always positive for (negatively charged) ligands [30, 31, 32], and Eq. (10), along with the geometry discussed in Section 2.2, therefore gives and , in agreement with the signs obtained in our fit.
In the C2v sites a Ca2+ ion on the axis is replaced by an Na+ or Li+, which, to a first approximation, is equivalent to a negatively charged ion at (Tab. 1). In Cartesian coordinates we have , , so from this simplistic analysis we would expect a positive and zero .
Antipin et al. [4] argued that the negative value of and the non-zero may be explained by a shift of the rare earth dopant towards the co-dopant alkaline-earth ion and an indirect exchange contribution mediated the fluorine ligands. In the context of the superposition model, a reduction of the intrinsic parameters for the two fluoride ligands closest to the alkali-earth would give a negative and positive . Changes in angles and distances due to distortions would further modify the parameters. In principle, the superposition model could be used to estimate the distortion, as was done by Newman and Stedman for rare-earth ions in garnet hosts [46]. However, in the case of the C2v centre discussed here, the number of degrees of freedom (of angles and ligand distances) made such an analysis intractable.
We note that the deviations from cubic symmetry are noticeably bigger for Li+ co-doped materials. We attribute this to the larger ionic radius mismatch between the co-dopant and the lattice ions for Li+ compared to Na+. It is possible that the symmetry has been lowered by the off-axis location of the Li+.
5 Conclusion
We have presented a spectroscopic study of the C2v centre in Sm3+:Na+/Li+:CaF2/SrF2, including both site-selective excitation and fluorescence spectroscopy and EPR. The data was utilized to perform a detailed crystal-field analysis of the orthorhombic center, for all four materials. The addition of Zeeman and hyperfine data proved essential to giving an unambiguous set of crystal-field parameters, in particular obtaining accurate values for the parameters. Our results are largely consistent with earlier studies of the orthorhombic centers in Dy3+ fluorides co-doped with alkaline earths. In agreement with that work, we confirm that the signs of the parameters are inconsistent with a simple electrostatic model. The analysis of this series of four materials, with a range of co-dopant and dopant ionic radius mismatches provides a unique dataset for exploring trends for a range of distortions of the cubic lattice symmetry.
Acknowledgments
We would like to thank Dr. G. D. Jones for many useful discussions. We would also like to acknowledge Mr. W. Smith for technical support. SPH acknowledges financial support in the form of a Canterbury Scholarship by the University of Canterbury.
References
References
- [1] Guillot-Noël O, Le Du Y, Beaudoux F, Antic-Fidancev E, Reid M F, Marino R, Lejay J, Ferrier A and Goldner P 2010 Journal of Luminescence 130 1557–1565 ISSN 0022-2313
- [2] Sukhanov A A, Likerov R F, Eremina R M, Yatsyk I V, Gavrilova T P, Tarasov V F, Zavartsev Y D and Kutovoi S A 2018 Journal of Magnetic Resonance 295 12–16
- [3] Baker J M and Blake W B J 1970 Proceedings of the Royal Society A 316 63–80
- [4] Antipin A, Davydova M, Eremin M, Luks R and Stolov A 1972 Optika i Spektroskopiya 33 673–680
- [5] Freeth C A and Jones G D 1982 Journal of Physics C: Solid State Physics 15 6833 ISSN 0022-3719
- [6] Falin M L, Gerasimov K I, Latypov V A, Leushin A M, bill H and Lovy D 2003 Journal of Luminescence 102–103 239–242
- [7] Zhong M, Hedges M P, Ahlefeldt R L, Bartholomew J G, Beavan S E, Wittig S M, Longdell J J and Sellars M J 2015 Nature 517 177–180
- [8] Usmani I, Afzelius M, de Riedmatten H and Gisin N 2010 Nature Communications 1 12
- [9] Lovrić M, Suter D, Ferrier A and Goldner P 2013 Physical Review Letters 111 020503
- [10] Longdell J J and Sellars M J 2004 Physical Review A 69 032307
- [11] Rippe L, Julsgaard B, Walther A, Ying Y and Kröll S 2008 Physical Review A 77 022307
- [12] Probst S, Rotzinger H, Wünsch S, Jung P, Jerger M, Siegel M, Ustinov A V and Bushev P A 2013 Physical Review Letters 110 157001
- [13] Fernandez-Gonzalvo X, Chen Y H, Yin C, Rogge S and Longdell J J 2015 Physical Review A 92 062313
- [14] Weber M J and Bierig R W 1964 Physical Review 134 A1492–A1503
- [15] Reeves R J, Jones G D and Syme R W G 1992 Physical Review B 46 5939–5958
- [16] Wells J P R and Reeves R J 2000 Physical Review B 61 13593–13608
- [17] Murdoch K M, Jones G D and Syme R W G 1997 Physical Review B 56 1254–1268
- [18] Strickland N M and Jones G D 1997 Physical Review B 56 10916–10929
- [19] Zakharchenya B and Rusanov I 1966 Soviet Physics Solid State, USSR 8 31–& ISSN 0038-5654
- [20] Jamison S P, Reeves R J, Pavlichuk P P and Jones G D 1999 Journal of Luminescence 83–84 429–434 ISSN 0022-2313
- [21] Pack D W, Manthey W J and McClure D S 1989 Physical Review B 40 9930–9944
- [22] Yamaga M, Yabashi S, Masui Y, Honda M, Takahashi H, Sakai M, Sarukura N, Wells J P R and Jones G D 2004 Journal of Luminescence 108 307–311 ISSN 0022-2313
- [23] Liu G 2006 Electronic Energy Level Structure Spectroscopic Properties of Rare Earths in Optical Materials ed Liu G and Jacquier B (Springer Science & Business Media)
- [24] Reid M F 2016 Handbook on the Physics and Chemistry of the Rare Earths vol 37 ed Bünzli J C and Percharsky V K (North Holland) chap 284, pp 47–64
- [25] Carnall W T, Goodman G L, Rajnak K and Rana R S 1989 Journal of Chemical Physics 90 3443–3457 ISSN 0021-9606, 1089-7690
- [26] Wybourne B G 1965 Spectroscopic properties of rare earths (Interscience Publishers)
- [27] Judd B R 1963 Operator techniques in atomic spectroscopy (McGraw-Hill New York)
- [28] McLeod D P and Reid M F 1997 Journal of Alloys and Compounds 250 302–305
- [29] Wells J P R, Jones G D, Reid M F, Popova M N and Chukalina E P 2004 Molecular physics 102 1367–1376
- [30] Newman D J 1971 Advances in Physics 20 197–256
- [31] Newman D J and Ng B 1989 Reports on Progress in Physics 52 699–763
- [32] Newman D J and Ng B K C (eds) 2000 Crystal Field Handbook (Cambridge: Cambridge University Press)
- [33] Macfarlane R M and Shelby R M 1987 Spectroscopy of solids containing rare earth ions ed Kaplyanskii A A and Macfarlane R M (North-Holland, Amsterdam) p 51
- [34] Hurtubise V and Freed K F 1993 Advances in Chemical Physics 83 465–465
- [35] Hurtubise V and Freed K F 1993 Journal of Chemical Physics 99 7946–7969 ISSN 0021-9606, 1089-7690
- [36] Manthey W J 1973 Physical Review B 8 4086–4098
- [37] Wood D L and Kaiser W 1962 Physical Review 126 2079–2088
- [38] Schoemaker D 1966 Physical Review 149 693–704
- [39] Yamaga M, Honda M, Kawamata N, Samejima K and Wells J P R 2002 EPR in the 21st Century ed Kawamori A, Yamauchi J and Ohta H (Amsterdam: Elsevier Science B.V.) pp 201–206 ISBN 978-0-444-50973-4
- [40] Wales D J and Doye J P K 1997 Journal of Physical Chemistry A 101 5111–5116 ISSN 1089-5639
- [41] Wales D J and Scheraga H A 1999 Science 285 1368–1372 ISSN 0036-8075, 1095-9203 PMID: 10464088
- [42] Johnson S G The NLopt nonlinear-optimization package http://ab-initio.mit.edu/nlopt
- [43] Powell M J 2009 Cambridge NA Report NA2009/06, University of Cambridge, Cambridge
- [44] Horvath S P The pycf crystal-field theory package https://bitbucket.org/sebastianhorvath/pycf
- [45] Carnall W, Goodman G, Rajnak K and Rana R 1989 Journal of Chemical Physics 90 3443–3457
- [46] Newman D J and Stedman G E 1969 Journal of Computational Physics 51 3013–3023