Novel optical interferometry of synchrotron radiation for absolute electron beam energy measurements
Abstract
A novel interferometric method is presented for the measurement of the absolute energy of electron beams. In the year 2016, a pioneering experiment was performed using a 195 MeV beam of the Mainz Microtron (MAMI). The experimental setup consisted of two collinear magnetic undulators as sources of coherent optical synchrotron light and a high-resolving grating monochromator. Beam energy measurements required the variation of the relative undulator distance in the decimeter range and the analysis of the intensity oscillation length in the interference spectrum. A statistical precision of 1 keV was achieved in 1 hour of data taking, while systematic uncertainties of 700 keV were present in the experiment. These developments aim for a relative precision of in the absolute momentum calibrations of spectrometers and high-precision hypernuclear experiments. Other electron accelerators with beam energies in this regime such as the Mainz Energy Recovering Superconducting Accelerator (MESA) might benefit from this new method.
keywords:
Electron accelerator , Beam energy measurement , Optical interferometry , Undulator , Synchrotron radiation1 Introduction
During the last years, a new method of decay-pion spectroscopy was pioneered at the Mainz Microtron (MAMI), which has the potential to achieve mass measurements of several light hypernuclei with a precision better than 50 keV [1, 2]. Such a high precision is indeed required, e.g., for the determination of the spin dependence of the charge symmetry breaking effect in light hypernuclei [3]. Furthermore, a planned precision measurement of the mass of lightest hypernucleus, composed of a proton, a neutron, and a -particle, will address the so-called hypertriton puzzle [4]. Presently, the largest systematic error in these experiments originated from the uncertainty in the MAMI beam energy affecting the absolute momentum calibration of the spectrometers by 100 keV, the sum of all other systematic errors contributed one order of magnitude less [2].
In this work, a novel interferometric method is presented for the measurement of the absolute energy of electron beams in the range of 100 to 200 MeV. The method is based on the analysis of the intensity oscillation length in the synchrotron spectrum from two collinear sources, thus reducing the energy determination to a relative distance measurement in the decimeter range and the spectroscopy of a narrow optical wavelength band.
The paper is organized as follows. After introducing different methods for the energy determinations at electron accelerators in Section 2, the MAMI accelerator is briefly reviewed in Section 3 with a focus on its energy stability and absolute energy determination. The operating principle of the novel method is presented in Section 4. In Section 5, the experimental setup used for the pioneering experiment at MAMI is described. Images of the synchrotron radiation from different measurements are shown in Section 6. Results from the evaluations of the spectra and the determination of the MAMI beam energy are shown in Section 7. A conclusion follows in Section 8.
2 Energy determinations at electron accelerators
In storage rings, the beam energy can be measured with a relative uncertainty of few from the integrated dipole field along the ring [5]. At some facilities, e.g., at the VEPP-4M collider at BINP and at the SPEAR3 electron storage ring, more precise determinations have been achieved with the resonant spin depolarization technique. Relative uncertainties for the energy measurement on the order of were realized for VEPP-4M [6] and on the order of for SPEAR3 [7]. The application of this method is limited to spin-polarized beams in high-energy storage rings and therefore cannot be used at MAMI, in which the beam is passing the accelerator only once.
The Compton backscattering method does not require a polarized beam and can be used in a wide range of beam energies from a few hundred MeV to a few GeV. The relative uncertainty of this method is usually on the order of [5, 8, 9]. In these measurements, beam particles are collided head-on with photons from a laser. The maximum energy of the backscattered Compton -rays is measured with high-purity germanium detectors and converted into the central primary beam energy. The systematic uncertainty of the method is dominated by the absolute calibration of the energy scale of the detector for the -ray. The Compton backscattering of laser photons realized at BESSY I and BESSY II has reached accuracies of at 1 718 MeV [9] and at a lower energy of 800 MeV [8]. With the same method, a relative systematic uncertainty of was achieved for the 1 840 MeV beam at BEPC-II [10].
The application of the method to lower beam energies is challenging because of the continuous decrease of the Compton edge with decreasing beam energy:
| (1) |
where is the energy of the laser photon and the Lorentz factor of the beam. When colliding laser photons of 800 nm with an electron beam of 500 MeV, the resulting energy spectrum extends to MeV which can be determined with the best possible calorimeters with an uncertainty of a few keV, resulting in a theoretical resolution of a few . For a beam energy of 195 MeV this theoretical best resolution increases to above few . Furthermore, the -ray collimation as well as the finite electron beam emittance impacts on the -ray spectrum. Under certain beam conditions, the determination of the beam energy from the spectrum is significantly influenced [5].
To overcome these limitations, a new method is developed for the low energy electron beams at MAMI. Other electron accelerators with beam energies in this regime such as the Mainz Energy Recovering Superconducting Accelerator (MESA), currently under construction, might benefit from this work. MESA will consist of two cryo-modules with an acceleration capacity of 25 MeV each and three recirculation arcs for a maximum beam energy of 155 MeV. The MESA beam energy will be stabilized using the return arc with maximum longitudinal dispersion and two beam phase cavity monitors. Because of high demands from the experiments, among them the detection of order parity-violating cross section asymmetries in electron scattering, the beam energy fluctuations need to be minimized to unprecedented low levels and the absolute beam energy needs to be determined with high precision.
3 The MAMI electron accelerator
MAMI is a multi-stage accelerator based on normal conducting radio-frequency (rf) cavities that can deliver a continuous-wave (cw) electron beam [11, 12, 13]. Electrons are drawn from the source with a static high voltage of 100 kV and are further accelerated by an injector linear accelerator (linac) to an energy of 3.5 MeV, reaching relativistic velocities of 0.99. The recirculating part consists of three cascaded racetrack microtrons (RTMs) and an additional harmonic double-sided microtron (HDSM) as a fourth stage. In each RTM, the beam is recirculated through two homogeneous 180∘ dipole magnets to a common linac section composed of a series of axially coupled accelerating cavities that are powered by several klystrons using a rf of 2.45 GHz. The first two RTMs accelerate the beam to 14.9 MeV and 180 MeV, respectively. The third RTM has 90 return paths to the linac section and the beam can be extracted from all even-numbered paths, so that this stage has a final energy from 180 to 855 MeV in 15 MeV steps. The beam intensity is limited by the available rf power to a maximum current of 100 A. The HDSM consists of two normal conducting linacs through which the electrons are guided up to 43 times by a pair of 90∘-bending magnets at each end. For stable beam dynamics, the linacs operate at the harmonic frequencies of 4.90 and 2.45 GHz. This stage can deliver a beam with energies of up to 1.6 GeV.
The energy spread of a typical beam from RTM3 is dominated by the stochastic emission of synchrotron radiation photons. This energy loss per turn grows with the third power of the beam energy. Fortunately, the strong longitudinal focusing in RTMs compensates synchrotron radiation losses in each turn by a proper phase migration. Residual rf phase and amplitude fluctuations have only little influence on the beam energy. The remaining width is 13 keV corresponding to a relative energy spread of when expressing the beam energy by its Lorentz factor .
An excellent energy stability with a very small drift over time of less than 1 keV has been realized by a combination of two digital feedback loops [14]. A fast loop eliminates output energy deviations by acting on the rf phase using the time-of-flight dependence of bunches from the last return path to the extraction beam line. A slow loop stabilizes the measured tune of the RTM3 by small changes of the linac amplitude. [15]
The absolute beam energy can be measured using magnetic spectrometry inside the RTM3 stage of the accelerator by exact determination of the beam position on the linac axis and in a higher (73rd) return path. The main instrumentation is a 9.8 GHz XY beam position monitor (XYMO), whose transverse separation of its electrical center to the linac axis is known with a precision of approximately 0.4 mm. The resolution of the monitor is much higher than 0.1 mm in diagnostic pulse mode. For the energy measurements, the beam is first centered on the linac axis and then centered with the use of calibrated correction steerer magnets on the XYMO axis. From the correction currents, the bending radius of the beam in the 73rd turn can be calculated. The magnetic field inside the RTM3 dipoles is known by NMR measurements and the field accuracy is on the order of . The total uncertainty of the beam energy at MeV is 120 keV including contributions from geodetic measurement errors, calibration errors of the steerers, and dominant angle errors. By use of the well established and benchmarked particle tracking program PTRACE, the beam energy of the extracted turn number can be interpolated from the value . The uncertainty for is 130 keV when including a systematic error from the interpolation on the order of 55 keV. A conservative error estimation for the absolute energy of MAMI including rf phase and amplitude errors leads to a total accuracy of keV [16].
4 Interferometry of synchrotron radiation
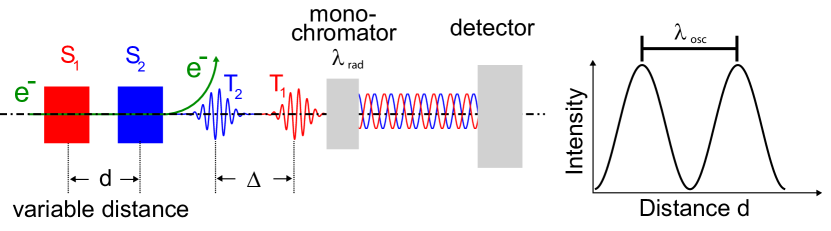
The method is based on interferometry with two spatial separated light sources driven by relativistic electrons [17, 18, 19]. The basic idea will be explained by means of the schematic drawing shown in Fig. 1. An electron beam with Lorentz factor passes a pair of undulators S1 and S2 separated by a distance . Further details of the undulator pair can be found in Section 5.1. The succession of the wave trains T1 and T2 at the exit of the undulator pair is opposite to the order of the two sources because the electron velocity is slower than the speed of light. These trains are separated along the axis by the distance
| (2) |
which is a linear function in . Details on the superposition of the two wave trains are given in [17]. The slope is only dependent on the Lorentz factor and the observation angle with respect to the electron beam direction. The dimensionless undulator parameter is and is the length of the undulator with the undulator period and is the number of periods. The undulators act as sources for the emission of coherent light with the amplitudes of the two wave trains having a phase difference of for a selected wavelength of the radiation. The intensity of the two interfering sources is given by:
| (3) |
A monochromator can serve as a Fourier analyzer of the wave trains. If both wave trains interfere in a position sensitive detector and is varied by moving one of the sources, then the revolving phase can be observed as intensity oscillations with oscillation length . For a wavelength selected by the monochromator and on-axis observation at , the oscillation length directly relates to the Lorentz factor ,
| (4) |
which was first pointed out in [18]. Both as well as can be measured with very high precision. The method is independent of the nature of the emission process, provided that the produced light is coherent.
5 Experimental setup
5.1 Undulator pair
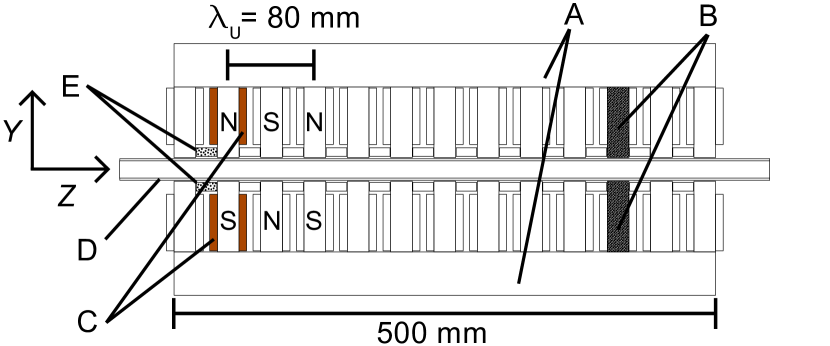
To realize beam energy measurements in the range of 100 to 200 MeV with synchrotron radiation interferometry, an undulator pair with an undulator parameter and wavelengths in the visible range are practical. Such wavelengths allow the use of high-resolving optical monochromators and spectrometers. Fig. 2 shows a drawing of the cross section of the undulators in the middle plane. The number of periods in each undulator was . An undulator period of mm and magnetic field amplitudes of mT were achieved with normal conducting coils, where the current through the coil pairs could be individually controlled. The resulting undulator parameter was , for which wavelengths near 400 nm were expected in the synchrotron spectrum.
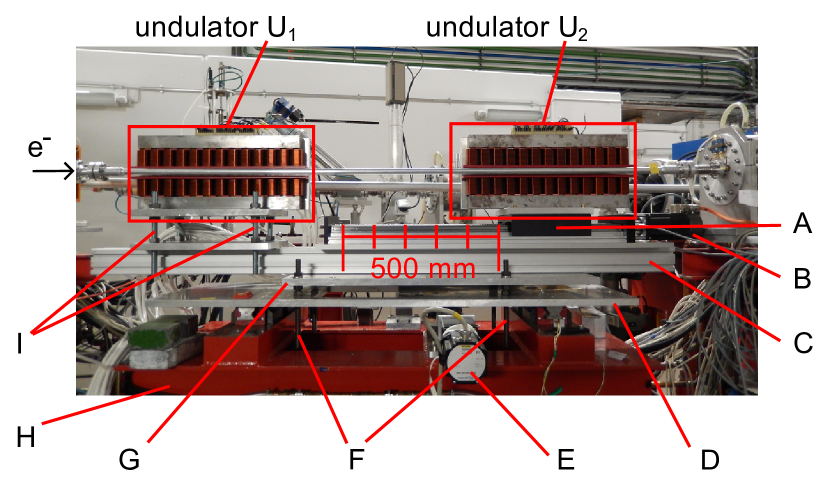
Fig. 3 shows a photograph of the setup at the electron beam line. A high-precision linear stage could move undulator U2 away from undulator U1 a distance between 0 and 500 mm along the beam axis, thus covering approximately in one beam energy measurement. The position was given by a rotational sensor counting the turns of a spindle. The heights of the undulators were aligned with respect to each other. In order to correct the orientation of the undulators against each other, one of the undulators could be tilted. The adjustment of the angle to the beam line was achieved with sub-mrad precision by tilting the aluminium base. Longitudinal alignment of the undulator pair with respect to beam line elements was done by an aluminium profile. Angular misalignments can cause contributions to the oscillation length, so stiffness against torsion or bending of the setup while moving the undulator was crucial. A welded steel construction supported the setup.
5.2 Undulator fields
To minimize systematic uncertainties in the beam energy measurements, the beam inside of the two undulators should follow identical trajectories and the light emission cones from the undulators should be on-axis. The beam deflection angle is proportional to the integral along the -direction over the magnetic field projected on the beam momentum:
| (5) |
The second integral over the vertical magnetic field component determines the spatial offset of the beam in horizontal direction:
| (6) |
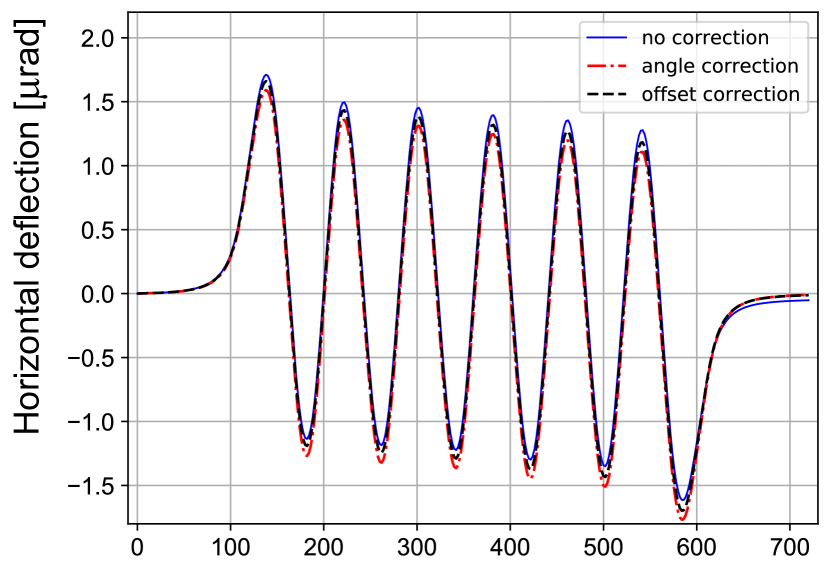
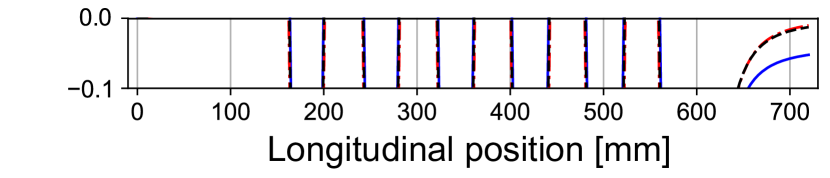
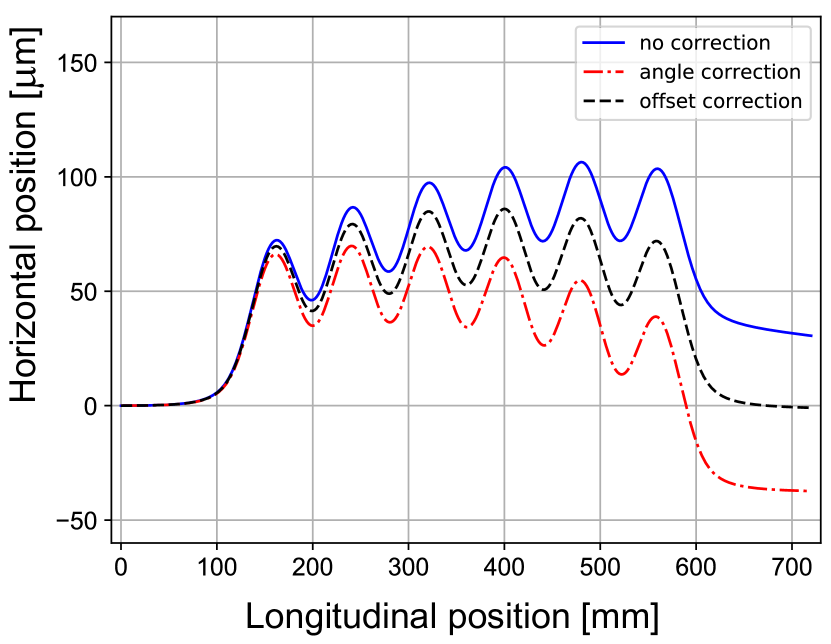
A Hall probe [20] was moved along the beam axis to generate a linear map of the magnetic fields. Fig. 4 shows the stepwise computed deflection angle for three configurations of the coil currents. Without any adjustments to the current distributions in the undulators, a residual angle rad remained at mm, where the beam leaves the field region. It was minimized by increasing the current in the first pair of coils and decreasing in the last pair by a smaller amount. The residual deflection angle after this adjustment was rad. The compensation of the deflection angle led to a residual beam offset of m, being of the same size as for the initial current distribution but of opposite sign. This offset was subsequently corrected by changing the coil currents symmetrically according to the condition , where denotes the change of current in the first coil pair and in the last coil pair. This condition ensured that the residual deflection angle remained constant and close to zero. Fig. 5 shows the second integrals along the -direction representing the beam trajectories in the horizontal direction for the three coil current configurations. Without coil current adjustment, the residual offset was m and after both adjustments, the residual offset was m. This two-step correction procedure was successfully performed for both undulators. The final coil current configuration ensured the emission of synchrotron light from identical electron beam trajectories up to the level of the accuracy of the hall probe.
5.3 Optical interferometer system

The synchrotron light was observed with an optical interferometer system based on a Czerny Turner monochromator of type HR 640 from Jobin Yvon [21] at a distance m from the undulators. A schematic drawing of the spectrometer is shown in Fig. 6. A 5 mm diameter aperture in the light path collimated the synchrotron light to an angular acceptance of mrad. This beam was incident on an imaging objective with 50 mm focal length. The objective projected the beam to the focal point of the collimator mirror. The beam was then reflected by the mirror, which rendered it parallel and directed it to the planar grating. The monochromator could be equipped with a prism of low dispersion and large wavelength acceptance or, alternatively, with a grating of 1200 lines per mm. For divergent light, the grating provided a resolution of . The monochromator directed the dispersed light spectrum to the camera mirror, which focused the image of the vertical entrance aperture on the focal plane. The components of the optical system were aligned with a collimated and frequency-doubled Nd:Yag laser at 532 nm.
For the calibration of absolute wavelengths and of the dispersion of the monochromator, optical light sources with well known spectral lines were used. For the spectral range from 396 to 410 nm, the two Hg lines at 404.6565 nm and 407.7837 nm ( nm) [22] of a mercury vapor lamp were best suited and the systematic errors from the absolute spectral calibration were negligible.
5.4 CCD camera
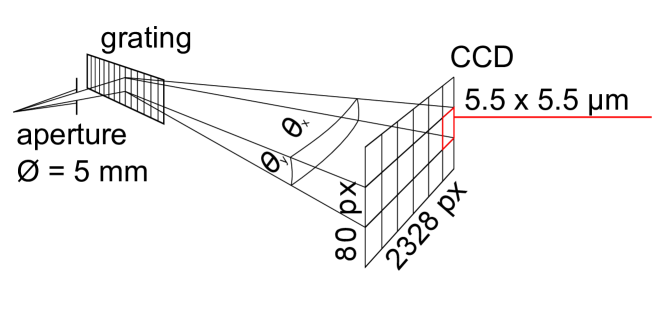
A camera of type avA2300-25gm from Basler [23] with a charged-coupled device (CCD) image sensor of pixels (px) from Kodak [24] was used as optical detector in the interferometer system. It can deliver 26 frames per second with 4 megapixels per frame. This camera was chosen for its high quantum efficiency 30 % at 400 nm in the short wavelength band. Its pixel size of m2 matched the spectrometer resolution. The movement of the undulator was synchronized with the image taking of the camera so that each image corresponded to a fixed distance between the undulators.
Fig. 7 shows a schematic drawing of the CCD setup. The chip size in the horizontal direction could fully be used in the focal plane of the spectrometer. In the vertical direction, the light cone leaving the spectrometer was projected onto 80 pixels. In the measurements that used a grating, the high dispersion and the limited acceptance led to a light intensity not exceeding a few thousand photons per second and pixel for electron beam currents of A. Typical exposure times were 2.5 s long, which is the maximum exposure time for this camera. Four pixels in the vertical direction were binned together to compensate for the low light intensity. Further minimization of the relative counting error was achieved by averaging 5 consecutive images. Each image has been taken with a gain setting of 600 using the full ADC depth of 12 bit and has been stored in a 16 bit image file.
6 Synchrotron radiation measurements at MAMI
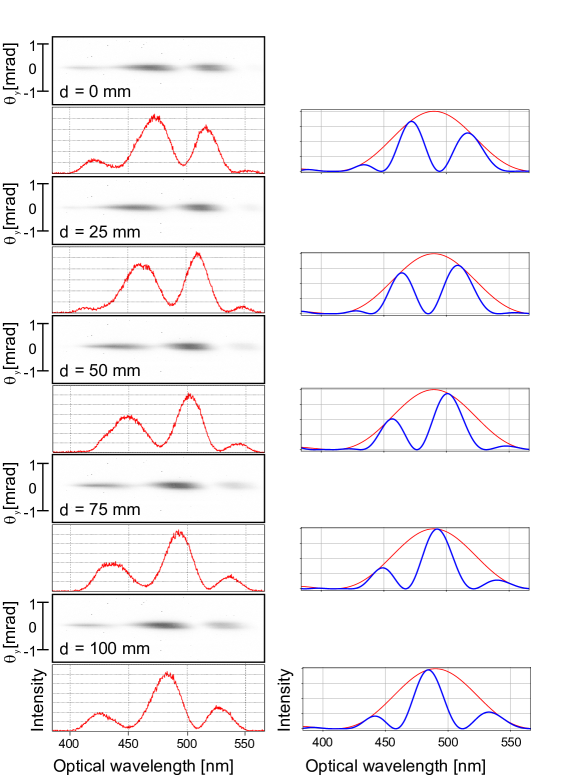

The two undulators were used as synchrotron radiation sources at MAMI in two consecutive beam-times to verify their proposed application for absolute beam energy measurements. The nominal beam energy was 195.2 MeV as determined by the standard method introduced in Section 3. The undulator pair acted as a source of coherent synchrotron light emitted under very small angles with respect to the electron beam and leaving the beam pipe through a window. The first beam-time used a prism as a monochromator. It served as a demonstration of the functionality of the experimental setup, of the coherence of the synchrotron radiation, and of the precision of the optical system. Fig. 8 shows a series of images and corresponding synchrotron spectra taken for five different undulator distances in steps of mm. Non-linearities of the prism, aberrations of the optics in front of the CCD, and incomplete coherence of the undulator radiation led to small differences between the predicted and measured spectra.
For the determination of the oscillation length the distance was varied in steps of 0.5 mm so that approximately 200 separate spectra could be analyzed. The evolution of the intensity distribution is shown in Fig. 9 for the five selected positions together with the full intensity variation for two selected wavelengths near 450 nm and 500 nm. As expected, the intensity for each wavelength in the spectrum varied periodically as the undulator moved. It was verified that the oscillation length increased proportional to the wavelength. The right column of Fig. 8 shows the analytical predictions assuming perfect optical imaging and no coherence loss.
The on-axis coherence for perfectly aligned undulators is limited only by the beam emittance. For a beam energy of 195 MeV from the RTM3, the normalized beam emittance in the horizontal plane and vertical plane is m mrad and m mrad, respectively [15]. In addition, the coherence decreases with non-vanishing observation angles . The conditions to be satisfied in order to avoid a decrease of on-axis coherence larger than for a selected wavelength and distance between detector and undulators are [17]:
| (7) |
For a wavelength nm, a distance m and the given emittances, the first coherence condition requires m, which is fulfilled by the extends of the experimental setup. The second condition sets a limit to the observation angles of mrad and mrad, which is fulfilled by an alignment of the setup with sub-mrad angular precision.
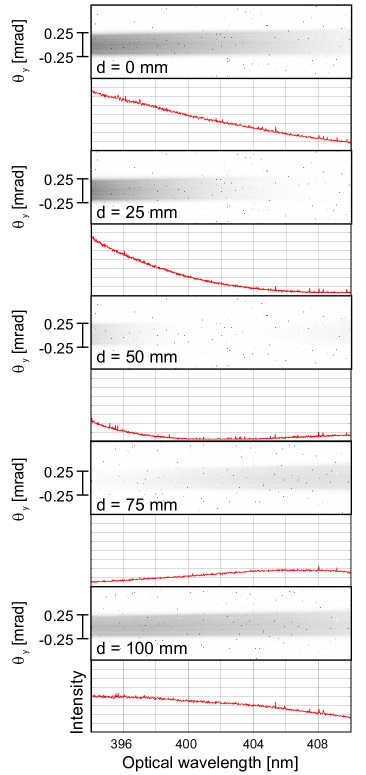
In the second beam-time, the measurements have been continued with a grating monochromator that provided an approximately 60 times larger dispersion. The horizontal axis of the camera, aligned in the dispersive direction of the spectrometer, resolved the wavelengths with 162 pxnm. The chip size with all 2 328 pixels in a row covered a range of approximately 15 nm. The spectrum was spread vertically over 80 pixels, with each point determined by the sum of four pixels. A single row had an angular acceptance of mrad. Fig. 10 shows a series of camera images for different distances . The spectra below the images show the intensity distributions for the single row at minimum . For a step width of 1 mm between undulator positions, the duration for one measurement run was 1 hour.
7 Determination of MAMI beam energies
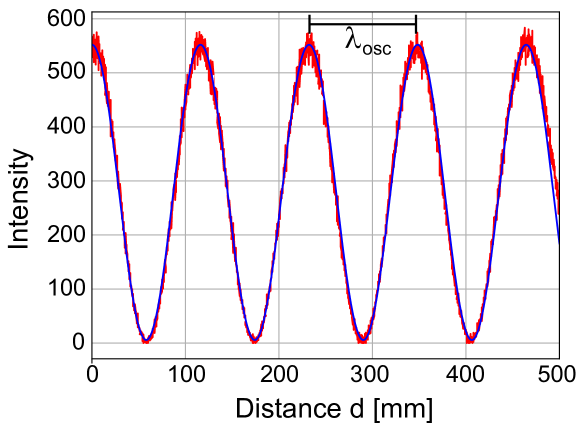
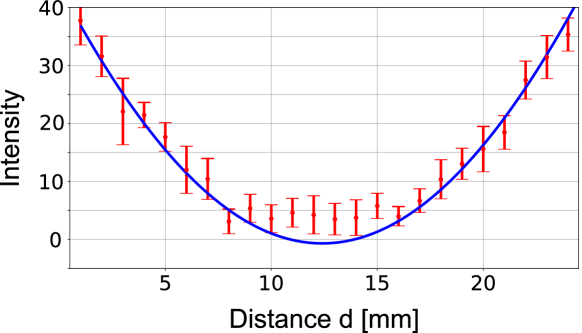
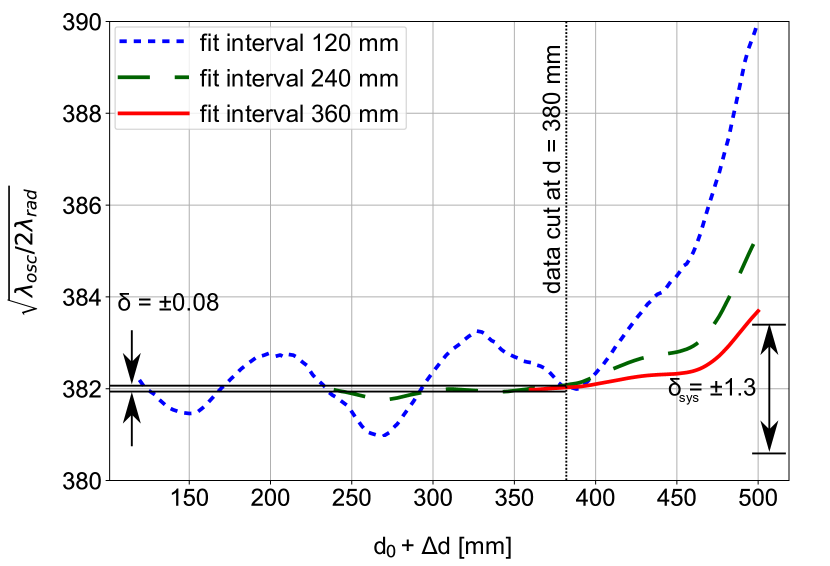
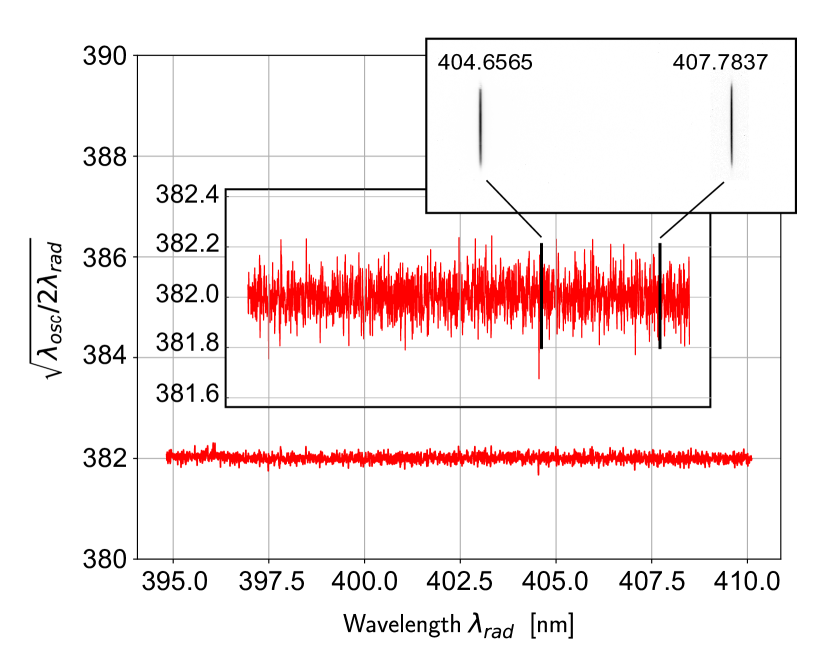
Fig. 11 shows the periodic variation of the intensity at one exemplary wavelength band at 396 nm and at minimum as a function of the distance . Based on the least squares method, the free parameters intensity , oscillation length , oscillation phase , and intensity offset were determined by a fit of the data to the following function:
| (8) |
For the determination of the electron beam energy, the single row of the CCD image at mrad was used, which defined the vertical center of the synchrotron radiation cone. From the intensity oscillation, the interference observable could be extracted for each wavelength band corresponding to a single CCD pixel. This observable represents the Lorentz factor of the electron beam plus contributions depending on differences between light emission and observation angles. With the accepted wavelength band of the monochromator covering all 2 328 CCD pixels in the horizontal direction of the camera, the same number of simultaneous determinations of interference oscillations could be performed in one measurement run.
The analysis of the residua between the fit function and data revealed some systematic deviations, especially for the largest scanned distances of mm and near the positions of minimum intensity. Fig. 11 illustrates such deviations for one exemplary wavelength band. The robustness of the fitting procedure was then studied by varying the length of the fit interval and the start point of the fit interval. Fig. 12 shows the interference observable averaged over all wavelength bands. For approximately equal to one oscillation length, systematic variations on the order of with a periodicity of one oscillation length were observed. These systematic variations decreased rapidly when the fit interval was increased. For the final data set, the residua between the fit function and data points followed a normal distribution with a width of .
A Monte Carlo simulation for the light intensity as a function of was performed using a sine function with the nominal value for the oscillation length. The simulated data followed a normal distribution with respect to the sine function for intensities above 10 % of the maximum intensity and a Poissonian distribution for intensities below. This approach ensured the positiveness of intensity values as it is the case in real cameras. Fits to the simulated data with an sine function produced alternating deviations on the order of with a periodicity similar to the oscillation length, revealing that the observed systematic deviations were caused by the camera. The simulation confirmed that the effect on the extracted fit parameters becomes negligible, when longer fit intervals are used.
At larger distances mm, the permanent excursion of the interference observable above the systematic error band indicated the onset of additional contributions. The value, which was evaluated with the standard procedure to provide a measure for the goodness of the fit, also increased for larger start points . This behavior can be expected when additional contributions to the sine function are present in the data. To minimize such contributions, the data was cut at mm in all further analyzes.
The amplitudes of the intensity oscillations showed no significant variation with increasing undulator distances. The coherence of the synchrotron light observed with the experimental setup was studied by fixing the fit interval to one oscillation length. The coherence as determined by was for from 0 to 300 mm.
The relative uncertainties in the Lorentz factor of the beam were given by
| (9) |
and were dominated by the uncertainty of the horizontal angle between the electron beam and the observation axis of the synchrotron radiation, that enters into the uncertainty of the oscillation length:
| (10) |
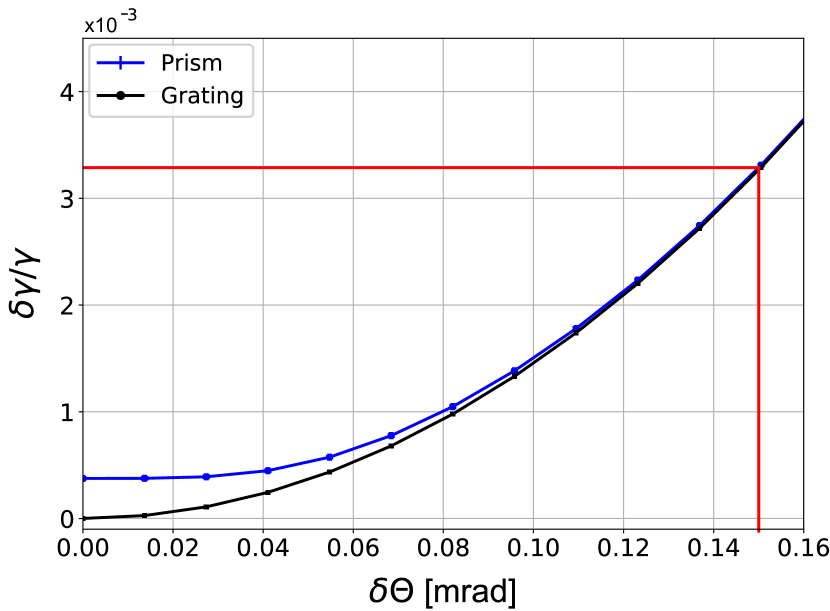
Figure 14 shows the relative uncertainty as a function of the uncertainty on the observation angle for the two types of monochromators used in the beam-times. For an angular uncertainty of mrad, the resulting systematic uncertainty is 1.3. The uncertainty from the spectral calibration over the full width of the focal plane led to a systematic uncertainty of at least one order of magnitude smaller. Since the statistical noise of the CCD increased with intensity, the oscillation curves showed larger fluctuations near the maximum positions as compared to the minimum positions. The interference observable was calculated as the arithmetic mean over all wavelength bands in the spectrum so that the statistical error of a single measurement was reduced by a factor and became negligible compared to systematic effects.
Fig. 13 shows the measured interference observable for the 2 328 different wavelength bands taken during one measurement run. The values were deduced from the observed interference oscillations for mrad and the cut at mm was applied. Deviations from a straight line would indicate systematic effects possibly caused by alignment errors or imperfect tuning of the undulator fields. No wavelength dependence was observed. The arithmetic mean value was corrected by a factor of , which was determined from the integration over the finite angular acceptance.
Most stable operation conditions for the accelerator can be achieved after reaching a thermal equilibrium in all components, typically many hours after the start-up. Because of the short beam-time, these conditions may not have been reached during the measurements and the nominal beam energy of 195.2 MeV might have had a substantial uncertainty of up to 0.3 MeV corresponding to . The determined Lorentz factor of the beam, measured in 1 hour of data taking with the undulator setup, was:
where the systematic uncertainties were dominated by possible angular misalignments. The corresponding beam energy
is consistent with the nominal beam energy.
8 Summary and conclusions
Relativistic electrons deflected by two identical magnetic sections generate interfering synchrotron radiation that can be used for the precise diagnostics of the electron beam energy when the distance between the sources is varied. A pioneering experiment has been carried out at MAMI to demonstrate this new method. The interference of synchrotron radiation from two undulators was measured over a range of up to 500 mm by analyzing the spectrum with a monochromator. No coherence loss was observed. The statistical uncertainty could be reduced to a level of 1 keV by combining 2 328 measurements simultaneously. Systematic uncertainties were dominated by possible angular misalignments up to 0.15 mrad. By the use of improved equipment and alignment techniques, these misalignments should get controlled on the level of 0.03 mrad. The method will then provide an unprecedented precision of corresponding to an uncertainty in the absolute beam energy on the same order of magnitude as the MAMI beam energy width . The great potential of this method is achieved by reducing the observables for a beam energy measurement to a wavelength band in a monochromator and a relative distance of two light sources in the decimeter range. Such an accurate energy determination is important for precision hypernuclear physics experiments on fundamental symmetries. It should also be useful for precision studies of the accelerator operation and it is worth to note that other electron accelerators in the energy regime MeV such as S-DANILAC or MESA might benefit from this new development.
Acknowledgments
We would like to thank the MAMI operators, technical staff, and the accelerator group for their excellent support of the experiments. Discussions with M. Dehn are gratefully acknowledged.
Work supported by Deutsche Forschungsgemeinschaft (DFG) through Integrated Research Training Group GRK 2128 and Research Grant PO 256/7-1. We acknowledge support by DAAD PPP 57345295/JSPS Research Cooperative Program and by JSPS KAKENHI No. JP17H01121 and the Graduate Program on Physics for the Universe, Tohoku University (GP-PU).
References
- Esser et al. [2015] A. Esser, S. Nagao, F. Schulz, P. Achenbach, C. Ayerbe Gayoso, R. Böhm, O. Borodina, D. Bosnar, V. Bozkurt, L. Debenjak, M. O. Distler, I. Friščić, Y. Fujii, T. Gogami, O. Hashimoto, S. Hirose, H. Kanda, M. Kaneta, E. Kim, Y. Kohl, J. Kusaka, A. Margaryan, H. Merkel, M. Mihovilovič, U. Müller, S. N. Nakamura, J. Pochodzalla, C. Rappold, J. Reinhold, T. R. Saito, A. Sanchez Lorente, S. Sánchez Majos, B. S. Schlimme, M. Schoth, C. Sfienti, S. Širca, L. Tang, M. Thiel, K. Tsukada, A. Weber, K. Yoshida (A1 Collaboration), Observation of H hyperhydrogen by decay-pion spectroscopy in electron scattering, Phys. Rev. Lett. 114 (2015) 232501. doi:10.1103/PhysRevLett.114.232501.
- Schulz et al. [2016] F. Schulz, P. Achenbach, S. Aulenbacher, J. Beričič, S. Bleser, R. Böhm, D. Bosnar, L. Correa, M. O. Distler, A. Esser, H. Fonvieille, I. Friščić, Y. Fujii, M. Fujita, T. Gogami, H. Kanda, M. Kaneta, S. Kegel, Y. Kohl, W. Kusaka, A. Margaryan, H. Merkel, M. Mihovilovič, U. Müller, S. Nagao, S. N. Nakamura, J. Pochodzalla, A. S. Lorente, B. S. Schlimme, M. Schoth, C. Sfienti, S. Širca, M. Steinen, Y. Takahashi, L. Tang, M. Thiel, K. Tsukada, A. Tyukin, A. Weber (A1 Collaboration), Ground-state binding energy of H from high-resolution decay-pion spectroscopy, Nucl. Phys. A 954 (2016) 149–160. doi:10.1016/j.nuclphysa.2016.03.015.
- Achenbach [2017] P. Achenbach, Charge symmetry breaking in light hypernuclei, Few Body Syst. 58 (2017) 17. doi:10.1007/s00601-016-1178-x.
- Achenbach et al. [2018] P. Achenbach, W. Lauth, J. Pochodzalla, High-precision measurement of light hypernuclear masses (HiHyp), DFG Project PO 256/7-1, 2018. URL: http://gepris.dfg.de/gepris/projekt/397465087.
- Sun et al. [2009] C. Sun, J. Li, G. Rusev, A. P. Tonchev, Y. K. Wu, Energy and energy spread measurements of an electron beam by Compton scattering method, Phys. Rev. ST Accel. Beams 12 (2009) 062801. doi:10.1103/PhysRevSTAB.12.062801.
- Blinov et al. [2009] V. E. Blinov, A. V. Bogomyagkov, N. Y. Muchnoi, S. A. Nikitin, I. B. Nikolaev, A. G. Shamov, V. N. Zhilich, Review of beam energy measurements at VEPP-4M collider: KEDR/VEPP-4M, Nucl. Instrum. Methods Phys. Res. A 598 (2009) 23–30. doi:10.1016/j.nima.2008.08.078.
- Wootton et al. [2012] K. P. Wootton, M. J. Boland, R. P. Rassool, Y.-R. Tan, W. J. Corbett, M. Donald, X. Huang, R. R. Ortiz, J. A. Safranek, K. Tian, Resonant spin depolarisation measurements at the SPEAR3 electron storage ring, in: Proceedings 3rd International Particle Accelerator Conference (IPAC2012), New Orleans, Louisiana, USA, 20–25 May 2012, 2012, pp. 771–773. URL: https://accelconf.web.cern.ch/accelconf/IPAC2012/.
- Klein et al. [1997] R. Klein, T. Mayer, P. Kuske, R. Thornagel, G. Ulm, Beam diagnostics at the BESSY I electron storage ring with Compton backscattered laser photons: measurement of the electron energy and related quantities, Nucl. Instrum. Methods Phys. Res. A 384 (1997) 293–298. doi:10.1016/S0168-9002(96)00899-6.
- Klein et al. [2002] R. Klein, P. Kuske, R. Thornagel, G. Brandt, R. Görgen, G. Ulm, Measurement of the BESSY II electron beam energy by Compton-backscattering of laser photons, Nucl. Instrum. Methods Phys. Res. A 486 (2002) 545–551. doi:10.1016/S0168-9002(01)02162-3.
- Zhang et al. [2012] J. Y. Zhang, E. V. Abakumova, M. N. Achasov, V. E. Blinov, X. Cai, H. Y. Dong, C. D. Fu, F. A. Harris, V. V. Kaminsky, A. A. Krasnov, Q. Liu, X. H. Mo, N. Y. Muchnoi, I. B. Nikolaev, Q. Qin, H. M. Qu, S. L. Olsen, E. E. Pyata, A. G. Shamov, C. P. Shen, K. Y. Todyshev, G. S. Varner, Y. F. Wang, Q. Xiao, J. Q. Xu, T. B. Zhang, Y. H. Zhang, A. A. Zhukov, The beam energy measurement system for the Beijing electron-positron collider, Nucl. Phys. B Proc. Suppl. 225–227 (2012) 309–314. doi:10.1016/j.nuclphysbps.2012.02.064.
- Herminghaus et al. [1976] H. Herminghaus, A. Feder, K.-H. Kaiser, W. Manz, H. v. d. Schmitt, The design of a cascaded 800 MeV normal conducting C.W. race track microtron, Nucl. Instrum. Methods 138 (1976) 1–12. doi:10.1016/0029-554X(76)90145-2.
- Kaiser et al. [2008] K.-H. Kaiser, K. Aulenbacher, O. Chubarov, M. Dehn, H. Euteneuer, F. Hagenbuck, R. Herr, A. Jankowiak, P. Jennewein, H.-J. Kreidel, U. Ludwig-Mertin, M. Negrazus, S. Ratschow, S. Schumann, M. Seidl, G. Stephan, A. Thomas, The 1.5 GeV harmonic double-sided microtron at Mainz University, Nucl. Instrum. Methods Phys. Res. A 593 (2008) 159–170. doi:10.1016/j.nima.2008.05.018.
- Dehn et al. [2011] M. Dehn, K. Aulenbacher, R. Heine, H.-J. Kreidel, U. Ludwig-Mertin, A. Jankowiak, The MAMI C accelerator: the beauty of normal conducting multi-turn recirculators, Eur. Phys. J. ST 198 (2011) 19–47. doi:10.1140/epjst/e2011-01481-4.
- Seidl et al. [2000] M. Seidl, H. Euteneuer, K.-H. Kaiser, W. Klag, H.-J. Kreidel, F. Maas, J. Röthgen, G. Stephan, High precision beam energy stabilisation of the Mainz Microtron MAMI, in: Proceedings 7th European Particle Accelerator Conference (EPAC2000), Vienna, Austria, 26–30 June 2000, 2000, pp. 1930–1932. URL: http://cds.cern.ch/record/509204.
- Euteneuer et al. [1994] H. Euteneuer, F. Hagenbuck, R. Herr, J. Herrmann, K. Herter, M. O. Ihm, K.-H. Kaiser, C. Klümper, H.-P. Krahn, H.-J. Kreidel, U. Ludwig-Mertin, G. Stephan, T. Weis, Beam measurements and operating experience at MAMI, in: Proceedings 4th European Particle Accelerator Conference (EPAC94), London, England, 27 June – 1 July 1994, vol. 1, 1994, pp. 506–508.
- Jankowiak [2006] A. Jankowiak, Compilation of: Measurement of the electron beam energy at the Mainz Microtron, MAMI Internal Report 03/06, Institut für Kernphysik, Johannes Gutenberg-Universität Mainz, 2006.
- Dambach et al. [1998] S. Dambach, H. Backe, T. Doerk, N. Eftekhari, H. Euteneuer, F. Görgen, F. Hagenbuck, K.-H. Kaiser, O. Kettig, G. Kube, W. Lauth, H. Schöpe, A. Steinhof, T. Tonn, T. Walcher, Novel interferometer in the soft x-ray region, Phys. Rev. Lett. 80 (1998) 5473–5476. doi:10.1103/PhysRevLett.80.5473.
- Dambach [1999] S. Dambach, Ein neuartiges Interferometer im Spektralbereich weicher Röntgenstrahlung, Doctorate thesis, Institut für Kernphysik, Johannes Gutenberg-Universität, Mainz, 1999.
- Lauth et al. [2006] W. Lauth, H. Backe, O. Kettig, P. Kunz, A. Sharafutdinov, T. Weber, Coherent x-rays at MAMI, Eur. Phys. J. A 28 (2006) 185–195. doi:10.1140/epja/i2006-09-019-0.
- Group3 [2006] Group3, DTM-151 Digital Teslameter, Auckland, New Zealand, 2006. URL: http://www.group3technology.com/vdb/document/51.
- Horiba Jobin Yvon [1993] Horiba Jobin Yvon, HR640 Operators Manual, Longjumeau, France, 1993. URL: http://www.horiba.com/fileadmin/uploads/Scientific/Documents/OSD/HR640.pdf.
- Kramida et al. [2015] A. Kramida, Yu. Ralchenko, J. Reader, and NIST ASD Team, NIST Atomic Spectra Database (ver. 5.3), 2015. URL: http://physics.nist.gov/asd.
- Basler [2011] Basler, avA2300-25gm Camera Specification, Ahrensburg, Germany, 2011. URL: https://www.baslerweb.com/fp-1486541807/media/downloads/documents/emva_data/Basler_avA2300-25gm_EMVA_Standard_1288.pdf.
- Kodak [2012] Kodak, KAI-04050 Image Sensor Datasheet, New York, USA, 2012. URL: http://datasheet.datasheetarchive.com/originals/library/Datasheets-UR100/DSA3H009141.pdf.