Spectral Evidence for Emergent Order in Ba1-xNaxFe2As2
Abstract
We report an angle-resolved photoemission spectroscopy study of the iron-based superconductor family, Ba1-xNaxFe2As2. This system harbors the recently discovered double-Q magnetic order appearing in a reentrant C4 phase deep within the underdoped regime of the phase diagram that is otherwise dominated by the coupled nematic phase and collinear antiferromagnetic order. From a detailed temperature-dependence study, we identify the electronic response to the nematic phase in an orbital-dependent band shift that strictly follows the rotational symmetry of the lattice and disappears when the system restores C4 symmetry in the low temperature phase. In addition, we report the observation of a distinct electronic reconstruction that cannot be explained by the known electronic orders in the system.
pacs:
71.20.-b, 74.25.Jb, 74.70.Xa, 79.60.-i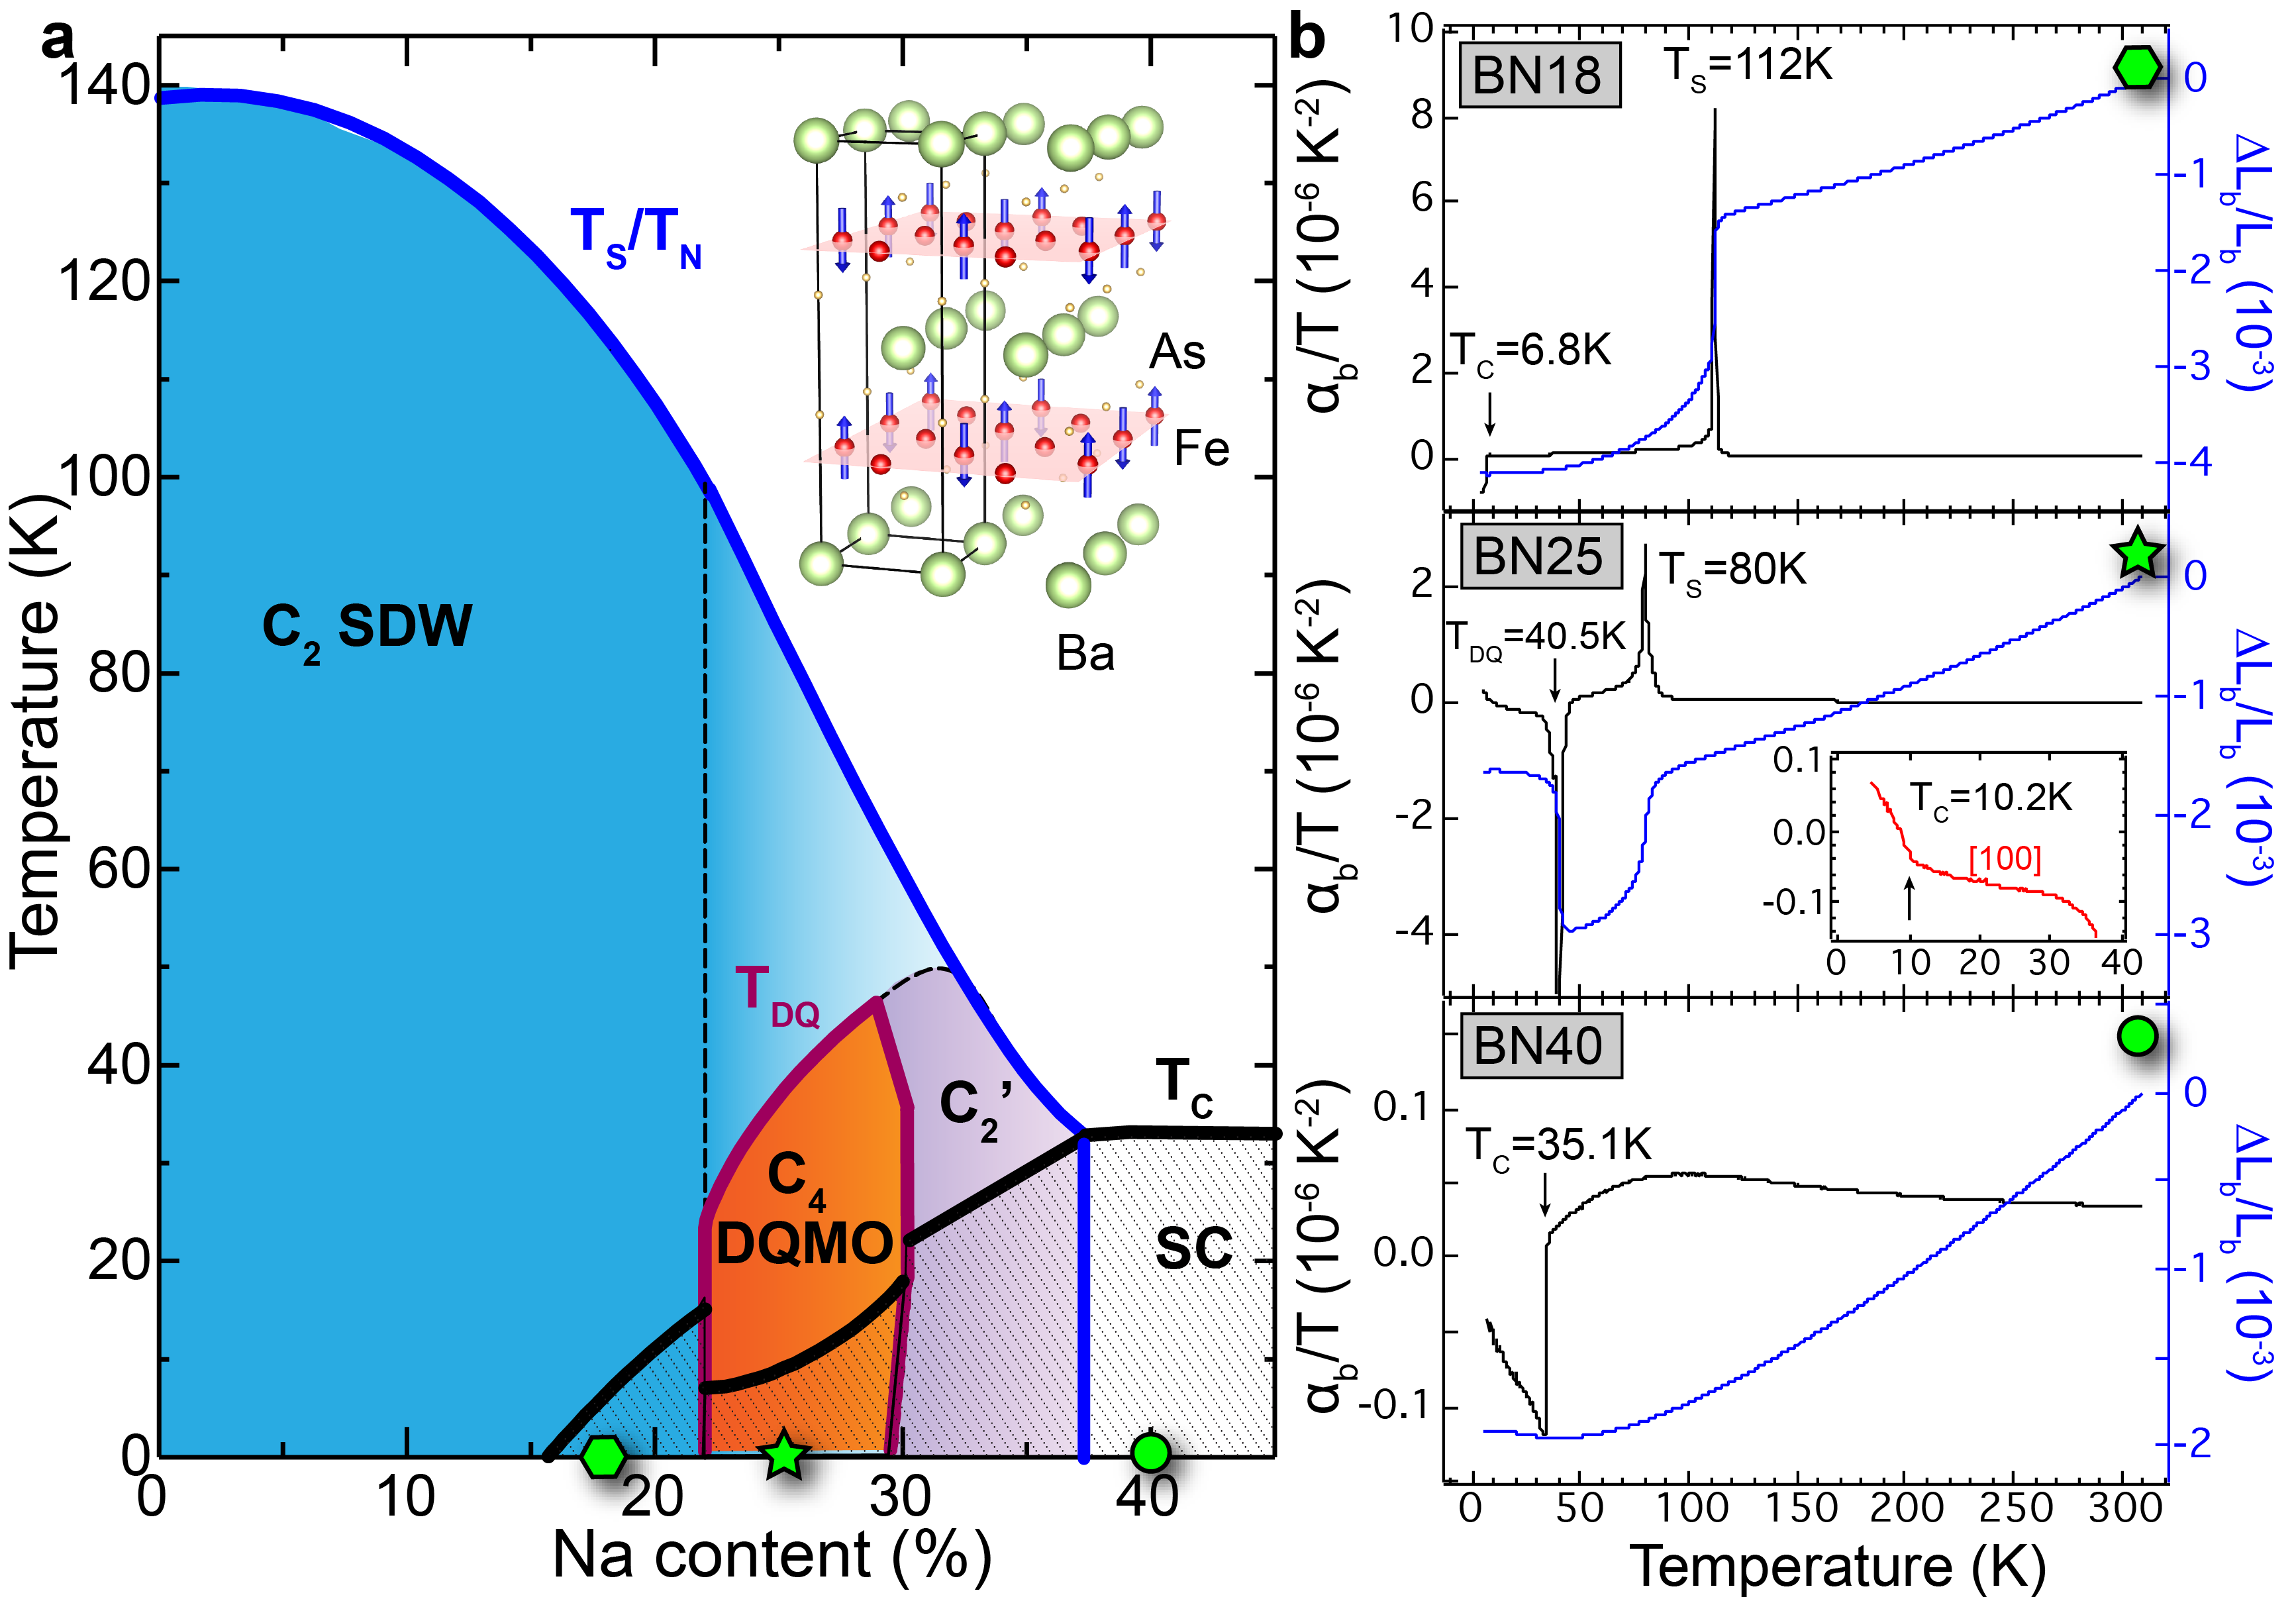
Quantum phases emerge in strongly correlated electron systems via the interplay of four fundamental degrees of freedom: lattice, charge, orbital, and spin. For both copper- and iron-based high temperature superconductors, the spin degree of freedom plays a prominent role as long-range magnetism has been found in the parent phase of both materials Keimer et al. (2015); Dai (2015). In the iron-based superconductors (FeSCs), magnetic order has largely been discussed in relation to the orbital degrees of freedom after the discovery of the electronic nematic phase Chu et al. (2010); Tanatar et al. (2010) and the associated orbital symmetry breaking Yi et al. (2011), which is accompanied by the C4 rotational symmetry breaking through the tetragonal to orthorhombic structural transition. The coupled collinear antiferromagnetic order (CAF) and the nematic order persist throughout the underdoped region of many FeSC families. Very recently, however, a reentrant C4 magnetic phase has been discovered in the underdoped region of many hole-doped FeSCs ((Ba,Sr,Ca)Fe2As2 doped with Na/K) close to the optimal doping where is maximal Avci et al. (2014); Allred et al. (2016); Waßer et al. (2015); Wang et al. (2016); Böhmer et al. (2015); Taddei et al. (2017). Within this reentrant C4 phase, tetragonal symmetry is restored while the spin order persists and reconstructs, suggesting the interesting possibility of the decoupling of spin order and nematic order. Mössbauer Allred et al. (2016) and neutron diffraction Waßer et al. (2015) measurements together demonstrate that the magnetic order in the reentrant C4 phase is of a double-Q type, where the moments point along the c-axis and follow the superposition of two spin density waves along = and = in the tetragonal 2-Fe Brillouin zone notation, and became known as the double-Q magnetic order (DQMO). Spatially, this spin structure can be viewed as two Fe sublattices where one sublattice is antiferromagnetic while the other is non-magnetic, respecting C4 rotational symmetry (inset of Fig. 1a).
To elucidate the interactions between the rich electronic orders in this system, we study the reentrant C4 phase in the Ba1-xNaxFe2As2 family using angle-resolved photoemission spectroscopy (ARPES). Three doping regimes in the Ba1-xNaxFe2As2 family are studied, x=0.18 (BN18), 0.25 (BN25), and 0.4 (BN40), representing the C2 phase-only regime, the reentrant C4 phase regime, and the purely superconducting phase regime, respectively (Fig. 1). Prominent orbital anisotropy is observed in the nematic phase of BN18, consistent with the understanding of nematic order in other FeSCs. For BN25, we observe a similar anisotropic orbital-dependent band shift that onsets as the system enters the nematic phase marked by , and disappears when the system enters the reentrant C4 phase at lower temperatures. In addition, we observe a distinct electronic reconstruction exhibiting a different temperature evolution. This new electronic reconstruction cannot be explained by any of the known electronic orders in the system, including nematicity, CAF, and DQMO. The absence of this type of electronic reconstruction in the other doping regimes strongly suggests that this order arises from a coupling to the DQMO, potentially revealing a parallelism akin to the coupling between the nematic phase and CAF prevalent in the underdoped regime of FeSCs.
High quality single crystals of Ba1-xNaxFe2As2 were grown using the self-flux method Wang et al. (2016), and individually characterized by thermal expansion measurements via dilatometry Böhmer and Meingast (2016) (Fig. 1b). Throughout this Letter, we refer to the transition temperatures of the structural distortion, CAF order, DQMO, and superconductivity as , , , and , respectively. BN18 in the very underdoped regime undergoes the structural and magnetic transitions at = = 112K, and superconducts at = 6.8K. BN25 first goes through the structural/magnetic transitions at = = 80K, then enters the reentrant C4 magnetic phase at = 40.5K, and finally superconducts at = 10.2K. BN40 only exhibits superconductivity onsetting at = 35.1K. ARPES measurements were carried out at beamlines 5-4 and 5-2 of the Stanford Synchrotron Radiation Lightsource and beamline 10.0.1 of the Advanced Light Source using SCIENTA R4000 electron analyzers. The total energy resolution was set to 10 meV or better and the angular resolution was 0.3o. Single crystals were cleaved in-situ at 10 K. All measurements were done in ultrahigh vacuum with a base pressure lower than 4x10-11 torr. The simulations were produced based on a 3-dimensional five-orbital tight-binding model of BaFe2As2 from Density Functional Theory (DFT) band structure Graser et al. (2010). To match roughly the observed band structure of BN25, the DFT band structure for undoped BaFe2As2 was shifted up by 0.12eV in energy to account for the hole-doping, and then renormalized by a factor of 4.3. For consistency, we use the tetragonal 2-Fe notation, where the lattice constants for BN25 at 300K are = = 3.921Å, and = 13.110Å.
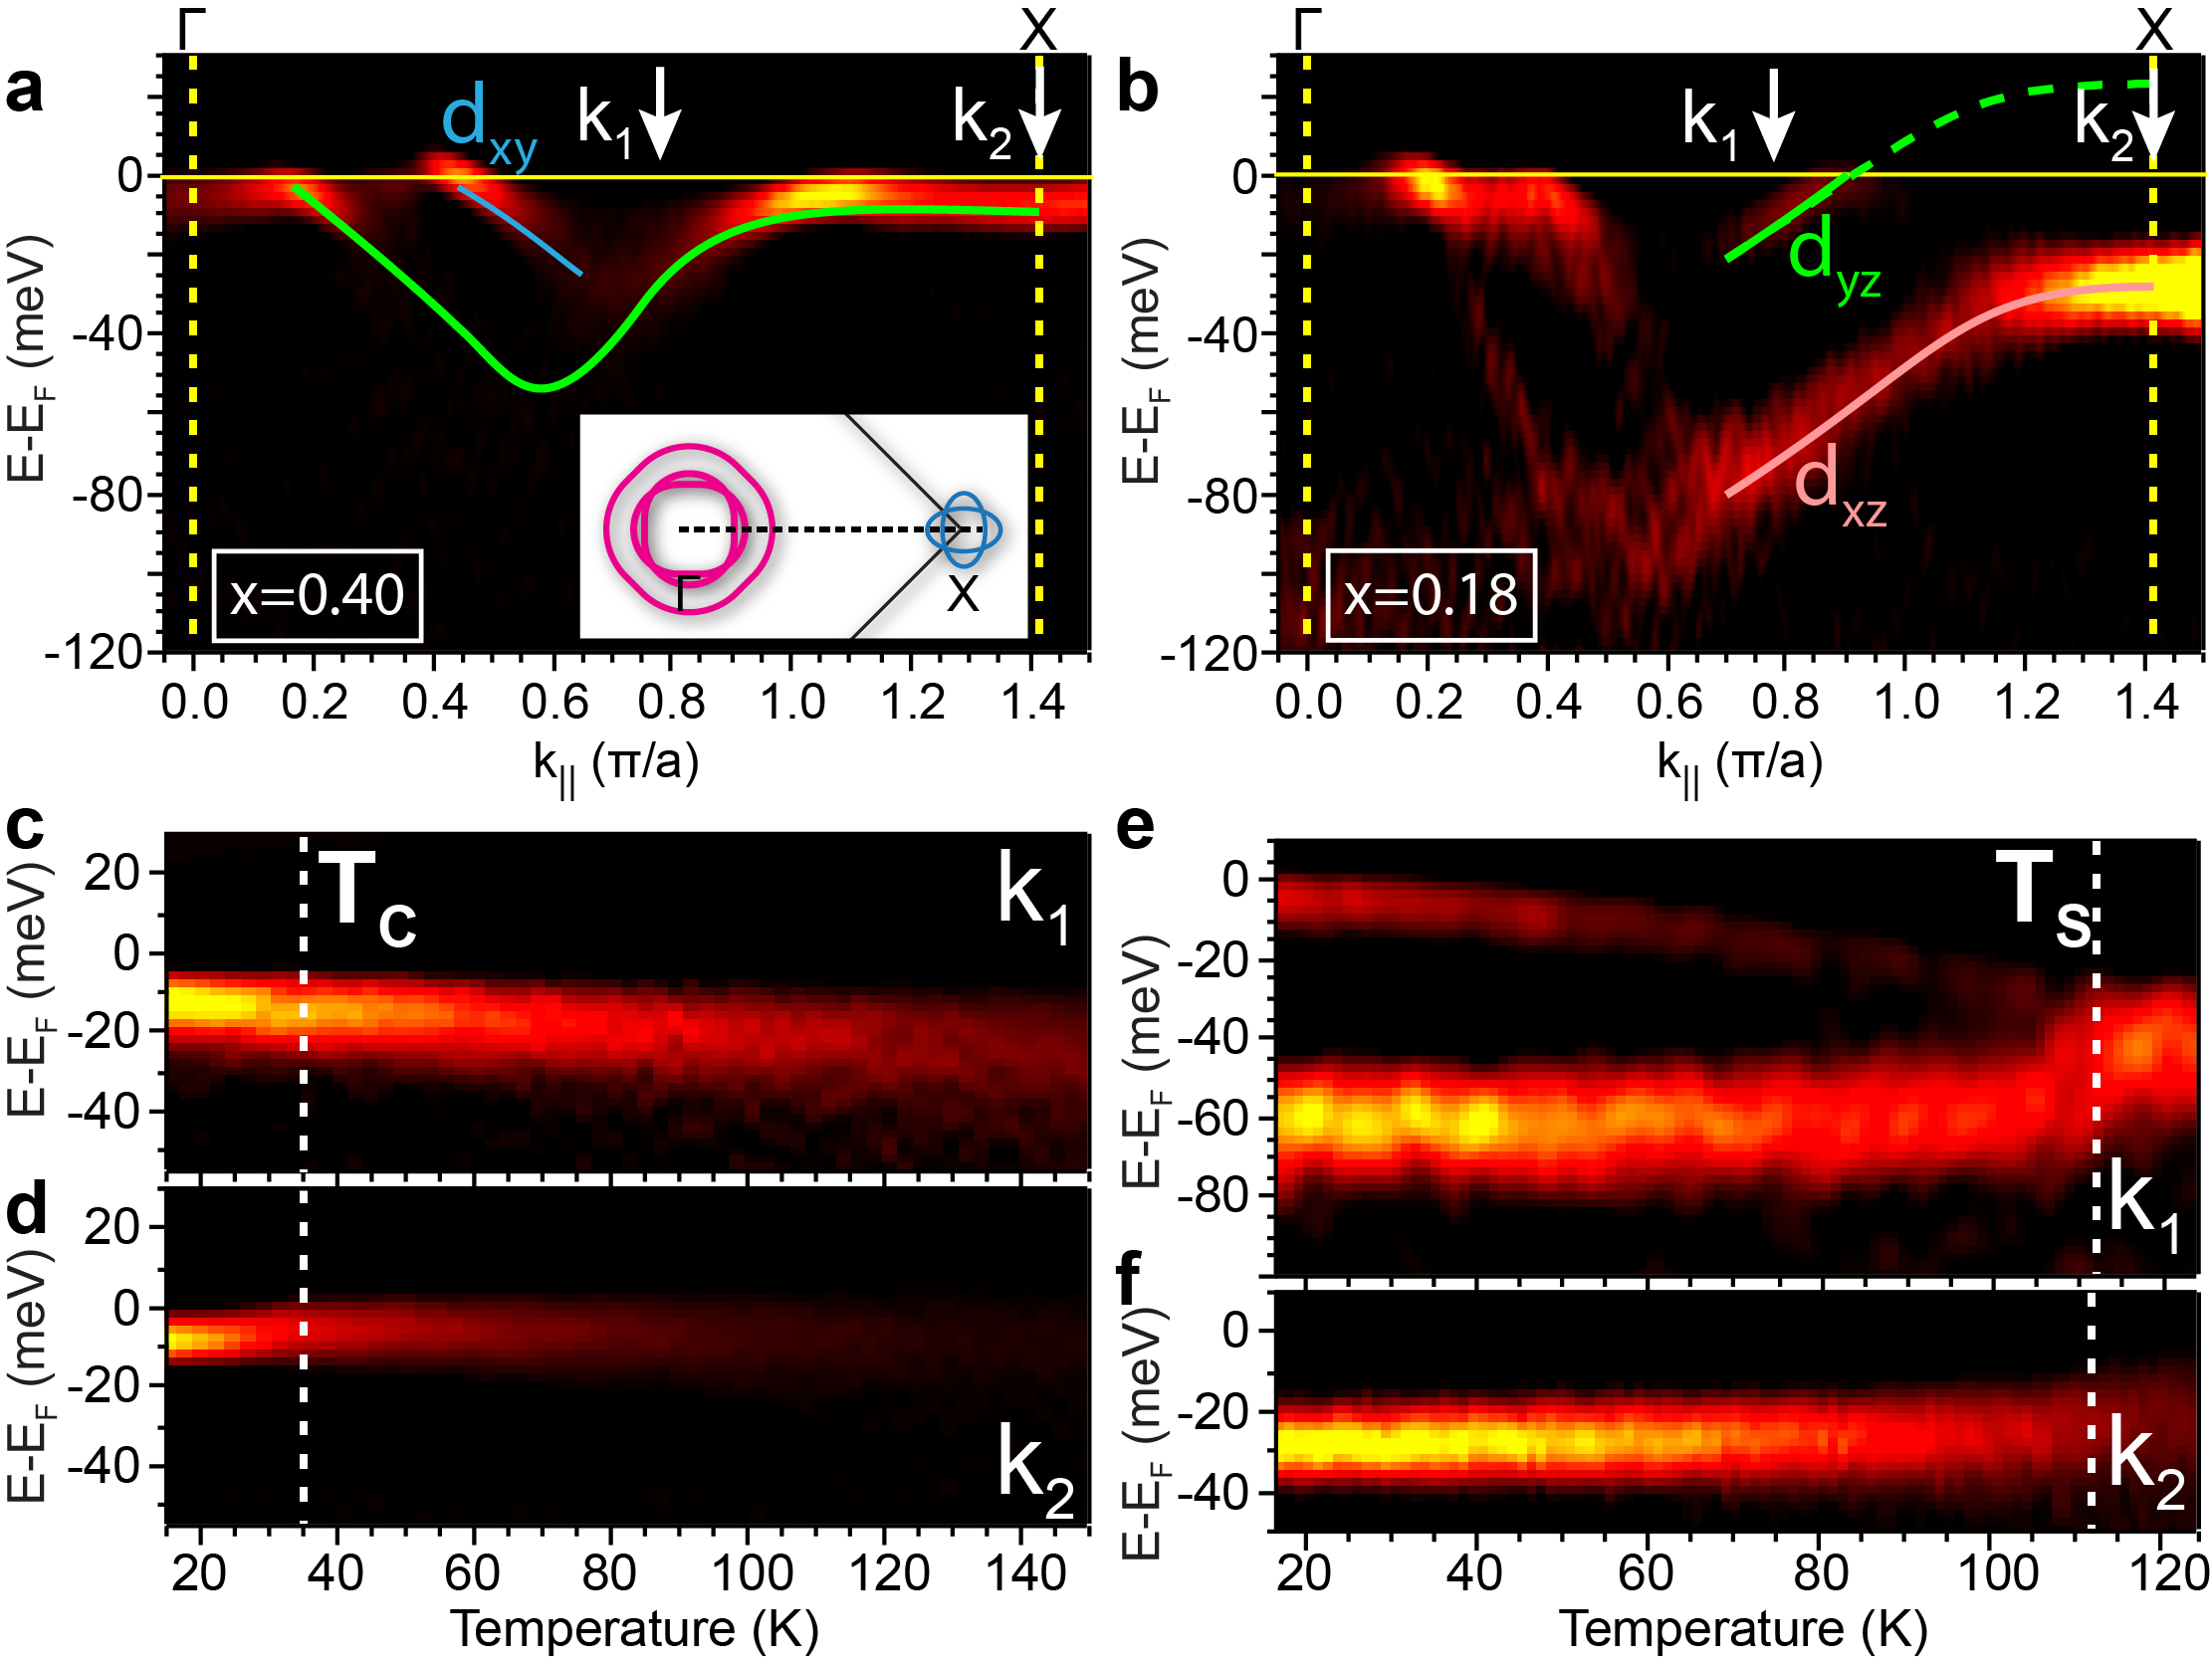
We begin with the simplest compound, BN40, which has no symmetry breaking phases except superconductivity (Fig. 2a). The measured band dispersions are very similar to those of the widely studied optimally hole-doped FeSC, Ba1-xKxFe2As2 Zhao et al. (2008); Zhang et al. (2010); Xu et al. (2011). Under polarization, two hole bands are visible near . The one with a larger momentum crossing, , is of orbital character Yi et al. (2011). The one with a smaller disperses and upturns into an intense, flat, hole-like feature towards the X point. This band is predominantly of character along , and by C4 symmetry, along . No anomalous band reconstruction is observed in the temperature dependence (Fig. 2c-d). Next we examine BN18. Since this sample is unstressed, the development of structural domains in the nematic phase allows us to observe both orthogonal directions simultaneously. In the normal state, the band is degenerate with its counterpart, the band in the orthogonal direction. When C4 symmetry is broken at the onset of the nematic phase, this degeneracy is lifted with an upward (downward) shift of the () band in orthogonal directions. On a twinned sample, this orbital-dependent band shift is therefore manifested in a band splitting (Fig. 2b)—a hallmark of the orbital anisotropy associated with the electronic nematic order Yi et al. (2011). This splitting onsets clearly at (Fig. 2e). We note that in order to see this, we must go to a momentum in between and X, such as , as the band shifts to above at the X point, making it unobservable (Fig. 2f).
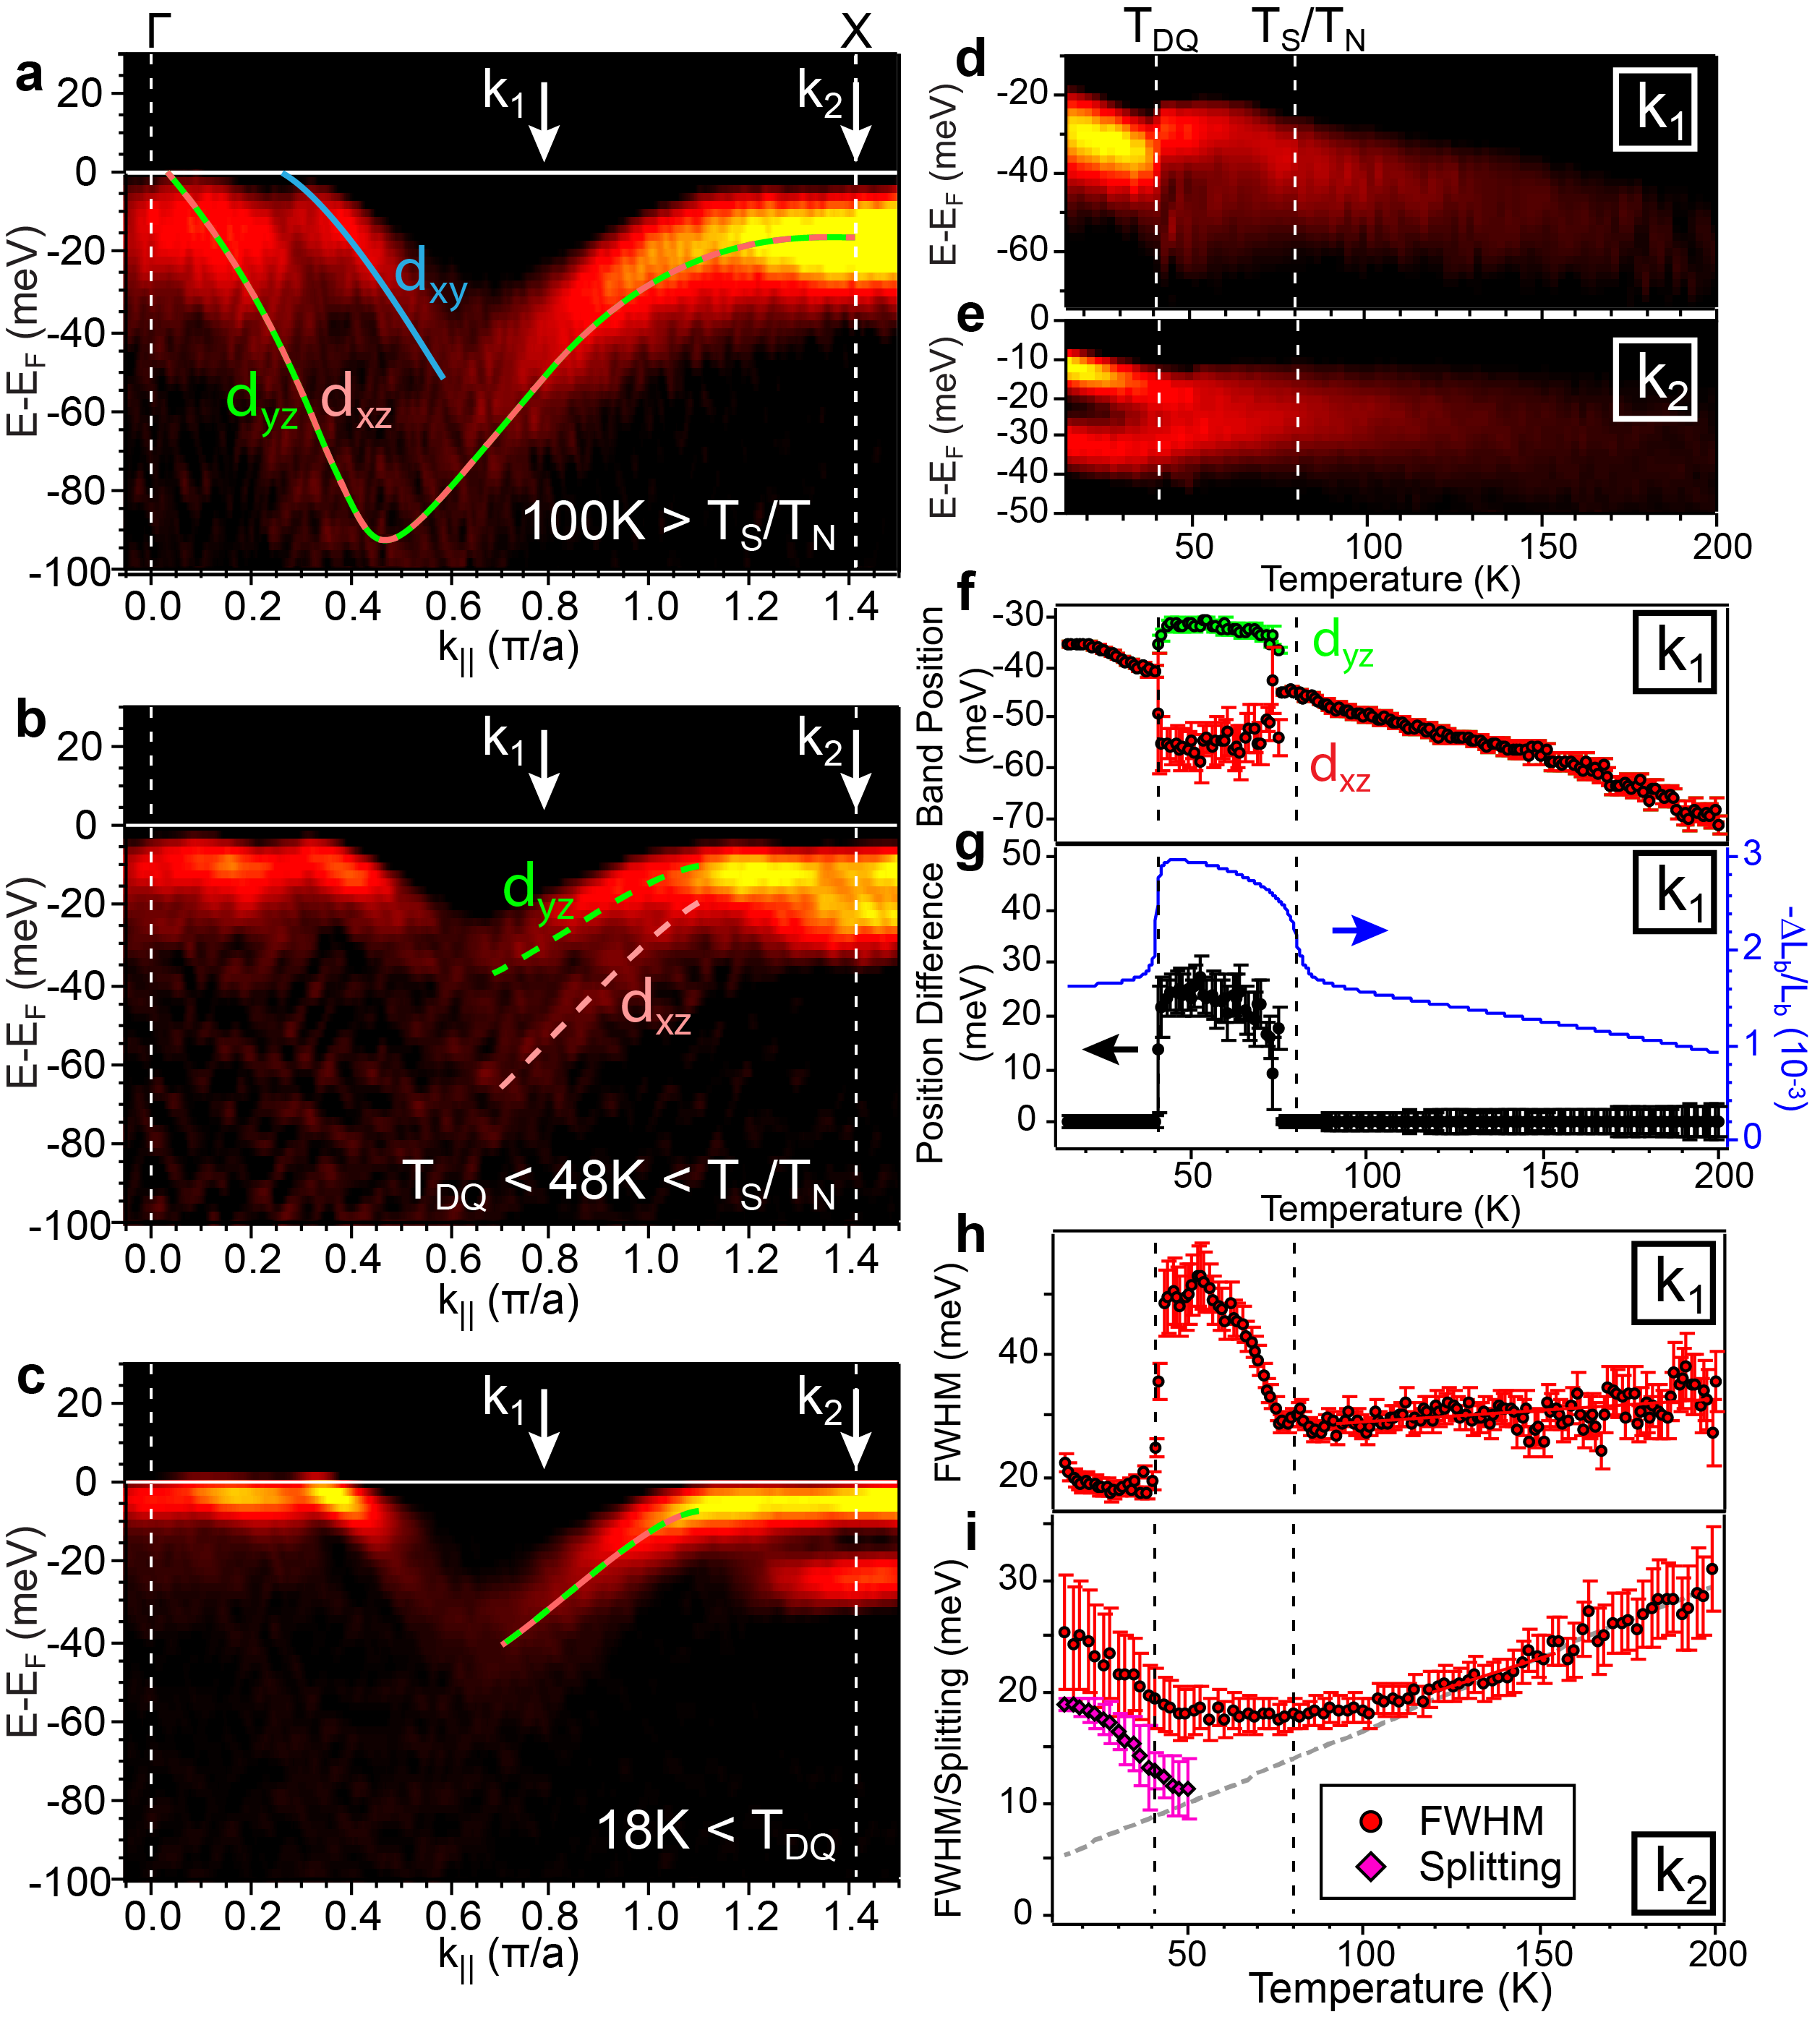
Next, we discuss the sample harboring the reentrant C4 phase, BN25. In Fig. 3 we show the bands along the direction in the three distinct temperature regimes, i) the tetragonal and paramagnetic normal state ( = ), ii) the orthorhombic CAF phase ( = ), and iii) the tetragonal double-Q magnetic phase (T ). The normal state dispersions are similar to those of BN40 (Fig. 3a). When cooled below , a splitting of the / band appears analogously to the BN18 sample indicative of the orbital anisotropy that appears in the nematic phase (Fig. 3b). When the reentrant C4 phase is entered (Fig. 3c), this splitting disappears, reflecting the restored C4 rotational symmetry. From a fine temperature-dependent measurement at a momentum between and X as we have done for BN18, , (Fig. 3d), we see clearly a single feature splitting into two near and sharply merging back into one at in a strongly first-order manner, reminiscent of the behavior of structural Bragg peaks measured by powder neutron diffraction Avci et al. (2014). As a visualization of the orbital anisotropy order parameter, we fit the band positions as a function of temperature, fitting one peak for the C4 phases and two peaks for the C2 phase (Fig. 3f). The extracted behavior of the splitting size agrees well with the behavior of the lattice distortion measured by dilatometry (Fig. 3g). While the number of peaks used in this fitting method is based on the number of bands expected in accordance with the crystal symmetry in different temperature regimes, another unbiased way to determine where the phase transitions occur is to plot the full width at half maximum (FWHM) of a single peak fit for all temperatures C4A . Indeed, an anomalous broadening of this fitted FWHM (Fig. 3h) is observed precisely between and , in good agreement with both the lattice distortion and orbital anisotropy extracted from the band splitting.
Having demonstrated that the electronic structure of BN25 follows the onset and disappearance of the nematic order through the reentrant C4 phase, we now point to an unexpected observation. In contrast to the non-monotonic temperature-dependence of the band splitting magnitude at , a simultaneous measurement at the X point, , reveals a strikingly distinct behavior—a single feature monotonically splitting into two with decreasing temperature (Fig. 3e). At first sight, one might also ascribe this splitting to orbital anisotropy onsetting at . However, two considerations disprove this conclusion. First, the splitting at is largest in the reentrant C4 phase, where the electronic structure respects restored C4 rotational symmetry. Second, the evolution through (Fig. 3e) is continuous, in contrast to the strongly first order transition at (Fig. 3d), suggesting a different mechanism than the one responsible for the splitting at . Hence, the splitting at cannot simply be due to the same orbital anisotropy that generates the splitting at .
To extract the onset temperature of this splitting, we again exploit the single-peak fitting procedure used for . The fitted FWHM as a function of temperature at (Fig. 3i) shows an initial down slope that flattens and eventually upturns. From the control sample of BN40 where no orders exist above , we see that the fitted FWHM at X narrows in a linear fashion with lowering temperature C4A . Hence, in comparison, while the broadening significantly takes off around = 40.5K, the flattening at more elevated temperatures suggests a slow emergence of the splitting at X above , which is also visible in the temperature-dependence in Fig. 3e, as well as the clear band splitting at X in the 48K data taken above (Fig. 3b). For the low temperature regime, the band splitting size can be reliably extracted from a two-peak fit (magenta in Fig. 3i), showing a rapid decrease upon raising the temperature approaching , and a non-zero presence at least 10K above this transition.
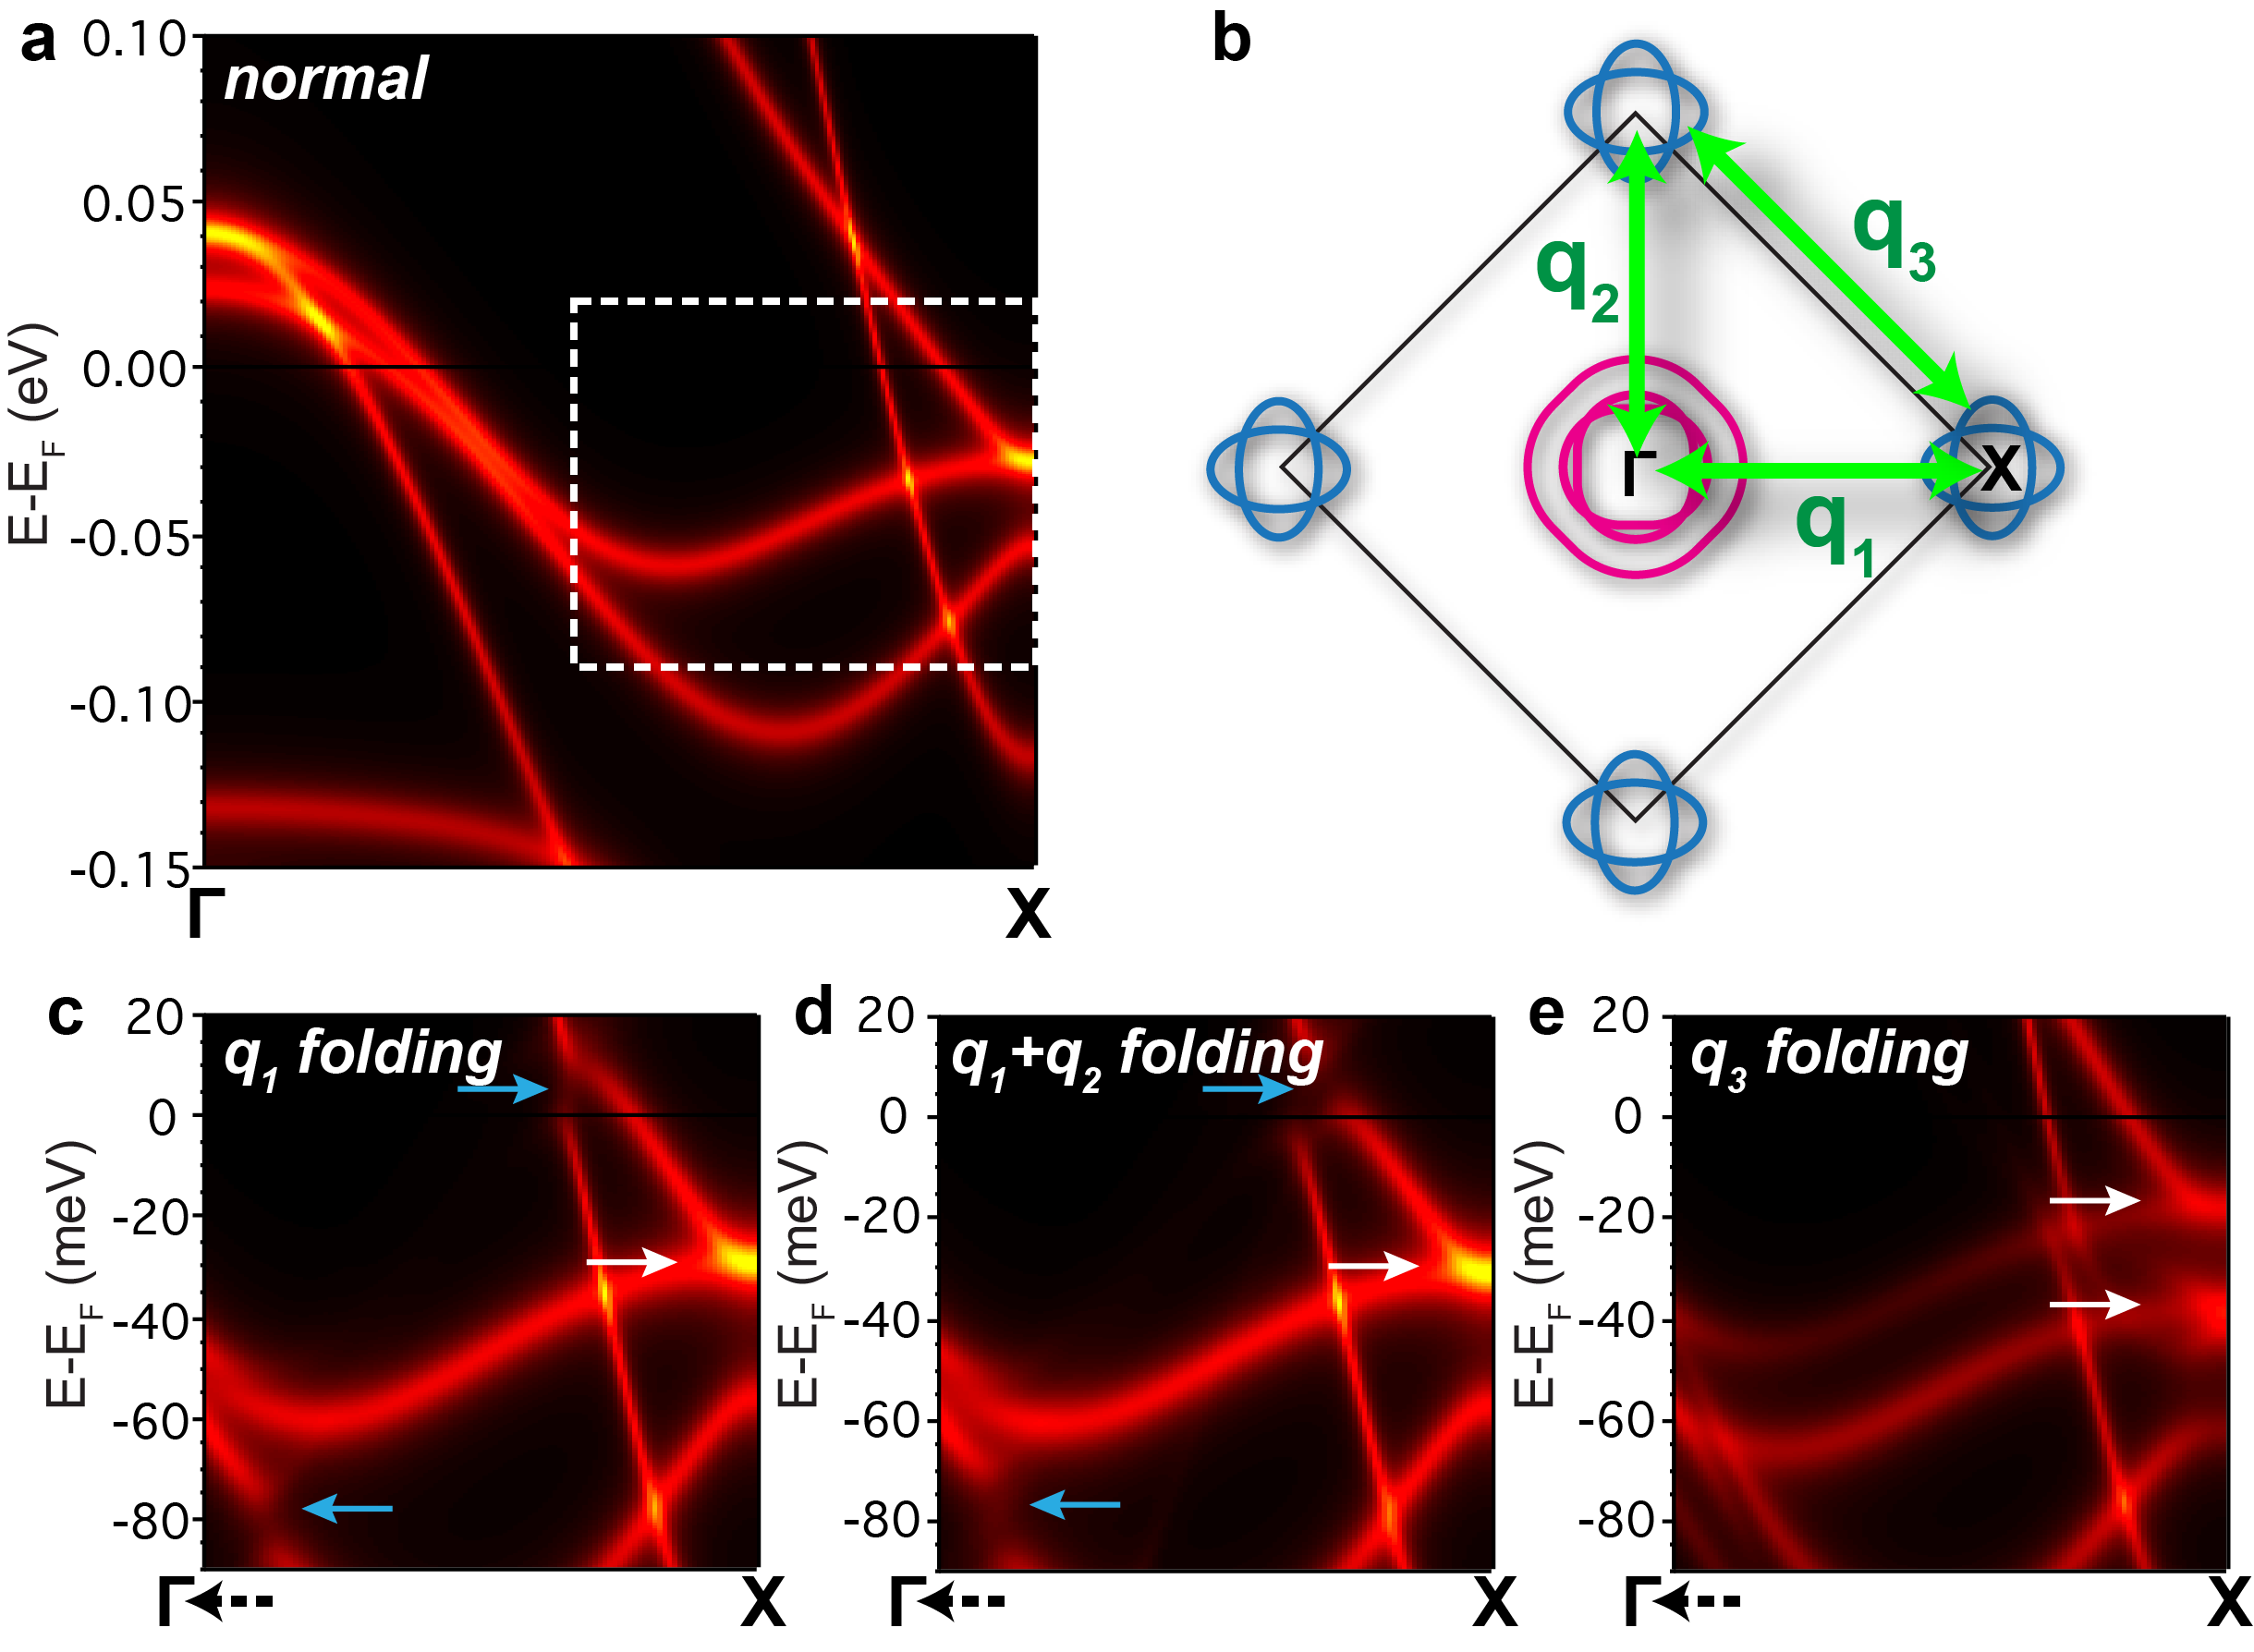
From the bands measured across the X point in the C4 phase (Fig. 3c), we see that the splitting at X results from the emergence of an additional band separated by 20meV from the original band. Since we have excluded its origin from being due to nematicity, we now explore whether it could be a result of band folding due to known magnetic orders in the system by performing a series of simulations incorporating the different magnetic orders into a three-dimensional tight binding model of the BaFe2As2 normal state band structure calculated via DFT Graser et al. (2010) (Fig. 4). We note that a more rigorous self-consistent calculation is needed to assess fully the effects of the intertwined orders in these materials, but we exploit this exercise to understand qualitatively the essential effects of the distinct electronic orders in these materials. We focus on the region near the X point (white box in Fig. 4a). First, for both the single-Q = (Fig. 4c) and double-Q + = + (Fig. 4d) orders, the only kind of additional bands that can appear at X are bands that are folded from the point Yi et al. (2012); Zhang et al. (2012); Yi et al. (2014). Since all the hole band tops at are above and there are no bands at the energy where this new feature is observed, it cannot be a result of the folding via these known magnetic orders alone. Therefore, we have excluded all the known electronic orders in this system from being the possible origin of this electronic reconstruction.
In contrast, to produce the band doubling effect at the X point as observed, one possibility is band folding associated with a checkerboard order with = (Fig. 4e), which indeed produces a band splitting at the X point. However, we note that a simple order of this q alone also cannot fully describe the data, where the intensity for the lower band of the doublet is only observable for a finite range of momenta around X, the cause of which cannot be captured in this simple simulation exercise. As this phase exists in the presence of the DQMO, a fully self-consistent calculation taking into consideration the combined effects of these intertwined orders may help bridge the precise comparison to the experimental observation. To understand the origin of this new order, we note that from neutron diffraction measured in the reentrant C4 phase, no new magnetic peak has been found at = Waßer et al. (2015). Hence the order giving rise to this folding vector is unlikely to be magnetic in origin. We offer, instead, a different possible explanation of the splitting. Theoretical studies have suggested that a checkerboard charge order (CO) where the Fe sublattice with zero moment has different charge density than that of the antiferromagnetic sublattice would be compatible with the symmetry of the DQMO Lorenzana et al. (2008); Fernandes et al. (2016); Gastiasoro and Andersen (2015). Such a CO has a q-vector that is the sum of the two q-vectors of the DQMO, and could qualitatively and partially reproduce the type of band splitting we have observed. If this is indeed the CO, this result is reminiscent of the induced CO under a magnetic field observed in FexCo1-xTiO3 Harris et al. (1997). Observations by other probes in the reentrant C4 phase are also consistent with our results, including a phonon back-folding Mallett et al. (2015), as well as an electronic gap opening observed by Raman scattering with a similar characteristic energy scale as our observed band splitting Yue et al. (2017).
Finally, a comparison between the three doping levels shows that the band splitting at X suggestive of the checkerboard order only occurs for BN25 (Fig. 2). Hence, the combined temperature and doping dependences suggest that the new order likely strongly couples to the DQMO. Theoretically, it is anticipated that an Ising-like checkerboard CO accompanies the DQMO Lorenzana et al. (2008); Fernandes et al. (2016); Gastiasoro and Andersen (2015) analogously as the Ising-nematic order to the single-Q CAF order, where the CO could either emerge simultaneously with the DQMO in a first order transition, or precede the formation of the DQMO Fang et al. (2008); Xu et al. (2008); Dai et al. (2009); Chandra et al. (1990); Yu et al. . In the latter case, a Ginzburg-Landau analysis suggests that, when the DQMO develops upon lowering the temperature from a C2 magnetic phase, the magnetic transition at is first order, while the onset of the CO in the background of the Ising-nematic order could be continuous C4A . From our measurements, while we observe evidence of band splitting already emerging above (Fig. 3b), the fast time-scale of the photoemission process does not allow us to preclude the possibility of this arising from fluctuation effects since the order parameter is seen to develop significantly below . However, our measurements do reveal strong order susceptibilities in this regime. Interestingly, strong nematic susceptibility is found inside the reentrant C4 phase by both measurements of the Young’s modulus Wang et al. (2018) as well as a pair distribution function measurement that observed local orthorhombicity deep in the reentrant C4 phase Frandsen et al. (2017), suggesting the strong first-order nature of the transition as well as potential strong interaction of the nematic and charge fluctuations in this regime.
The finding of this emergent order and its strong coupling to the DQMO in underdoped FeSCs unveils another parallel with the intertwined electronic “stripe” order appearing at 1/8 doping in the La2-xBaxCuO4 cuprate system where the CO couples strongly to the spin order Keimer et al. (2015); Tranquada et al. (1995). Interestingly, in both the cuprate case Keimer et al. (2015) and the Ba1-xNaxFe2As2 case Wang et al. (2016) reported here, the dome develops a suppression where the intertwined orders appear, suggesting a non-trivial interaction of these orders with superconductivity. Overall, our observation of the effects of the putative checkerboard electronic order in Ba1-xNaxFe2As2 reveals that high temperature superconductivity in the FeSCs emerges in an elaborately intertwined regime where magnetism could potentially couple both to the orbital degrees of freedom and charge degrees of freedom, opening up exciting perspectives for theoretical investigations of the mechanism for high temperature superconductivity. Other measurements of the charge order, both direct and indirect, including especially by resonant x-ray scattering would help elucidate the nature of the couplings between the different orders and their fluctuations. We hope our report of the emergent order in the reentrant C4 phase could motivate further theoretical efforts in understanding the intricate electronic phase interactions in these rich material systems.
Acknowledgements.
We thank Maria Gastiasoro, Keith Taddei, Yan Zhang, Yuan Li, and Fa Wang for fruitful discussions. Work at University of California, Berkeley and Lawrence Berkeley National Laboratory was funded by the U.S. Department of Energy, Office of Science, Office of Basic Energy Sciences, Materials Sciences and Engineering Division under Contract No. DE-AC02-05-CH11231 within the Quantum Materials Program (KC2202) and the Office of Basic Energy Sciences, U.S. DOE, Grant No. DE-AC03-76SF008. ARPES experiments were performed at the Stanford Synchrotron Radiation Lightsource and the Advanced Light Source, which are both operated by the Office of Basic Energy Sciences, U.S. DOE. Work at Renmin University is supported by the National Science Foundation of China Grant numbers 11374361 and 11674392 and Ministry of Science and Technology of China, National Program on Key Research Project Grant number 2016YFA0300504. Work at Rice University is supported by the U.S. Department of Energy, Office of Science, Basic Energy Sciences, under Award No. DE-SC0018197, and by the Robert A. Welch Foundation Grant No. C-1411. M.Y. acknowledges the L’Oréal For Women in Science Fellowship for support. LW acknowledges the support from DFG funding No. WA4313/1-1. Q.S. acknowledges the hospitality of University of California at Berkeley.References
- Keimer et al. (2015) B. Keimer, S. A. Kivelson, M. R. Norman, S. Uchida, and J. Zaanen, Nature 518, 179 (2015).
- Dai (2015) P. Dai, Rev. Mod. Phys. 87, 855 (2015).
- Chu et al. (2010) J.-H. Chu, J. G. Analytis, K. De Greve, P. L. McMahon, Z. Islam, Y. Yamamoto, and I. R. Fisher, Science 329, 824 (2010).
- Tanatar et al. (2010) M. A. Tanatar, E. C. Blomberg, A. Kreyssig, M. G. Kim, N. Ni, A. Thaler, S. L. Bud’ko, P. C. Canfield, A. I. Goldman, I. I. Mazin, and R. Prozorov, Phys. Rev. B 81, 184508 (2010).
- Yi et al. (2011) M. Yi, D. Lu, J.-H. Chu, J. G. Analytis, A. P. Sorini, A. F. Kemper, B. Moritz, S.-K. Mo, R. G. Moore, M. Hashimoto, W.-S. Lee, Z. Hussain, T. P. Devereaux, I. R. Fisher, and Z.-X. Shen, Proc. Natl. Acad. Sci. 108, 6878 (2011).
- Avci et al. (2014) S. Avci, O. Chmaissem, J. M. Allred, S. Rosenkranz, I. Eremin, A. V. Chubukov, D. E. Bugaris, D. Y. Chung, M. G. Kanatzidis, J.-P. Castellan, J. A. Schlueter, H. Claus, D. D. Khalyavin, P. Manuel, A. Daoud-Aladine, and R. Osborn, Nat. Comm. 5, 3845 (2014).
- Allred et al. (2016) J. M. Allred, K. M. Taddei, D. E. Bugaris, M. J. Krogstad, S. H. Lapidus, D. Y. Chung, H. Claus, M. G. Kanatzidis, D. E. Brown, J. Kang, R. M. Fernandes, I. Eremin, S. Rosenkranz, O. Chmaissem, and R. Osborn, Nat. Phys. 12, 493 (2016).
- Waßer et al. (2015) F. Waßer, A. Schneidewind, Y. Sidis, S. Wurmehl, S. Aswartham, B. Büchner, and M. Braden, Phys. Rev. B 91, 060505 (R) (2015).
- Wang et al. (2016) L. Wang, F. Hardy, A. E. Böhmer, T. Wolf, P. Schweiss, and C. Meingast, Phys. Rev. B 93, 014514 (2016).
- Böhmer et al. (2015) A. E. Böhmer, F. Hardy, L. Wang, T. Wolf, P. Schweiss, and C. Meingast, Nat. Comm. 6, 7911 (2015).
- Taddei et al. (2017) K. M. Taddei, J. M. Allred, D. E. Bugaris, S. H. Lapidus, D. Y. C. M. J. Krogstad, H. Claus, M. G. Kanatzidis, R. Osborn, S. Rosenkranz, and O. Chmaissem, Phys. Rev. B 95, 064508 (2017).
- (12) “See Supplemental Materials [http://link…] for ARPES analysis of temperature dependence and evidence for magnetic folding, Fermi surface maps, details on tight-binding model, and theoretical analysis of phase transitions, which include Refs. [35-37]” .
- Böhmer and Meingast (2016) A. E. Böhmer and C. Meingast, Comptes Rendus Physique 17, 90 (2016).
- Graser et al. (2010) S. Graser, a. F. Kemper, T. a. Maier, H.-P. Cheng, P. J. Hirschfeld, and D. J. Scalapino, Phys. Rev. B 81, 214503 (2010).
- Zhao et al. (2008) L. Zhao, H.-Y. Liu, W.-T. Zhang, J.-Q. M. X.-W. Jia, G.-D. Liu, X.-L. Dong, G.-F. Chen, J.-L. Luo, N.-L. Wang, W. Lu, G.-L. Wang, Y. Zhou, Y. Zhu, X.-Y. Wang, Z.-Y. Xu, C.-T. Chen, and X.-J. Zhou, Chin. Phys. Lett. 25, 4402 (2008).
- Zhang et al. (2010) Y. Zhang, L. X. Yang, F. Chen, B. Zhou, X. F. Wang, X. H. Chen, M. Arita, K. Shimada, H. Namatame, M. Taniguchi, J. P. Hu, B. P. Xie, and D. L. Feng, Phys. Rev. Lett. 105, 117003 (2010).
- Xu et al. (2011) Y.-M. Xu, Y.-B. Huang, X.-Y. Cui, E. Razzoli, M. Radovic, M. Shi, G.-F. Chen, P. Zheng, N.-L. Wang, C.-L. Zhang, P.-C. Dai, J.-P. Hu, Z. Wang, and H. Ding, Nat. Phys. 7, 198 (2011).
- Yi et al. (2012) M. Yi, D. H. Lu, R. G. Moore, K. Kihou, C.-H. Lee, a. Iyo, H. Eisaki, T. Yoshida, a. Fujimori, and Z.-X. Shen, New J. of Phys. 14, 073019 (2012).
- Zhang et al. (2012) Y. Zhang, C. He, Z. R. Ye, J. Jiang, F. Chen, M. Xu, Q. Q. Ge, B. P. Xie, J. Wei, M. Aeschlimann, X. Y. Cui, M. Shi, J. P. Hu, and D. L. Feng, Phys. Rev. B 85, 085121 (2012).
- Yi et al. (2014) M. Yi, Y. Zhang, Z.-K. Liu, X. Ding, J.-H. Chu, a. F. Kemper, N. Plonka, B. Moritz, M. Hashimoto, S.-K. Mo, Z. Hussain, T. P. Devereaux, I. R. Fisher, H. H. Wen, Z.-X. Shen, and D. H. Lu, Nat. Comm. 5, 3711 (2014).
- Lorenzana et al. (2008) J. Lorenzana, G. Seibold, C. Ortix, and M. Grilli, Phys. Rev. Lett. 101, 186402 (2008).
- Fernandes et al. (2016) R. M. Fernandes, S. A. Kivelson, and E. Berg, Phys. Rev. B 93, 014511 (2016).
- Gastiasoro and Andersen (2015) M. N. Gastiasoro and B. M. Andersen, Phys. Rev. B 92, 140506 (R) (2015).
- Harris et al. (1997) Q. J. Harris, Q. Feng, Y. S. Lee, Y. J. Kim, R. J. Birgeneau, and A. Ito, Z. Phys. B 102, 163 (1997).
- Mallett et al. (2015) B. Mallett, P. Marsik, M. Yazdi-Rizi, T. Wolf, A. Böhmer, F. Hardy, C. Meingast, D. Munzar, and C. Bernhard, Phys. Rev. Lett. 115, 027003 (2015).
- Yue et al. (2017) L. Yue, X. Ren, T. Han, J. Guo, Z. Wu, Y. Zhang, and Y. Li, Phys. Rev. B 96, 180505 (2017).
- Fang et al. (2008) C. Fang, H. Yao, W.-F. Tsai, J. Hu, and S. A. Kivelson, Phys. Rev. B 77, 224509 (2008).
- Xu et al. (2008) C. Xu, M. Müller, and S. Sachdev, Phys. Rev. B 78, 020501 (2008).
- Dai et al. (2009) J. Dai, Q. Si, J.-X. Zhu, and E. Abrahams, Proc. Natl. Acad. Sci. 106, 4118 (2009), http://www.pnas.org/content/106/11/4118.full.pdf+html .
- Chandra et al. (1990) P. Chandra, P. Coleman, and A. I. Larkin, Phys. Rev. Lett. 64, 88 (1990).
- (31) R. Yu, M. Yi, B. A. Frandsen, R. J. Birgeneau, and Q. Si, “Emergent phases in iron pnictides: Double-Q antiferromagnetism, charge order and enhanced nematic correlations,” arXiv:1706.07087.
- Wang et al. (2018) L. Wang, M. He, F. Hardy, P. Adelmann, T. Wolf, M. Merz, P. Schweiss, and C. Meingast, Phys. Rev. B 97, 224518 (2018).
- Frandsen et al. (2017) B. A. Frandsen, K. M. Taddei, M. Yi, A. Frano, Z. Guguchia, R. Yu, Q. Si, D. E. Bugaris, R. Stadel, R. Osborn, S. Rosenkranz, O. Chmaissem, and R. J. Birgeneau, Phys. Rev. Lett. 119, 187001 (2017).
- Tranquada et al. (1995) J. M. Tranquada, B. J. Sternlieb, J. D. Axe, Y. Nakamura, and S. Uchida, Nature 375, 561 (1995).
- Abraham et al. (2011) E. Abraham, and Q. Si, J. Phys.: Condens. Matter 23, 223201 (2011) .
- Lu et al. (2014) X. Lu, J. T. Park, R. Zhang, H. Luo, A. Nevidomskyy, Q. Si, and P. Dai, Science 345, 657 (2014) .
- Giovannetti et al. (2011) G. Giovannetti, C. Ortix, M. Marsman, J. van den Brink, and J. Lorenzana, Nat. Comm. 2, 398 (2011) .