The Close AGN Reference Survey (CARS):
SOFIA detects spatially-resolved [C II] emission in the luminous AGN HE0433-1028111Based on observations made with the NASA/DLR Stratospheric Observatory for Infrared Astronomy (SOFIA) and on observations collected at the European Organisation for Astronomical Research in the Southern Hemisphere under ESO programme 094.B-0354(A).
Abstract
We report spatially-resolved [C II] observations of HE 0433–1028, with FIFI-LS onboard the airborne observatory SOFIA. We compare the spatially-resolved star formation tracers [C II], as provided by our SOFIA observations, and H from MUSE optical integral-field spectroscopy. We find that the [C II] emission is mainly matching the extended star formation as traced by the extinction-corrected H line emission but some additional flux is present. While a larger sample is needed to statistically confirm our findings and investigate possible dependencies on AGN luminosity and star formation rate, our study underlines the necessity of collecting a spatially-resolved optical-FIR dataset for nearby AGNs, and shows that it is technically feasible to collect such datasets with FIFI-LS onboard SOFIA.
1 Introduction
The [C II] fine-structure line of singly ionized carbon at is one of the brightest emission lines in the far-infrared and a main cooling line in the interstellar medium and photon-dominated regions (PDR, Hollenbach & Tielens, 1999). Many studies show a correlation between the [C II] line and the star formation rate (SFR) in nearby galaxies (e.g. Stacey et al., 1991; Boselli et al., 2002; De Looze et al., 2014; Herrera-Camus et al., 2015). While the optical hydrogen recombination line H, another popular star formation rate tracer, is shifted out of the near-infrared at , the [C II] line shifts to the sub-mm at higher redshift () where it can be observed with large interferometers like ALMA or NOEMA at unprecedented sensitivity and resolution, therefore becoming a powerful diagnostic for star formation in high-redshift galaxies (e.g. Stacey et al., 2010).
Although the correlation between the [C II] line and the SFR is relatively tight, some scatter exists ( Herrera-Camus et al., 2015) and indicates a mix of different excitation mechanisms in individual galaxies. Of particular interest is which influence the active galactic nucleus (AGN) has on the [C II] luminosity: Luminous AGNs have a strong radiation field that is in some cases able to dominate the ionization of the ISM even out to kiloparsec scales (e.g. Scharwächter et al., 2011; Husemann et al., 2013) and could therefore contribute to the excitation of C+ as well. On the other hand, very luminous infrared sources seem to have relatively weaker [C II] luminosities (“C II deficit”). It is still an open question what is the main driver of this C II deficit (e.g. Smith et al., 2017). Possible explanations for a C II deficit to occur close to the AGN include dust heating by the AGN (e.g. Luhman et al., 2003; Graciá-Carpio et al., 2011) or carbon overionization due to X-rays (e.g. Langer & Pineda, 2015; Herrera-Camus et al., 2018). A reliable baseline needs to be established at low redshift. While some nearby low-luminosity AGN are included in e.g. the KINGFISH survey (Herrera-Camus et al., 2015; Smith et al., 2017), the influence of AGN, on the calibration of the [C II]-SFR relation needs to be investigated.
Spatially and spectrally resolved analysis is a powerful way to distinguish between extended and central point source emission to estimate the impact of the galactic nucleus. However, this kind of study has not yet been attempted due to the lack of high-spatial and -spectral resolution observations of reference star formation indicators. The Close AGN Reference Survey (CARS, www.cars-survey.org, Husemann et al., 2017) comprises a spatially-resolved multiwavelength dataset of nearby () luminous AGNs that are ideal as a bridge between the well-studied local AGN population and more distant quasi-stellar objects (QSOs, Bertram et al., 2007; Busch et al., 2016). It therefore provides a reference data set for high-redshift galaxies and also offers a range of AGN luminosities () that allows for a statistical analysis of possible deviations from the [C II]-SFR relation as a function of the AGN luminosity.
In this letter, we report the first spatially-resolved detection of [C II] line emission in a nearby luminous AGN with the airborne Stratospheric Observatory For Infrared Astronomy (SOFIA, Young et al., 2012). We test the [C II]-SFR relation in the presence of a bright AGN by comparing spatially-resolved [C II] emission with respect to H as a reference SFR indicator. HE 0433–1028 is a strongly barred spiral galaxy at a redshift of and an AGN luminosity of . Adopting a cosmology with , and , the redshift corresponds to a luminosity distance of and a scale of .
2 Observations
2.1 FIFI-LS far-infrared 3D spectroscopy
The Field-Imaging Far-Infrared Line Spectrometer (FIFI-LS, Klein et al., 2010; Fischer et al., 2018) onboard the flying telescope SOFIA is an integral-field spectrograph working at far-infrared wavelengths. The AGN HE 0433-1028 was observed on 2016 March 1 at a pressure altitude of feet, with an on-source total exposure time of . We used the red channel centered on the [C II] line (redshifted with ), providing a spectral coverage from to . In this mode, the array consists of 55 pixels with a pixel size of each. The spectral resolution is or at this wavelength.
Chop-subtraction, flat correction, telluric correction, flux calibration and spectral rebinning is performed by the instrument pipeline. Before spatial rebinning, we calculate and subtract the remaining background in each exposure and spatial position by calculating a weighted average of the spectral region around the expected emission line. In this process we also calculate the standard deviation. In the next step, we replace NaN-values in the spectrum with white noise with the previously calculated standard deviation. This ensures a constant noise over the whole spectral range. The spatial alignment and rebinning to a pixel size of is done with a Drizzle algorithm (Fruchter & Hook, 2002).
While coadding the drizzled cubes, we realized that not all cubes have the same quality. We therefore decided to observe how the S/N of the line detection behaves while adding more cubes. It became apparent that only during the second half of the observation, the increase of S/N with cumulative exposure time followed the expected relation . During the first half of the observations, the S/N stayed constant over time on a low level. We therefore concluded that the cubes observed during the first half were not useful due to technical or weather influence (higher line-of-sight water vapour forecasted at the beginning of flight leg) and only coadded the second half. This left us with 25 accepted and 25 rejected frames, resulting in an effective exposure time of about .
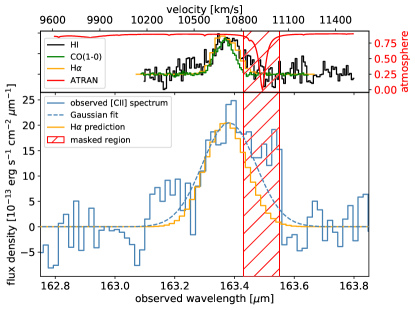
Figure 1 (bottom panel, blue line) shows the resulting FIFI-LS spectrum integrated in the central aperture with radius , which roughly corresponds to the full width at half maximum (FWHM) of the point-spread function (PSF) of the SOFIA telescope. In orange, we show the scaled H line (see below), integrated over the same aperture. In the top panel, we show the line profiles of H I (Nançay radio telescope, Davoust & Contini, 2004), CO(1-0) (ALMA, T. Davis, priv. comm.) and H, and overlay in red a synthetic spectrum of the atmospheric transmission created with Atran222https://atran.sofia.usra.edu/ (Lord, 1992). We see that there is a strong absorption feature at but we do not expect any emission in neutral and ionized gas at the velocity of this feature. However, this feature might cause strong residuals in the [C II] emission. We therefore decide to mask this spectral region (red stripes in Fig. 1) before fitting a Gaussian function that we show as a dashed line in the bottom panel of Fig. 1. The fitted [C II] line has a signal-to-noise of . The line width is FWHM ( after correcting for instrumental resolution) and the peak velocity of the [C II] emission coincides with that of the H line within . This demonstrates FIFI-LS ability to detect extragalactic sources, and extends SOFIA’s scope from sources in the immediate Galactic neighborhood to nearby galaxies and AGNs.
2.2 MUSE optical 3D spectroscopy
Optical integral-field spectroscopy with the Multi-Unit Spectroscopic Explorer (MUSE; Bacon et al., 2010) is available from CARS. HE 0433-1028 was observed in December 2014 with a total on-source integration time of 600 seconds. The reduction with the standard ESO pipeline Weilbacher et al. (2012) results in a data cube with a large field-of-view (FOV) of which matches the FIFI-LS FOV. The spatial scaling is per spaxel (spatial pixel) and the wavelength coverage is Å with a spectral resolution of () at the wavelength of the H line.
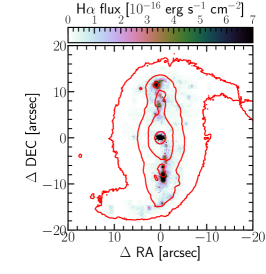
The tool QDeblend3D makes use of the fact that HE 0433-1028 is an unobscured AGN and the broad-line region appears point-like. By combining spatial and spectral information, it is possible to deblend central point-like and extended emission in an iterative process (Husemann et al., 2014). In a next step, the stellar continuum was subtracted and optical emission lines were fitted with Gaussian functions across the cube. Using the Balmer decrement H/H, extinction correction was then performed following the extinction law of Cardelli et al. (1989). Figure 2 (left) shows a map of the extinction-corrected H extended emission with the -band continuum emission overlayed as contours.
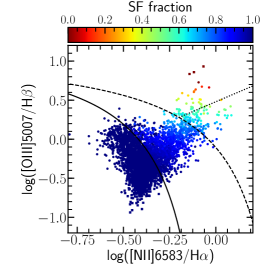
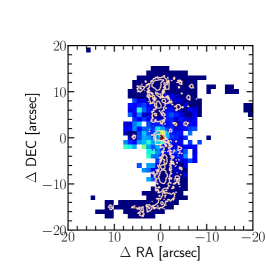
Afterwards we analyze the excitation mechanisms of the ionized gas across the galaxy. We show the BPT diagram (Baldwin et al., 1981), which uses the ratios of nearby optical emission lines to distinguish the ionization mechanism of nebular gas, in Fig. 2, middle panel. The color-coding shows the AGN fraction for each pixel. The right panel shows the AGN fractions in the map. The H flux in each pixel is then lowered by the respective AGN fraction. This leaves us with an AGN subtracted H map which is representative of the extended star formation.
3 Modeling the [C II] emission
With the available FIFI-LS data we can spatially distinguish between the central region that might be influenced by the AGN and the star formation along the bar. In Fig. 3, fourth panel, we show the flux distribution of the [C II] line, which we derive by summing up the spectra on a spaxel-by-spaxel basis between and . The latter value was chosen to avoid the atmospheric absorption feature (see Fig. 1). We correct for missing flux in this wing by applying a correction factor of which was derived from the integrated spectrum by comparing the total flux in the Gaussian with the flux derived when summing only in the mentioned interval. The resulting map resembles the elongated structure of the star forming regions in the bar, as visible in the H map in Fig. 2 (left), which has a length of about (). When considering only pixels with S/N, we find an extent of almost . However, the length is affected by beam smearing. To further further quantify this finding, we aim at distinguishing between extended emission and unresolved point-source contribution. However, given the small extent of the galaxy () compared to the spatial resolution of SOFIA (), a direct decomposition seems inadvisable. Instead, we use a forward modelling approach with the MUSE H map as a high spatial-resolution prior, which is also not affected by beam-smearing. Our model consists of two components: extended emission and an unresolved point source.
For the extended emission, HaMap, we use the extinction-corrected H flux map (see Fig. 2) as a prior for the expected [C II] assuming that both trace the gas excitation from star formation. We convolve the H map with the spatial resolution of SOFIA’s 2.7m-telescope (PSF approximated with a Gaussian with FWHM at ) and apply a spatial rebinning to pixel grid as implied by the SOFIA data with respect to the target coordinates. We stress that the AGN-host galaxy deblending step as described in Sect. 2.2 is essential for using the H maps as a robust star formation tracer.
The spatially unresolved component, psfMap, aims to account for a possible point source contribution to the [C II] flux. Here we assume a simple 2D Gaussian model for the point-spread function of the SOFIA telescope with at the observed [C II] wavelength. In Fig. 3, first and second panel, we show maps of the two components, both scaled to the observed map (fourth panel) by minimizing the least-square error between observation and model. It becomes apparent that the emission is extended and a point source is not a good representation. The scaling factors, when using only single components, are for the extended emission and for the point source model.
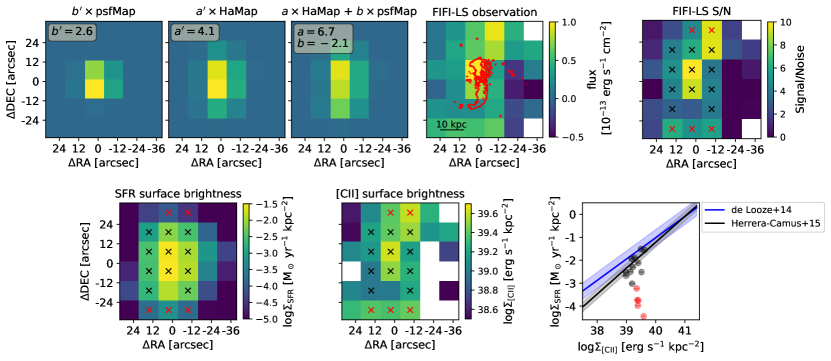
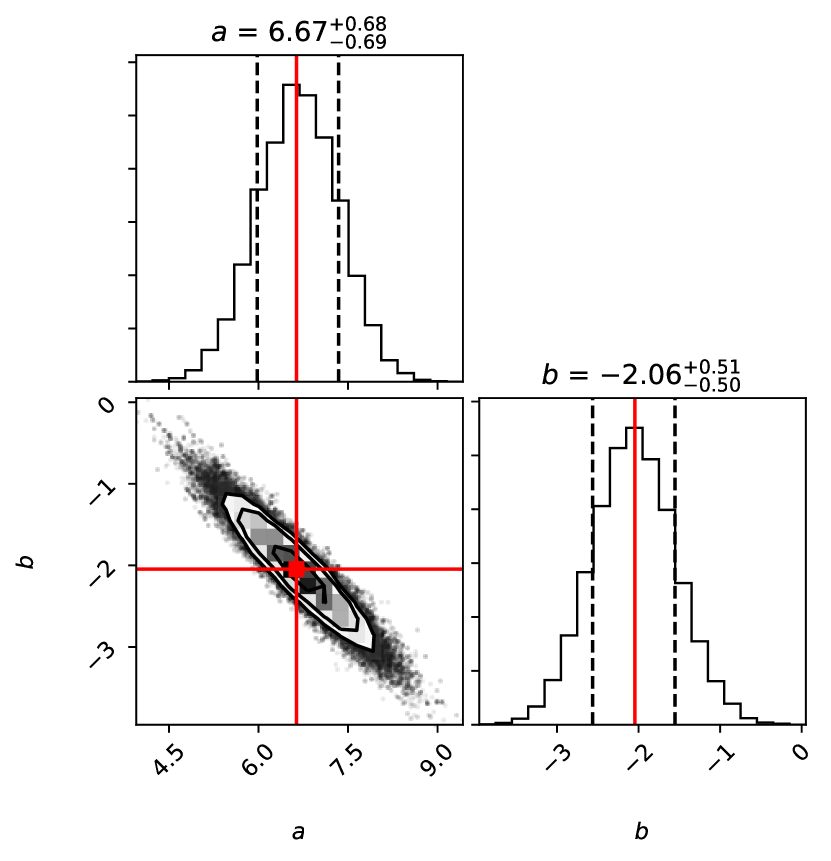
The full model is given by a linear combination . Since we normalize both reference maps to a total flux of 1, the scaling factors and denote the flux of the extended [C II] emission and the point-source emission respectively, in units of . To find the best-fit parameters of this model, including their 1 uncertainties, we use the Markov-Chain Monte-Carlo code Emcee (Foreman-Mackey et al., 2013). Figure 4 is a visualization of the explored parameter space, the resulting map is shown in Fig. 3, third panel. The best fit parameters are and , which indicates that the extended emission is the dominating component and an additional small negative point source contribution is favored by the model.
The total [C II] flux indicated by the model is , the same as the flux derived from the Gaussian fit of the integrated spectrum. Comparing with the total extinction corrected H flux of , we derive a flux ratio of . Assuming a linear relation, we connect the linear relation from Herrera-Camus et al. (2015) with the linear relation (Kennicutt & Evans, 2012) which leads to a predicted relation of , which is consistent with our result.
The modeled total [C II] flux corresponds to a [C II] luminosity of . Using the calibration of Herrera-Camus et al. (2015), who report a scatter of , we obtain a star formation rate of which agrees very well with the star formation estimate from the AGN-subtracted and dust-corrected H luminosity of (Kennicutt & Evans, 2012).
Since the magnitude of the extended emission is significantly higher than the magnitude of the point source contribution , we conclude that the extended emission is the dominating contribution to the [C II] flux. However, as also visible in the maps in Fig. 3, a point-like contribution is required. A negative point source contribution could indicate that the central [C II] emission is reduced in the presence of an AGN, for example due to overionization of the emitting gas (e.g. Langer & Pineda, 2015). Also this could hint at different star formation rates in bar and bulge, of which the latter cannot be spatially separated from an AGN component at the resolution of SOFIA.
In Fig. 3, we show a map of the model together with maps of the two components separately. These maps are directly compared to the aforementioned map of the observed emission.
In Fig. 3, bottom row, we show surface brightnesses of star formation and [C II] emission. At S/N (indicated with crosses in the maps), we detect an elongated bar-like structure with an extend of almost one arcminute. Next to the maps, we place the pixels with S/N in the relation. It becomes apparent that in the central pixels the [C II] emission follows the H emission and lies on published relations (De Looze et al., 2014; Herrera-Camus et al., 2015). Therefore, we can conclude that, within the galaxy, [C II] predominantly traces star-formation excited PDRs. In the North and South of the galaxy, however, we observe additional [C II] emission that is not following the H and CO emission. We suspect that the [C II] emission there is tracing the cold neutral medium (CNM) of which [C II] is the dominant cooling process and which can be excited by many processes including the UV background and cosmic rays (e.g. Wolfire et al., 2003). While in the centers of galaxies, PDRs are the main contributor to [C II], in the outskirts of galaxies, the CNM can contribute significantly to the [C II] emission (see e.g. in M33; Kramer et al., 2013). Consistent with this, the velocities of the emission in these regions are contained in the spectrum of H I which is the main tracer of the CNM.
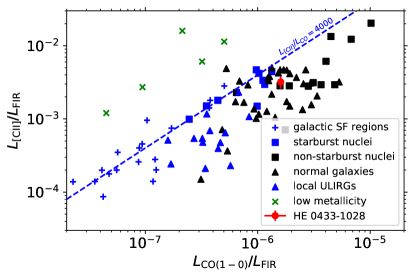
In Fig. 5, we show the position of HE0433-1028 in the diagram (Stacey et al., 2010, and references therein). The far-infrared luminosity is (derived in Moser et al., 2016) which indicates that the [C II] contributes around to the FIR luminosity. The integrated emission of the 12CO(1–0) transition, mapped with the Atacama Large Millimeter/submillimeter Array (ALMA, T. Davis, priv. comm.), has a flux of which corresponds to a luminosity of . This is consistent with previous single-dish CO-observations with the IRAM-30m telescope (Bertram et al., 2007), yielding a luminosity of the 12CO(1–0) line of which is lower since the galaxy is more extended than the IRAM-30m beam.
The line ratio between the [C II] and the 12CO(1–0) line is often used as a diagnostic of the star formation activity in galaxies. While the [C II] line scales strongly with the far-UV radiation emitted by young OB stars, the CO(1–0) stems from better shielded regions. Therefore, starburst dominated regions show higher [C II]/CO ratios. Typical ratios of starburst galaxies are of the order of and can reach up to a few in extreme cases but are by a factor of smaller in non-starburst nuclei (Stacey et al., 1991). Also, in low metallicity galaxies, and ratios than in normal galaxies are observed (e.g. Madden, 2000; Röllig et al., 2006) which are explained by larger C+ emitting regions. For HE0433-1028, we measure a line ratio of which is a typical value . A more detailed analysis of possible metallicity gradients will be pursued with spatially-resolved CO data. This underlines the necessity for multiwavelength observations with high spatial resolution.
4 Summary and conclusions
In this letter, we presented integral-field spectroscopy observations of the [C II] emission line of the nearby luminous AGN HE 0433–1028 at a redshift of . This is the first spatially resolved far-infrared observation of a nearby luminous AGN and the object with the highest redshift that has been studied with the airborne observatory SOFIA so far.
Compared to high-z QSOs, HE 0433–1028 is still close enough to resolve separate star formation regions (Busch et al., 2015). This makes sources like HE 0433–1028 ideal targets to analyze a star forming galaxy in the presence of a strong AGN and study the counterplay of star formation and AGN activity.
We can clearly resolve the elongated structure of the star forming regions along the large-scale bar. We compare the data to a model which consists of an extended emission and point source component, both based on a high-resolution AGN-subtracted H-map. The model fit suggests that the [C II] follows the extended () H emission, which is excited by star formation. An additional small negative point source component is suggested by the model. However, a dependency of the point source contribution on the AGN luminosity or other parameters has to be verified with a larger sample.
Previous studies (e.g. Sargsyan et al., 2014) already suggested that [C II] can serve as a star formation estimator also in AGNs, but only with a precision of . However, since they were comparing integrated measurements, it was not clear whether increased scatter comes from an additional component, associated with the AGN, or globally different scaling factors between [C II] and SFR. With our spatially-resolved [C II] observations and H comparison data, we see that in HE0433-1028 the extended emission of [C II] and H are statistically matching and yield scaling factors consistent with inactive galaxies, with an additional flux excess North and South of the bar. While integrated [C II]/CO line ratios indicate a metallicity typical for normal galaxies, possible metallicity variations will be analyzed in more detail with upcoming spatially-resolved optical and CO measurements.
While the sole purpose of this letter is to demonstrate the feasibility of spatially resolved analysis of [C II] emission in nearby luminous AGNs, with reasonable observing time effort, the upcoming observations of a larger set of in total five QSOs with different AGN luminosities from the CARS survey will allow us to probe the [C II]-SFR connection as a function of AGN luminosity and SFR.
References
- Bacon et al. (2010) Bacon, R., Accardo, M., Adjali, L., et al. 2010, in Proc. SPIE, Vol. 7735, Ground-based and Airborne Instrumentation for Astronomy III, 773508
- Baldwin et al. (1981) Baldwin, J. A., Phillips, M. M., & Terlevich, R. 1981, PASP, 93, 5
- Bertram et al. (2007) Bertram, T., Eckart, A., Fischer, S., et al. 2007, A&A, 470, 571
- Boselli et al. (2002) Boselli, A., Gavazzi, G., Lequeux, J., & Pierini, D. 2002, A&A, 385, 454
- Busch et al. (2015) Busch, G., Smajić, S., Scharwächter, J., et al. 2015, A&A, 575, A128
- Busch et al. (2016) Busch, G., Fazeli, N., Eckart, A., et al. 2016, A&A, 587, A138
- Cardelli et al. (1989) Cardelli, J. A., Clayton, G. C., & Mathis, J. S. 1989, ApJ, 345, 245
- Cid Fernandes et al. (2010) Cid Fernandes, R., Stasińska, G., Schlickmann, M. S., et al. 2010, MNRAS, 403, 1036
- Cormier et al. (2015) Cormier, D., Madden, S. C., Lebouteiller, V., et al. 2015, A&A, 578, A53
- Davies et al. (2016) Davies, R. L., Groves, B., Kewley, L. J., et al. 2016, MNRAS, 462, 1616
- Davoust & Contini (2004) Davoust, E., & Contini, T. 2004, A&A, 416, 515
- De Breuck et al. (2011) De Breuck, C., Maiolino, R., Caselli, P., et al. 2011, A&A, 530, L8
- De Looze et al. (2014) De Looze, I., Cormier, D., Lebouteiller, V., et al. 2014, A&A, 568, A62
- Fischer et al. (2018) Fischer, C., Beckmann, S., Bryant, A., et al. 2018, Journal of Astronomical Instrumentation, 1840003. https://doi.org/10.1142/s2251171718400032
- Foreman-Mackey (2016) Foreman-Mackey, D. 2016, The Journal of Open Source Software, 24, doi:10.21105/joss.00024. http://dx.doi.org/10.5281/zenodo.45906
- Foreman-Mackey et al. (2013) Foreman-Mackey, D., Hogg, D. W., Lang, D., & Goodman, J. 2013, PASP, 125, 306
- Fruchter & Hook (2002) Fruchter, A. S., & Hook, R. N. 2002, PASP, 114, 144
- Graciá-Carpio et al. (2011) Graciá-Carpio, J., Sturm, E., Hailey-Dunsheath, S., et al. 2011, ApJ, 728, L7
- Herrera-Camus et al. (2015) Herrera-Camus, R., Bolatto, A. D., Wolfire, M. G., et al. 2015, ApJ, 800, 1
- Herrera-Camus et al. (2018) Herrera-Camus, R., Sturm, E., Graciá-Carpio, J., et al. 2018, ApJ, 861, 95
- Hollenbach & Tielens (1999) Hollenbach, D. J., & Tielens, A. G. G. M. 1999, Reviews of Modern Physics, 71, 173
- Husemann et al. (2014) Husemann, B., Jahnke, K., Sánchez, S. F., et al. 2014, MNRAS, 443, 755
- Husemann et al. (2013) Husemann, B., Wisotzki, L., Sánchez, S. F., & Jahnke, K. 2013, A&A, 549, A43
- Husemann et al. (2017) Husemann, B., Tremblay, G., Davis, T., et al. 2017, The Messenger, 169, 42
- Kauffmann et al. (2003) Kauffmann, G., Heckman, T. M., Tremonti, C., et al. 2003, MNRAS, 346, 1055
- Kennicutt & Evans (2012) Kennicutt, R. C., & Evans, N. J. 2012, ARA&A, 50, 531
- Kewley et al. (2001) Kewley, L. J., Dopita, M. A., Sutherland, R. S., Heisler, C. A., & Trevena, J. 2001, ApJ, 556, 121
- Klein et al. (2010) Klein, R., Poglitsch, A., Raab, W., et al. 2010, in Proc. SPIE, Vol. 7735, Ground-based and Airborne Instrumentation for Astronomy III, 77351T
- Kramer et al. (2013) Kramer, C., Abreu-Vicente, J., García-Burillo, S., et al. 2013, A&A, 553, A114
- Langer & Pineda (2015) Langer, W. D., & Pineda, J. L. 2015, A&A, 580, A5
- Lord (1992) Lord, S. D. 1992, A new software tool for computing Earth’s atmospheric transmission of near- and far-infrared radiation, Tech. rep.
- Luhman et al. (2003) Luhman, M. L., Satyapal, S., Fischer, J., et al. 2003, ApJ, 594, 758
- Madden (2000) Madden, S. C. 2000, New A Rev., 44, 249
- Moser et al. (2016) Moser, L., Krips, M., Busch, G., et al. 2016, A&A, 587, A137
- Röllig et al. (2006) Röllig, M., Ossenkopf, V., Jeyakumar, S., Stutzki, J., & Sternberg, A. 2006, A&A, 451, 917
- Sargsyan et al. (2014) Sargsyan, L., Samsonyan, A., Lebouteiller, V., et al. 2014, ApJ, 790, 15
- Scharwächter et al. (2011) Scharwächter, J., Dopita, M. A., Zuther, J., et al. 2011, AJ, 142, 43
- Smith et al. (2017) Smith, J. D. T., Croxall, K., Draine, B., et al. 2017, ApJ, 834, 5
- Stacey et al. (1991) Stacey, G. J., Geis, N., Genzel, R., et al. 1991, ApJ, 373, 423
- Stacey et al. (2010) Stacey, G. J., Hailey-Dunsheath, S., Ferkinhoff, C., et al. 2010, ApJ, 724, 957
- Weilbacher et al. (2012) Weilbacher, P. M., Streicher, O., Urrutia, T., et al. 2012, in Proc. SPIE, Vol. 8451, Software and Cyberinfrastructure for Astronomy II, 84510B
- Wolfire et al. (2003) Wolfire, M. G., McKee, C. F., Hollenbach, D., & Tielens, A. G. G. M. 2003, ApJ, 587, 278
- Young et al. (2012) Young, E. T., Becklin, E. E., Marcum, P. M., et al. 2012, ApJ, 749, L17