Far-infrared emission of massive stars
We present results of the analysis of a sample of 22 stars of spectral types from O7 to B5 and luminosity classes I–V for which spectra from the Infrared Spectrograph (IRS) of Spitzer are available. The IRS spectra of these stars are examined for signs of excess infrared (IR) emission by comparison with stellar atmospheric spectra. We find that the spectra of half of the studied stars are dominated by excess emission in the far-IR, including all six super- and bright giants. In order to examine the origin of the far-IR excess, we supplement the Spitzer data with optical high-resolution echelle spectroscopy (), near-IR high-contrast coronagraphic imaging taken with the SPHERE instrument at VLT with a spatial resolution of 05, and WISE and Herschel photometry. In the optical region, we detect various absorption and emission lines (H , C III, and N III) irrespective of the far-IR excess. Pfund and Humphrey lines are observed at the same time as the far-IR excess. These lines are stronger in stars with far-IR excess than in stars without excess. A scattered-light disk in the central region of the far-IR excess stars HD 149404, HD 151804, and HD 154368 can be excluded from H band imaging down to a 1 contrast of . The far-IR excess is fit either by a free-free component from ionized gas as for the winds of hot stars or a large (1 pc) circumstellar dust shell. The putative dust envelopes required to explain the excess have a visual extinction as low as a few hundred -mag.
Key Words.:
Radiative transfer – dust, extinction – Stars: massive – circumstellar matter – Stars: mass-loss1 Introduction
Thanks to the sensitivity of recent space missions, particularly the Spitzer and Herschel space telescope, infrared (IR) excess emission has been revealed for a large number of stars in a variety of environments. In low-mass stars, IR excess emission is commonly attributed to the presence of circumstellar dust, which absorbs stellar radiation and re-radiates it in the IR. This includes protoplanetary disks and AGB shells as well as debris disks. In more massive main sequence stars, excess emission is commonly attributed to thermal free-free emission in a hot, dense ionised wind (Hartmann & Cassinelli 1977). This produces a continuum of emission from the IR to the radio with a distinctive power-law spectral index (Barlow 1979). A particular case are Be-stars emitting copious free-free radiation (Rivinius al. 2013 for a recent review). However, in the IR it is difficult to distinguish free-free from optically thin dust emission. The presence or absence of dust could hold important information regarding sources of interstellar dust, particularly in high-redshift galaxies, and the formation and evolution of massive stars.
We present a sample of massive stars for which Spizter/IRS (Houck et al. 2004) 5 - 35 m spectra are available. These mid- to far-IR spectra111We use terminology of near-IR including atmospheric windows in the JHK bands, mid-IR including LMN bands, and far-IR for longer wavelengths up to 200m are used to search for excess emission over the expected photospheric flux, which we seek to correctly attribute to wind and/or dust emission. In Sect. 2 we outline our sample selection and the data available for the stars. Section 3 discusses the modeling of the excesses as either wind or dust emission including the possible origins of the grains. Section 4 summarises our conclusions.
| Designation | RA | DEC | SpT | V | |
|---|---|---|---|---|---|
| J2000 | (mag) | (mag) | |||
| HD 24912 | 03:58:57.90 | 35 4727.71 | O8IV | 4.06 | 0.35 |
| HD 34816 | 05:19:34.52 | 131036.44 | B0.5IV | 4.29 | 0.05 |
| HD 36861 | 05:35:08.27 | 095602.96 | O8III | 3.47 | 0.09 |
| HD 38087 | 05:43:00.57 | 021845.38 | B3II | 8.29 | 0.31 |
| HD 47839 | 06:40:58.66 | 095344.72 | O7V | 4.64 | 0.07 |
| HD 53367 | 07:04:25.53 | 102715.74 | B0IV e | 6.96 | 0.74 |
| HD 62542 | 07:42:37.22 | 421347.84 | B3V | 8.03 | 0.36 |
| HD 64760 | 07:53:18.16 | 480610.56 | B0.5III | 4.24 | 0.08 |
| HD 65575 | 07:56:46.71 | 525856.47 | B3IV | 3.43 | 0.05 |
| HD 108639 | 12:29:09.51 | 604817.55 | B1III | 8.57 | 0.35 |
| HD 147933 | 16:25:35.10 | 232648.70 | B1.5V | 5.05 | 0.47 |
| HD 149404 | 16:36:22.56 | 425131.90 | O8.5Ia | 5.52 | 0.62 |
| HD 149757 | 16:37:09.54 | 103401.53 | O9.2V | 2.56 | 0.31 |
| HD 151804 | 16:51:33.72 | 411349.93 | O8Iab | 5.22 | 0.30 |
| HD 154368 | 17:06:28.37 | 352703.77 | O9.5Ia | 6.13 | 0.76 |
| HD 165024 | 18:06:37.87 | 500529.31 | B4II | 3.66 | 0.05 |
| HD 188209 | 19:51:59.07 | 470138.42 | O9.5III | 5.63 | 0.15 |
| HD 190918 | 20:05:57.32 | 354718.15 | O9.7Ia | 6.75 | 0.41 |
| HD 192639 | 20:14:30.43 | 372113.81 | O7.5Iab | 7.11 | 0.61 |
| HD 206773 | 21:42:24.18 | 574409.79 | B0V e | 6.87 | 0.45 |
| HD 210839 | 22:11:30.58 | 592452.15 | O6Ib | 5.05 | 0.57 |
| HD 214680 | 22:39:15.68 | 390300.97 | O9.5V | 4.88 | 0.08 |
Notes. HD 38087 is a binary, HD 53367 is a Herbig Be binary, HD 190918 is a WR+O star binary, HD 206773 is a Be star, HD 149404 is a multiple object, HD 214680 shows no sign of a binary in our two HR spectra despite that it is marked as a binary in SIMBAD.
2 Observations
2.1 Sample
We select a sample of targets that forms a subsample of the Voshchinnikov & Henning (2010) sample of 196 OB stars, which were originally selected for knowledge of the dust phase abundances of O, Mg, Fe and Si in the interstellar medium (ISM). The available data was extended in Voshchinnikov et al. (2012) by collating fractional polarisation measurements. In the optical region it is shown that the wavelength dependence of polarisation towards these stars follows a Serkowski curve (Bagnulo et al. 2017). The polarisation cannot therefore be due to scattering on dust or free electrons and must come from dichroic absorption by aligned dust particles. Further, it is assumed that the dichroism appears along the sightline towards the star in the diffuse ISM (Siebenmorgen et al. 2018), and ignoring any connection with the circumstellar environment of the stars. Voshchinnikov et al. (2012) study the role of the elements in the grain alignment that results in polarisation. Table 1 lists the relevant details of our sample, taken from the aforementioned papers, and references to the spectral types of the star.
2.2 Archival data
Our selection of stars is based on the availability of archival IRS (Houck et al. 2004) spectra, giving us a total of 22 stars. These data were complimented with optical (UBVRI) and near-IR (JHK) photometry obtained from Vizier/CDS and the 2MASS point-source catalogue (Cutri et al. 2003; Skrutskie et al. 2006). Where possible, further archival IR data were collected including those from the Infrared Array Camera (Fazio et al. 2004) of Spitzer, AKARI (Ishihara et al. 2010), the Infrared Astronomical Satellite (IRAS, Neugebauer et al. 1984; Joint Iras Science 1994), the Wide-Field Infrared Survey Explorer (WISE, Cutri et al. 2012) photometry, and Infrared Space Observatory (ISO) spectra from the Short Wavelength Spectrometer (SWS, Sloan et al. 2003). In most cases only upper limits are available. Unfortunately it has not been possible to locate higher-quality data at wavelengths longer than 40 m from the Multi-Band Imaging Photometer (MIPS) of Spitzer. However, point-source photometry of the Photodetector Array Camera and Spectrometer (PACS) of Herschel (Marton et al., 2017) is available at 70, 100, and 160 m for HD 24912, HD 149404, HD 149757, HD 151804, and HD 210839.
2.3 Detection of excess far-IR emission
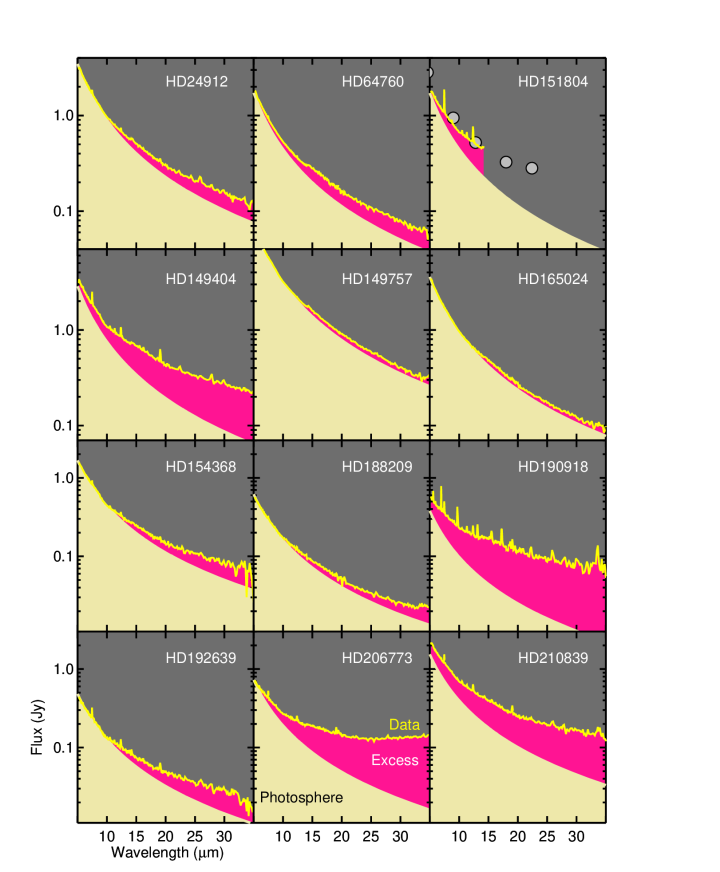
The photospheric flux of the sources is determined by taking a black-body spectrum appropriate to the spectral type of the star, giving a satisfactory fit to the 2MASS, WISE, and UBVRI photometry accounting for distance and foreground extinction. In the optical region the reddening correction is important. We take for each sightline the extinction curve and foreground extinction as given by Valencic et al. (2004), Fitzpatrick (2004), Fitzpatrick & Massa (2007), and Gordon et al. (2009). We compare this estimate of the photospheric flux with stellar atmosphere models taken from the Castelli & Kurucz (2004) atlas for the stellar type given in Table 1. The stellar atmosphere models are identical to black bodies at wavelengths m and in the optical continuum when reddened by additional 0.1 mag. Given the precision of IR photometry we believe the uncertainties on photospheric parameters to be less than 10%. Temperatures for the black body spectra were based on the Heap et al. (2006) calibration of O-star properties, and this was also used as a starting point for the luminosities. Figure 1 shows the IRS spectra and the contribution of the photospheres. The photospheric contribution thus determined was subtracted from the IRS spectrum to identify excess emission. The precision of our estimate of the emission by the photosphere is exemplified in Fig. LABEL:pl_sedust.fig. Apparently our single stellar temperature fits the optical/IR photometry well. The model provides a reasonable estimate of the far-IR emission of the photosphere, even for multiple-component systems such as HD 149404.
For 12 of the 22 sources, the fractional excess over a large portion of the IRS wavelength coverage, and for two stars, HD 149757 and HD 165024, the detected excess is marginal (Fig. 1). Ten of the stars are not considered host excess emission. Given the high signal-to-noise ratio S/N of our IRS spectra with absolute flux uncertainties of a few percent, this lower limit is somewhat conservative but allows for reasonable (¡ 10%) uncertainty in the photospheric parameters. The excess becomes clearly visible at wavelengths m and in Fig. 1 can be seen to be most pronounced at the longest wavelengths, such that we refer to it as far–IR excess.
| Star | Instr. | Date | Distance | H | C III | N III | Pf | Hu | ||||
| paral. | Ca II | Sp/L | 7.5 m | EW | 12.3 m | EW | ||||||
| (pc) | ( W/m) | () | ( W/m) | () | ||||||||
| Excess | ||||||||||||
| HD 24912 | GRANS | 19960826 | 725 | 500 | 640 | no | yes | yes | 67 | 58 | ||
| HD 64760 | UVES | 20090923 | 360 | 440 | 525 | weak wings | no | no | 37 | 42 | ||
| HD 149404 | UVES | 20090308 | 1315 | 1865 | 1240 | yes double | yes | yes | 224 | 176 | ||
| HD 149757 | HARPS | 20060310 | 112 | 230 | 240 | weak | no | no | - | - | ||
| HD 151804 | FEROS | 20040502 | 1640 | 1680 | 1365 | yes + H | yes | yes | 473 | 254 | ||
| HD 154368 | UVES | 20090306 | 1220 | 1290 | 1290 | marginal | yes | no | 81 | 72 | ||
| HD 165024 | FEROS | 20040706 | 280 | 440 | 350 | no | no | no | - | - | ||
| HD 188209 | BOES | 20050526 | 1490 | 1410 | 1270 | yes | yes | no | 57 | 84 | ||
| HD 190918 | BOES | 20070615 | 1960 | 3440 | 2290 | yes | yes | ? | 274 | 174 | ||
| HD 192639 | ELODIE | 20010811 | 2600 | 2080 | 2115 | yes asym | yes | yes | 221 | 96 | ||
| HD 206773 | — | — | 960 | 550 | 595 | — | — | 154 | 117 | |||
| HD 210839 | MAESTRO | 20040828 | 620 | 1250 | 1190 | yes | yes | yes | 187 | 129 | ||
| No excess | ||||||||||||
| HD 34816 | Sandiford | 19930210 | 270 | 410 | 380 | no | no | ? | - | - | ||
| HD 36861 | UVES | 20040205 | 340 | 530 | 490 | no | yes | yes | 16 | - | ||
| HD 38087 | UVES | 20050321 | 340 | 470 | 490 | no | ? | no | 121 | - | ||
| HD 47839 | GRAMS | 19960405 | 280 | 710 | 665 | no | yes | yes | - | - | ||
| HD 53367 | UVES | 20091215 | – | 1000 | 780 | yes | ? | yes | 39 | 33 | ||
| HD 62542 | UVES | 20031113 | 390 | 450 | 530 | no | no | no | 6 | 33 | ||
| HD 65575 | — | — | 420 | 155 | 390 | — | — | — | - | - | ||
| HD 108639 | — | — | 1820 | 2380 | 2280 | — | — | — | 16 | 37 | ||
| HD 147933 | HARPS | 20070330 | 145 | — | 100 | no | no | no | - | - | ||
| HD 214680 | MAESTRO | 19660704 | 360 | 690 | 615 | no | no | no | - | - | ||
Optical high-resolution spectra of this instrument are made available at CDS. Parallax from GAIA (DR2) by the Gaia Collaboration (Brown et al. 2018) Out of five spectra taken between 1993 -2010 only the HARPS spectrum taken 2006-03-10 shows weak H emission (Fig. LABEL:Halpha149757.fig).