Effective Predictions of Gaokao Admission Scores for College Applications in Mainland China
Abstract
Gaokao is the annual academic qualification examination for college admissions in mainland China. Organized by each provincial-level administrative region (PAR), Gaokao takes place at the same time nationwide in early June. To enroll in a university in September, students must take Gaokao and submit common applications for admission to their home PAR Gaokao office in July, listing a small and fixed number of universities and majors they intend to attend and study. About 9.5 million high-school seniors participate in Gaokao every year, and the Gaokao scores are good for just one year. A student has a strong chance to be accepted if their Gaokao score is better than the admission scores of the universities they selected in their applications. However, the admission scores of universities are unknown at the time when filling out applications, which to be determined dynamically during the admission process and may fluctuate from year to year. To increase their chances of acceptance to a best-suited university, students need to predict admission score of each university they are interested in. Early prediction methods are empirical without the backing of in-depth data studies. We fill this void by presenting well-tested mathematical models based on the ranking of Gaokao scores in a PAR. We show that our methods significantly outperform the methods commonly used by teachers and experts, and can predict admission scores with an accuracy of about 91% within a 7-point margin in an exam of a 750-point grading scale.
Keywords:
Gaokao; college admission; prediction models; anomaly detection; recommendation system; general morphological analysis.I Introduction
Almost all people who plan to pursue higher education in mainland China must take the Gaokao exams for college admissions. There are two types of exams: the “Li-Ke” exam (meaning the science exam) and the “Wen-Ke” exam (meaning the liberal-arts exam). Students who are interested in pursuing a major in science and engineering are required to take the “Li-Ke” exam, and students who are interested in pursuing a major in art and humanity and social sciences are required to take the “Wen-Ke” exam. Depending on students’ Gaokao scores and the admission quota for each PAR, the provincial Gaokao office determines an appropriate minimum admission score for each tier of universities. This score is the provincial Admission Score Cutoff Line (ASCL). The total of about 2,400 universities and colleges in mainland China are officially designated into three tiers based on the qualities of the degree programs they offered. After the announcement of ASCL, students only have a few days to submit their applications. They are allowed to apply for universities of a particular tier only if they pass the corresponding ASCL for that tier. Early policies such as “apply before taking exams” and “apply after taking exams but before knowing scores” were eliminated in 2017. Recently, some PARs have re-designated universities of three tiers into only two tiers, and this seems to be the current trends.
To guarantee that each student is admitted by at most one university, each PAR uses one of the following models to restrict how admission staff members can access applications: parallel admission, gradient admission, and hybrid admission. The first model follows the principle of “scores first, according to preference” and the second model follows the principle of “preference first, according to scores.” In recent years, increasingly more PARs have adopted the parallel admission model.
Under any of these admission models, students need to guess the admission scores of a university and its majors to obtain admissions that better match their abilities and interests.
Without a trusted prediction model, what students can rely on is the following: published ASCLs of their home PAR; inputs from teachers and other sources; and the statistics of admission scores in the past, for example, each university’s minimum, maximum, average admission scores, and the number of admitted students. Some PARs may also provide such statistics down to each major for each university. This process, unfortunately, is prone to substantially overestimating certain universities’ admission scores while underestimating the others. An added difficulty is that applicants only have a few days to make decisions (see Table I).
| Days | 4 | 5 | 6 | 7 | 8 | 9 | 10 | |
|---|---|---|---|---|---|---|---|---|
| PARs | 2 | 8 | 4 | 4 | 4 | 3 | 2 | 4 |
For example, in 2017, students in 18 PARs (there are a total of 33 PARs in mainland China) only have at most seven days to submit their applications (some only have four days) after they are notified of their Gaokao scores shortly after the ASCLs are published. Because of overestimates or underestimates of admission scores of the universities and majors they apply, applicants may end up being admitted by a university and major that poorly match their intention and ability or receiving no offers at all even though they could be admitted by some universities, resulting in mismatching admissions time and time again.
Despite its importance, early efforts on predicting admission scores have not produced satisfactory models. Most prediction methods published so far are based on past admission records with straightforward statistics. We attempt to fill this gap by analyzing extensive data sets of Gaokao admission records down to each student’s Gaokao score and which university and major that student was admitted to (with student’s identification removed). Our major contributions are described below:
-
1.
We present a series of mathematical prediction models based on the rankings of Gaokao scores. Our experiments show that our models can predict admission scores with an accuracy of about 91% within a 7-point margin in an exam of a 750-point grading scale.
-
2.
We modify an existing recommendation system using General Morphological Analysis (GMA) to provide reliable recommendations to students [5] according to the parallel admission model.
This paper is organized as follows. In Section 2, we describe existing methods for predicting admission scores. We then present in Section 3 our “ranking-based” prediction models. In Section 4, we present a recommendation system using General Morphological Analysis (GMA) based on predicted admission scores, which is a modification of our early recommendation system [5]. In section 5, we will describe our evaluating datasets, data pre-processing methods, and prediction accuracy comparisons of our methods and the standard methods used by most people.
II Related work
It is a common perception that knowing universities’ admission scores is the most important factor in determining how students should fill out applications for admissions. This perception was confirmed by Zhao and Wang [3].
All existing score-prediction methods used by high-school teachers and experts are empirical, and all methods published so far only exploit past admission scores. We refer to these methods as “scoring methods.” For example, Li et al. [1] assumed that the average admission score of each university is stable with a small variation each year, regardless of the ASCL scores. We refer to this model as the average admission score (AAS) model.
Zhao and Wang [3] and Zhu et al. [2] assumed that the differences between the PAR ACSLs and the admission scores of each university over the years are stable with only minor variations. We refer to this model as the average admission difference (AAD) model.
However, Wang and Wu [4] showed that for the past ten years, the differences between the ASCLs and the admission scores of certain tier-1 universities are consistently increasing. In particular, for top-ranking universities, the average differences have increased 45.9 points for the Li-Ke exam and 24.3 points for the Wen-Ke exam.
III Prediction models
We first describe our baseline model and then present two improvements, each addressing a weakness in the baseline.
The underlying principle of our designs is the following observation: Each university would likely admit students of the same quality from the same PAR, even though the ASCLs and the Gaokao scores of students of the same level in that PAR may fluctuate from year to year. This is particularly true for universities and majors that are better established. The ranking of a student’s Gaokao scores in the same PAR would be a better indication of the student’s quality, not the Gaokao score itself. For example, a university would typically admit students whose Gaokao scores are of roughly the same ranks from the same PAR in the recent years, for the quality of a university and the general perception of its prestige does not change dramatically.
In this paper, we will only focus on the prediction of the admission Gaokao score for each university, rather than the admission score for each major of a university. Without loss of generality, in what follows our discussions are for a particular PAR and we will not specifically mention which one. We assume that we have a score-to-ranking table for all students in a particular year, where each Gaokao score corresponds to a ranking. Let and denote, respectively, two score-ranking operations, where represents the current year (e.g., this year), takes a ranking of a Gaokao score in Year as input and finds the corresponding score using a score-ranking table in Year , while is the inverse operation of , which takes a Gaokao score as input and returns its ranking.
Note that for each Gaokao score there may be a large number of students with that score. Thus, we define to be the smallest ranking after all students whose Gaokao scores are greater than . In other words, if there are students whose Gaokao scores are greater than , then . Note that there may be many students tied for the same rank, as many as thousands, since on average each PAR has about 300 thousand students participating in Gaokao.
We will also use the following notations:
-
•
denotes a university.
-
•
denotes the admission score of in Year .
-
•
denotes the ASCL in Year for universities of a particular tier, which is also the lowest Gaokao score in Year for this admission tier; when we need to specify which tier, we may use to denote the ASCL in Year for universities of tier-, where .
-
•
denotes the total number of students admitted in Year for universities of a particular tier.
-
•
denotes the highest Gaokao score in Year for universities of a particular tier.
We use SRT to denote the score-ranking table.
III-A Baseline ranking model (BRM)
Our baseline model is based on the following assumption: Each university admits students whose Gaokao scores are in a stable range of rankings over the recent two to three years, even though the Gaokao scores of the same rankings may fluctuate. This is a reasonable assumption, particularly for well-established universities with stable reputations. Thus, assuming that the ranking of the admission scores for a university in two consecutive years are the same, we have
| (1) |
Recall that is the inverse operation of . Thus, we can predict the admission score of in Year by applying on both sides of the equation as follows:
| (2) |
III-B Weight slicing model (WSM)
We note that BRM would work well if the total number of students to be admitted in Year is about the same as the total number of students admitted in the previous year . However, is unknown when students are filling out applications. We may instead look at the difference of the ASCLs of Year and Year for a given tier of universities. Let
Our experiments show that, when is small, the baseline ranking model performs well; but when is large, predictions are less than satisfactory.
To resolve this problem, let us think of as weight and divide it into different portions. We then distribute each portion to a range of ranking proportionally.
In particular, we divide into such that is the smallest integer satisfying the following inequality:
Let denote the number of students whose Gaokao score is . Note that is typically much larger than if . That is, the number of students at the same rank is larger if the corresponding Gaokao score is smaller. We perform the following:
-
1.
Recall that is the total number of universities of a particular tier in Year . Sort these universities in descending order based on their admission scores as , where has the highest admission score and the lowest. If two universities have the same admission scores, we use out-of-band data to determine their ordering, such as the general perception of prestige, locations of the universities, among other things. Let
for . It is easy to show that
Let . We separate the interval into consecutive intervals according to their indexes:
-
2.
For a given university in the -th interval, add to the baseline ranking model to make the prediction:
III-C Weighted point model (WPM)
Similar to WSM, the weighted point model also modifies the baseline ranking model by adding a bias to the admission score of each university, but from a different perspective. The purpose is to fix a problem resulted from the following scenario: Suppose that is much larger than and the total number of applicants in Year is about the same as that in Year . This implies that the same Gaokao score that did not pass the admission score of university in the previous year may pass it this year. In other words, more students have higher Gaokao scores than the previous year. Since by assumption that each university’s admission quota stays about the same this year, it has to increase its admission score accordingly. WPM simulates this process as follow:
-
1.
Let denote the average number of students per point in the previous year. That is,
-
2.
For a given university , let denote the total number of students whose Gaokao score is exactly . That is,
-
3.
Let if . Otherwise, let denote the smallest integer that satisfies the following inequality:
where
-
4.
For a given university , add to the baseline ranking model as follows:
IV Recommendation model
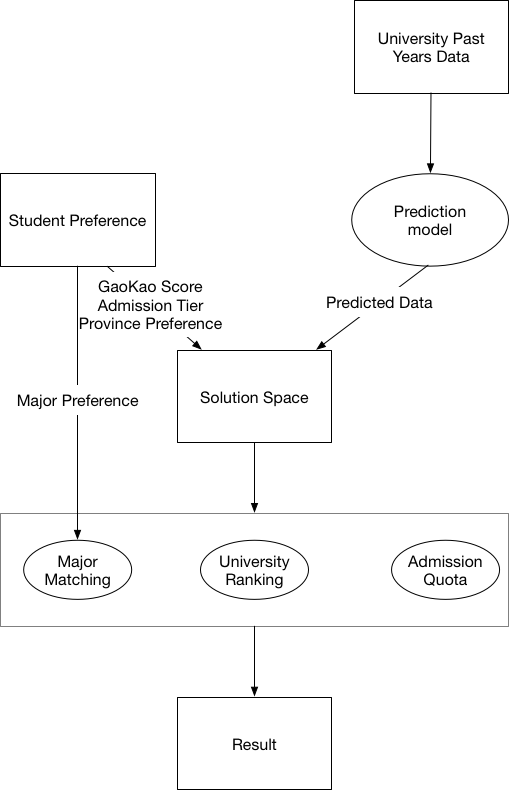
We present a recommendation system that modifies our previous Gaokao application recommendation model called EEZY (meaning “personalized recommendations”) using general morphological analysis (GMA) [5]. Using a large volume of complete Gaokao admission data we collected over the past several years, our system can help students make decisions based on their Gaokao scores and interests and give them a matching measurement for each recommendation slot. By “complete Gaokao admission data” it means for each year, the data consists of information of each admitted student, where is the student’s Gaokao score, and are the university and major that admit the student. Without using a prediction model, however, EEZY could only match the applicant’s Gaokao score with the previous year’s data. We modify this system by adding a prediction model.
We define seven parameters for students to identify their personal preference, and another set of seven parameters for each university to represent its status (see Table II). The meanings of these parameters are self-explanatory.
| Student preference | University status |
|---|---|
| Gaokao Score | Admission Score |
| Exam Type | Major Type |
| Tier | Admission Tier |
| Preferred Location | Location |
| Disliked Location | Majors |
| Preferred Major | Ranking |
| Disliked Major | Enrollment |
Next, we form a solution space based on the predefined parameters. For each university , find the admission score and the highest admission score . Choose one of the prediction models and use it to predict and . We divide
into intervals as follows:
where is the number of universities students are allowed to apply which is predetermined by students’ PAR Gaokao office, is a predefined small positive integer depending on (e.g., we may select ), and
. A university is in the solution space if the applicant’s Gaokao score falls into one of the intervals. We categorize the solution space based on the parallel admission model. For instance, suppose in a parallel admission model, students are allowed to enter three universities, then and we have A-, B-, and C-recommendations. Then the intervals are
A university is in an applicant’s A-recommendation when the applicant’s Gaokao score falls in the A-interval. Universities listed in the A-recommendation are competitive for the applicant, but the applicant still has a small chance to be admitted. Universities listed in the B-recommendation present a good match with the applicant, who has a good chance to be accepted. Universities listed in the C-recommendation are the safest choices for the applicants, yet match the applicant’s ability. The architecture of the recommendation system is shown in Figure 1. The reader is referred to [5] for more information about the EEZY Gaokao application recommendation system.
V Experiments and Results
We consider the following seven features in our experiments, divided into two groups. The first group consists of the basic information: (1) PAR, (2) exam type, (3) admission tier, and (4) university name. The second group consists of (5) the highest score, (6) the admission score, and (7) the enrollment number for each university, which are baseline features for prediction and recommendation.
V-A Dataset
Enrollment data which contains each student’s enrollment information is the best data to generate all the features we need. In addition to the basic information, a useful enrollment dataset should include each student’s Gaokao score, admitted university, and admitted major. We can then generate all the features using statistical methods for each university and each major.
For most PARs, enrollment data is not easy to find. Instead of using all the feature, our baseline features can be satisfied easily. Each PAR publishes a printed Gaokao Application Official Guide that contains previous years’ Gaokao data to help applicants make decisions. The baseline features can be easily found in the official guide. We devised a procedure to turn printed books into editable excel files using off-the-shelf OCR software.
V-B Preprocessing
After data is collected, we would need to generate, for each PAR and each admission tier, a score-ranking table of the previous year; and detect and remove outliers to ensure prediction quality.
V-B1 Score-ranking table generation
A score-ranking table of the current year (i.e., Year ) is necessary for our prediction models. With this table, students can easily find their rankings based on their scores. Some PARs publish this table at the time when the students are notified of their Gaokao scores before the application begins. However, not all PARs provide this information on time. Some other PARs may only publish part of the table (e.g., they only publish a table with rankings for every five points). We devise methods to deal with these two scenarios by approximating .
Assume that the ranking data is available every five points. We use the PCHIP interpolation method from MATLAB on the current year’s incomplete score-ranking table to generate new data points. Figure 2 shows an example of the interpolation results on 2015 Jiangsu Province’s officially announced rankings of scores every five points. Also displayed is the true score-ranking table of 2015. We can see that the interpolation results match with the true values very well. In particular, the maximum error of the interpolated points is only 0.5 points smaller than the true value.
Assume that none of the score-ranking data for the current year is available. The following method generates an approximation of .
-
a)
For a given PAR, exam type, and tier find the highest score as the upper bound, and use the ASCL of the PAR as the lower bound; these numbers can be quickly found from the Internet.
-
b)
If the score-ranking data of the current year is incomplete, we apply the PCHIP interpolation method to generate new data points within the interval to generate .

Figure 2: Comparison of the interpolated score-ranking curve with the true score-ranking curve for Jiangsu 2015 
Figure 3: Comparison of the predicted score-ranking curve of Henan 2015 with the true score-to-ranking curve, where the maximum error is 1 point -
c)
If the score-ranking data for the current year is not available, let . For each point in the score-ranking table of Year , compute an amended point , where
-
d)
Let , , and denote, respectively, the amended score-ranking table, highest score, and lowest score.
-
e)
Separate the amended into two parts: (1) , which is the higher score segment; (2) , which is the lower score segment.
-
f)
Apply the Fourier curve fitting method on both segments to obtain two curves that fit the score-to-rank data. Note that if we only use one curve instead of two, then it may result in deviation in the higher score segment.
-
g)
Combine the two curves, denoted by .
-
h)
Generate data points using to form the score-ranking table .
Figure 3 shows an example of predicted score-ranking table of 2015 in Henan province using the dataset of 2014, with the maximum error of just 1 point.
V-B2 Outlier detection
The Gaokao policy states that minority nationality students, students from remote rural areas, and students with exceptional talents in sciences or sports may be admitted with lower Gaokao scores. These scores lower the university’s admission score, which in turn would affect the prediction results. Thus, it is necessary to detect and remove such scores and other outliers. As an example of other outliers, a student of an exceptionally high Gaokao score who could be admitted to a university of a much higher rank chooses to go to a university of a lower rank because of its location or major.
We use the median absolute deviation (MAD) method [7] to find outliers. Sort the student scores in ascending order. Let denote the -th score. That is,
where is the number of students admitted by in Year .
Single MAD test
-
a)
Let denote the median of .
-
b)
Let denote the difference between a student score and the median. That is, for .
-
c)
Let MAD denote the median of .
-
d)
For each from both ends, if
then is considered an outlier and removed.
Double MAD test
-
a)
Let
Let and denote, respectively, the median of and .
-
b)
Let for .
-
c)
Let be the median of and the median of .
-
d)
If and
then is considered an outlier and removed.
If and
then is considered an outlier and removed.
V-C Experiment Results
It is commonly known that certain universities and majors may present the scenario of “big-year-and-small-year”; namely, in one year for some reasons many students apply to the same major at a certain university, resulting in a much higher admission score than it should be. This discourages students in the next year to apply to this major at this university, resulting in a much lower admission score than it should be. This cycle may repeat, but we argue that it suffices to only look at the most recent two consecutive years of data to predict admission scores of the new year. In particular, if the reputation of a university’s degree programs is stable, then looking at the past two years is sufficient. If it is unstable, either up or down, then looking at the past two years would be much closer to what it would be today than looking at years further before.
We collected three years (2013–2015) of Gaokao admission data for a number of PARs. We use the data of 2013 and 2014 for modeling and the data of 2015 for validation. In this section, we will use the admission data of Henan, Hebei, and Jiangsu provinces to demonstrate our results. Henan and Hebei exams are graded using a 750-point grading scale, while the Jiangsu exams are graded using a 480-point grading scale. The accuracies of predictions for all provinces we tested are similar.
We first apply outlier detection method on the dataset to remove outliers. Our models do not require training, so we directly run the three models on the 2015 data for evaluating predictions using the 2013 and 2014 data. We first apply the 2013 dataset to predict the admission scores of 2015, then do the same using the 2014 dataset. We then compute the mean as the final result to deal with the “big-year-and-small-year” scenario. We carry out validations separately for each type of exams (the Li-Ke exam and the Wen-Ke exam) and each admission tier. For simplicity, we only consider tier-1 and tier-2 university admissions.
Because there are many factors that would affect the admission score for a particular university, it is difficult to predict admission scores to be exactly same as the true admission scores. A small error is allowed when experts make predictions. For an exam of a 750-point grading scale, we would accept errors of 5 to 7 points predicted admission scores, for the reason that such a prediction result is good enough for making robust recommendations. Moreover, the EEZY recommendation model we described in Section 4 can further reduce the impact of such an error using the parallel admission model.
We also compare our prediction results with the two early models described in Section 2. They are the average admission score model (AASM) and the average admission difference model (AADM). For AASM, the prediction is computed as follows:
For AADM, the prediction is computed as follows:
As pointed out in Section 2, the current admission only correlates with the past two years of admission records. These two models are commonly used by teachers and experts to help students fill out their applications.
Let LK1 denote “Li-Ke exam for admission tier 1”, LK2 denote “Li-Ke exam for admission tier 2”, WK1 denote “Wen-Ke exam for admission tier 1”, and WK2 denote “Wen-Ke exam for admission tier 2” Let PD denote “Point Difference.” For example, by PD = 5 it means that the absolute value of the predicted admission score and the true admission score is less than or equal to 5. For each model, the percentage is the number of universities with correctly predicted admission scores over the total number of universities for a particular tier. For example, for WPM, the percentage of 90.6% for LK1 under PD = 7 means that WPM predicts 90.6% of tier-1 universities with PD = 7. The prediction results are listed in Table III.
| Model | PD | LK1 (%) | WK1 (%) | LK2 (%) | WK2 (%) |
|---|---|---|---|---|---|
| AASM | 5 | 12 | 41.6 | 29.9 | 11.9 |
| AADM | 12.8 | 21.9 | 25.5 | 33 | |
| BRM | 73.3 | 74.1 | 64.3 | 64.2 | |
| WSM | 80.5 | 76.3 | 75 | 70.5 | |
| WPM | 79.2 | 77 | 74.2 | 68.1 | |
| AASM | 6 | 15 | 47.9 | 36.1 | 14.7 |
| AADM | 15.3 | 24.7 | 31 | 36.6 | |
| BRM | 78.1 | 81 | 73.2 | 70.2 | |
| WSM | 84.7 | 82.5 | 79.4 | 76.7 | |
| WPM | 84.3 | 83.6 | 78.1 | 74.6 | |
| AASM | 7 | 17.8 | 54.3 | 42 | 19.7 |
| AADM | 20.1 | 29.6 | 36.3 | 44.8 | |
| BRM | 84.8 | 85.4 | 76.3 | 77.7 | |
| WSM | 89.4 | 88.7 | 82.2 | 81.1 | |
| WPM | 90.6 | 87.8 | 83 | 80.3 |
From Table III we can see that the predictions by the commonly used methods of AASM and AADM are far below satisfaction. We note that, in general, predictions for tier-1 universities by the three ranking based models are better for tier-2 universities. This is expected, for the reputations of tier-2 universities are not as stable as the reputations of tier-1 universities. Besides, the highest accuracy is produced by WPM, which is close to 91%.
Since Jiangsu exams are graded using a 480-point scale, we narrow the acceptable errors range from 5 to 7 to 3 to 5. As Table IV and V shows, our models all outperform AASM and AADM in Jiangsu and Hebei. The average accuracy for tier-1 universities is typically above 85% and can be as high as 90.5%. Moreover, WPM on average produces better predictions than WSM.
| Model | PD | LK1 (%) | WK1 (%) | LK2 (%) | WK2 (%) |
|---|---|---|---|---|---|
| AASM | 3 | 40.3 | 2 | 51 | 2.6 |
| AADM | 55.9 | 61.2 | 52.4 | 60.9 | |
| BRM | 66.8 | 60.7 | 58.1 | 57.9 | |
| WSM | 74.4 | 74.4 | 59.8 | 63.9 | |
| WPM | 73 | 81.3 | 61.4 | 67.6 | |
| AASM | 4 | 51.2 | 3.9 | 56.4 | 3.4 |
| AADM | 63 | 73.7 | 55.7 | 71.1 | |
| BRM | 76.2 | 70.7 | 65.1 | 70.7 | |
| WSM | 79.2 | 80.7 | 66.3 | 74.8 | |
| WPM | 80.6 | 84.1 | 69.8 | 74.5 | |
| AASM | 5 | 61.6 | 5.3 | 62.6 | 3.7 |
| AADM | 65.4 | 74.3 | 63.5 | 74.3 | |
| BRM | 82 | 82 | 71.9 | 76.8 | |
| WSM | 85.8 | 84.7 | 72.3 | 82.2 | |
| WPM | 84.8 | 90.5 | 75.4 | 83.1 |
| Model | PD | LK1 (%) | WK1 (%) | LK2 (%) | WK2 (%) |
|---|---|---|---|---|---|
| AASM | 5 | 24.9 | 44.7 | 37.3 | 29.1 |
| AADM | 22.2 | 9 | 8.4 | 27.8 | |
| BRM | 62.3 | 73.2 | 54.8 | 57.7 | |
| WSM | 70 | 74.8 | 62.9 | 60.6 | |
| WPM | 71.6 | 76.3 | 57.3 | 61.6 | |
| AASM | 6 | 27.2 | 52.3 | 43.8 | 34.9 |
| AADM | 24.5 | 13.1 | 9.8 | 34.4 | |
| BRM | 69.7 | 78.8 | 62.3 | 64 | |
| WSM | 77.8 | 81.3 | 71.2 | 73.5 | |
| WPM | 76.3 | 83.8 | 70.1 | 73 | |
| AASM | 7 | 33.9 | 55.8 | 49.9 | 40.7 |
| AADM | 28 | 15.1 | 11.2 | 40.7 | |
| BRM | 77.8 | 82.8 | 68.7 | 69.6 | |
| WSM | 82.9 | 86.4 | 74.2 | 77.2 | |
| WPM | 84.1 | 85.9 | 74.2 | 80.2 |
Remark. Further improvement of predictions can be obtained. For example, we note that the Gaokao scores of admitted students for a university follow a certain distribution close to being Gaussian, which allows us to extract additional features to help devise prediction models. We can also use supervised machine learning methods to train prediction models. Using these techniques, we can obtain better predictions. In particular, our preliminary results show that a 94% prediction accuracy for tier-1 universities can be achieved. We plan to report this work on a separate paper.
VI Conclusions and Future Work
We presented three models for predicting university admission scores in mainland China and evaluated these methods through extensive experiments. Our models achieved a considerably good prediction accuracy on the testing dataset. Moreover, we modified an existing recommendation system using morphological analysis. For future work, we will explore other prediction methods to improve accuracy. For example, we may use sequential data for a multi-year model. We are also interested in additional parameters to improve recommendation, including annual family incomes, occupations of parents, rankings of majors, perspectives of finding jobs of different majors, among other things.
Acknowledgment
This work was supported in part by Massachusetts Education International Inc and Tianhan Technology Inc under research and development grants. We are grateful to Shan Lu, Cheng Zhang, Wenjing Yang, Liqun Shao, and Xueyuan Guo for their help.
References
- [1] Li F., Gan L., and Yang X., Research on application timing and admission mechanism in the National College Entrance Examination, Educational Research, 2010, 31(10):53–59.
- [2] Zhu X., Fill out Gaokao applications using statistics methods, Chinese statistics, 2006, 10:57–58. DOI:10.3969/j.issn.1002-4557.2006.10.037.
- [3] Zhao X., and Wang X., Analysis and countermeasure research on parallel objective application factor, Journal of Shenyang Institute of Engineering (Social Sciences), 2012, 8(4): 478–480.
- [4] Wang G., and Wu T., Analysis on variation of top-ranking universities’ enrollment scores line gap and ”top-ranking universities craze,” Heilongjiang Researches on Higher Education, 2017, 4: 54–57.
- [5] Lu S., Zhang H., and Wang J., EEZY: A Gaokao recommendation system using general morphological analysis over big data, Morphological Generalis, Swedish Morphological Society, 2016, 5(1): 1–12.
- [6] Ritchey T., General morphological analysis–a general method for non-quantified modeling, Proceedings of the 16th Euro Conference on Operational Analysis, Brussels, July 1998.
- [7] Leys C., Ley C., Klein O., Bernard P., and Licata L., ”Detecting outliers: Do not use standard deviation around the mean, use absolute deviation around the median,” Journal of Experimental Social Psychology, 2013, 49(4): 764–766.
| John Doe Hello, here is some text without a meaning. This text should show what a printed text will look like at this place. If you read this text, you will get no information. Really? Is there no information? Is there a difference between this text and some nonsense like “Huardest gefburn”? Kjift – not at all! A blind text like this gives you information about the selected font, how the letters are written and an impression of the look. This text should contain all letters of the alphabet and it should be written in of the original language. There is no need for special content, but the length of words should match the language. |