Dynamic Phases, Stratification, Laning, and Pattern Formation for Driven Bidisperse Disk Systems in the Presence of Quenched Disorder
Abstract
Using numerical simulations, we examine the dynamics of driven two-dimensional bidisperse disks flowing over quenched disorder. The system exhibits a series of distinct dynamical phases as a function of applied driving force and packing fraction including a phase separated state as well as a smectic state with liquid like or polycrystalline features. At low driving forces, we find a clogged phase with an isotropic density distribution, while at intermediate driving forces the disks separate into bands of high and low density with either liquid like or polycrystalline structure in the high density bands. In addition to the density phase separation, we find that in some cases there is a fractionation of the disk species, particularly when the disk size ratio is large. The species phase separated regimes form a variety of patterns such as large disks separated by chains of smaller disks. Our results show that the formation of laning states can be enhanced by tuning the ratio of disk radius of the two species, due to the clumping of small disks in the interstitial regions between the large disks.
I Introduction
A large class of systems can be effectively described as a collection of interacting particles moving over a random pinning landscape, where a variety of distinct dynamical phases appear as a function of driving force 1 . Well studied examples of such systems include vortices in type-II superconductors 2 ; 3 ; 4 ; N1 ; N2 , driven Wigner crystals 5 ; 6 , skyrmions undergoing current-induced motion 8 ; 9 ; 10 , sliding pattern forming assemblies coupled to random landscapes 11 ; 12 , colloids on disordered substrates 13 ; 14 ; 15 ; 16 ; 17 ; 18 , and active matter moving in complex environments 19 ; 20 ; 21 . These systems often exhibit multiple nonequilibrium phase transitions, such as a transition from a pinned to a sliding phase followed by transitions to different types of sliding phases. Such transitions are associated with clearly observable changes in the velocity-force curves, fluctuation spectra, and spatial reordering of the particles.
Previous work on dynamical phase transitions in driven systems has primarily focused on long or intermediate range particle-particle interactions that tend to favor a uniform particle density, such as that found in magnetic or charged systems. When particles of this type are placed on quenched disorder composed of randomly placed strong pinning sites, three nonequilibrium phases emerge: a pinned disordered state, a plastic flow state in which the particle positions are disordered and the particles exchange neighbors as they move, and a dynamically reordered anisotropic crystal or moving smectic state that appears at high drives when the effectiveness of the pinning is reduced. 1 .
There are numerous examples of systems in which the particle-particle interactions are short ranged or steric, including many types of colloidal suspensions, emulsions, bubbles, and granular matter. Although it might be natural to assume that the short-range interactions would produce simpler behavior than the longer-range interactions when the particles are driven over quenched disorder, it was recently shown that monodisperse hard disks moving over a random pinning landscape exhibit a remarkably rich variety of dynamical phases, including clogging, disordered plastic flow, segregated flow, laning flow, and moving crystals 22 . The disk system can form moving density segregated states containing high density bands coexisting with low density regions. In some cases, the dense bands form close packed hexagonal lattices even when the overall density of the system is well below the crystallization density. At higher drives, the crystalline bands break up to form dense one-dimensional chains, while at higher densities the disks form a moving crystalline solid 22 . Density separated phases cost no energy in systems with contact interactions, since the energy remains small even when the particles accumulate in one region and are depleted from another region. In contrast, when the interactions are longer range, the system can minimize its energy by destabilizing and dispersing any locally dense regions.
In this work, we consider bidisperse disks driven over quenched disorder consisting of randomly placed pinning sites. In the absence of driving or pinning, the disks form a jammed solid at densities well below the crystallization density of pin-free undriven monodisperse disks 23 ; 24 . Both monodisperse and bidisperse disks can exhibit a density segregation into dense and depleted regions, but the bidisperse disks can also undergo species segregation of the two disk sizes. Numerous studies have demonstrated species segregation under nonequilibrium conditions for short range repulsive bidisperse systems including granular matter 25 ; 26 ; 27 ; 28 and colloids 29 ; 30 ; 31 , where the degree of segregation depends on the ratio of particle sizes and the type of driving force applied. There are, however, few studies examining the impact of quenched disorder on size segregation. An understanding of segregation effects in flowing bidisperse disks coupled to quenched disorder not only offers new insights on depinning and sliding phenomena, but also could be used to develop new methods for separating or mixing bidisperse or multidisperse systems of particles. For example, some geological systems can be described in terms of multidisperse disks moving through random pinning, and such systems could undergo dynamic segregation.
This paper is organized as follows. We describe our simulation technique for the bidisperse disks driven over random pinning in Section II. In Section III, we show the dynamic patterns that form for a system in which 50% of the disks are large and the radius ratio of the large to small disks is 1.4. In Section IV, we consider large disks that are twice as big as the smaller disks while maintaining the fraction of large disks at 50%. In Section V, we show that by reducing the fraction of large disks to 10%, we can enhance the segregation and stratification effects. We examine the scaling of the velocity-force curves near depinning in Section VI, and we summarize our results in Section VII.
II Simulation
We consider a two dimensional (2D) system of size with periodic boundary conditions in the and directions. The sample contains disks, where disks have a small radius of and disks have a large radius of . The disk dynamics are governed by the following overdamped equation of motion:
| (1) |
Here is the damping constant and is the location of disk . The disk-disk interaction force is , where , is the radius of disk , , , is the Heaviside step function, and the spring constant is large enough to prevent the disks from overlapping by more than 1% of their radii. The pinning force is produced by pinning sites modeled as randomly placed non-overlapping parabolic wells cut off at a radius of that can each capture at most one disk with a maximum pinning force of . The density of the system is given by the area covered by the disks, , where and . We vary and set the radius ratio to in Sec. III and in Sec. IV. In a previous study of the jamming of bidisperse disks using this model with , the jamming density in a pin free sample is 32 . We set , giving a fixed pinning site density of . Previous studies have shown that increasing does not alter the behavior, but only shifts the driving forces at which the dynamical transitions occur 22 . The driving force is applied uniformly to all disks and is incremented in intervals of , where we wait at least simulation time steps between increments to ensure that the flow has reached a steady state. On each drive increment, we measure the species-dependent disk velocities, and , where is the instantaneous velocity of disk . We generate species-dependent histograms of , the distribution of velocities of the individual disks in the direction of applied drive, by first allowing the system to reach a steady state and then sampling the velocities every simulation time steps. The corresponding is Gaussian distributed about since the motion of the disks perpendicular to the driving force is unbiased. We also characterize the dynamic phases and phase transitions using velocity-force curves, the transverse root mean square displacements, and other measures of the particle spacing and density.
III Minimally Phase Separating System with
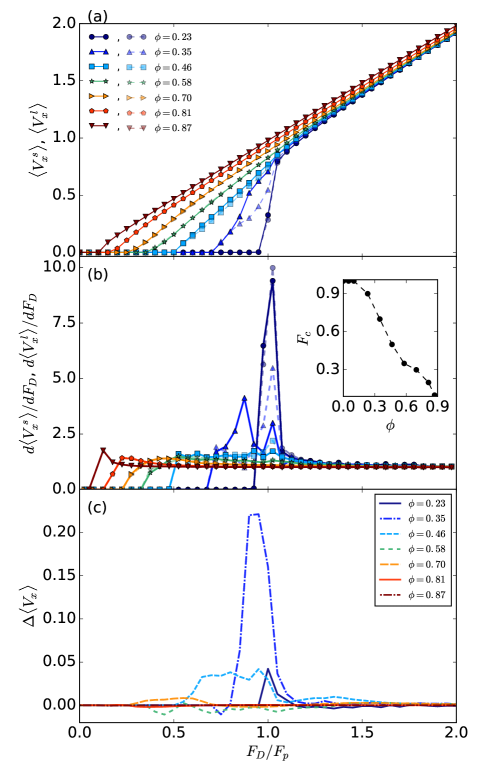
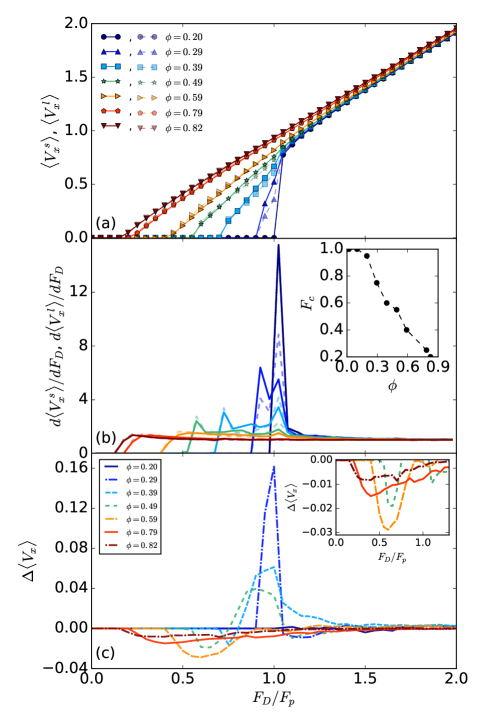
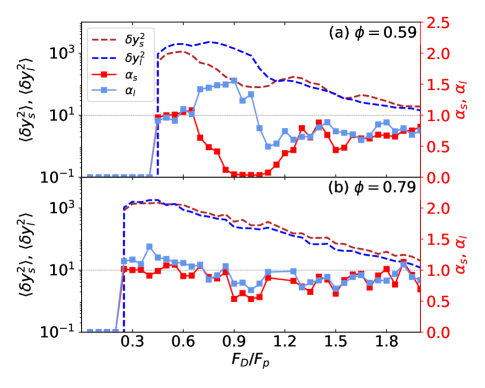
We first consider samples with and a disk diameter ratio of . By varying the disk density from to , we obtain a ratio of pinning sites to disks in the range to . At there is one disk for every pin, . In Fig. 1(a) we plot and versus for to 0.87, and we show the corresponding and versus curves in Fig. 1(b). For , the velocities increase linearly with drive for all values of . In the inset of Fig. 1(b) we plot the critical depinning force versus . When is low, since each disk can be captured independently by a pinning site. As the disk density increases, drops when the disks begin to interact with each other. Since each pin can capture at most one disk, if an unpinned disk comes into contact with a pinned disk, the driving force on both disks is offset by the pinning force on only one disk, lowering the depinning threshold. The number of disks in contact with each other increases with increasing , causing to decrease monotonically. We find no species dependence of at any value of . Figure 1(c) shows , the difference in net velocity between the two disk species. This difference is largest in magnitude near the depinning transition.
At a small disk density of in Fig. 1, both and show relatively sharp depinning transitions, as also indicated by the large single peak at depinning in the and versus curves. For drives close to but above , the smaller disks move slightly faster than the larger disks so that .
III.1 Intermediate Disk Densities
Disk-disk interactions become important at , where Fig. 1(b) shows that a two peak structure emerges in , with one peak at and a smaller second peak at . We also find that has a small peak at and a larger peak at . A positive peak in extends over the range and is larger in magnitude than what we observe at other values of .
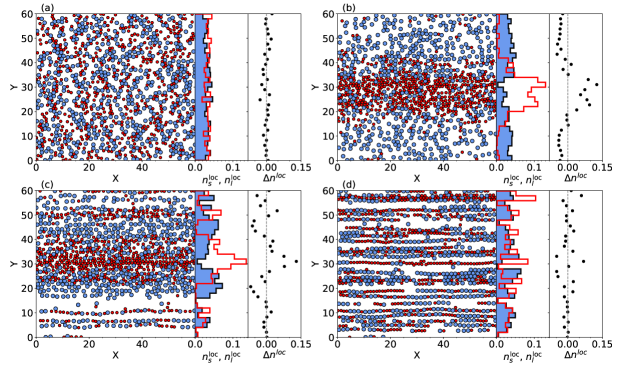
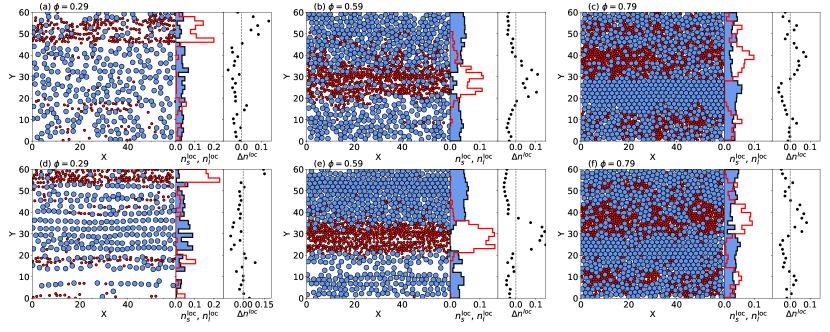
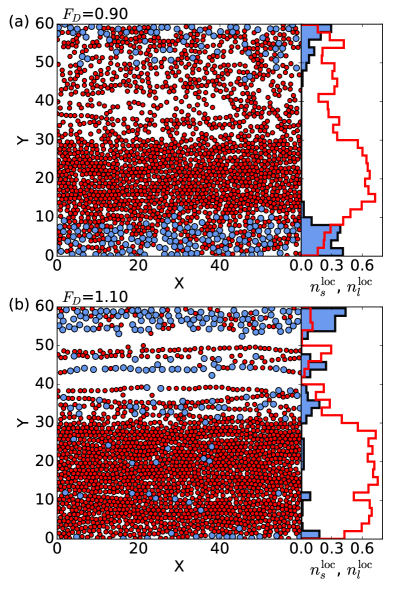
In the left panel of Fig. 2(a) we illustrate the disk positions in the pinned state for at . Here, small numbers of unpinned disks have accumulated behind pinned disks, giving a heterogeneous disk density and reducing the depinning threshold to . In some regions, short chains of disks composed preferentially of large disks are stabilized at an angle to the driving direction. In the center panel of Fig. 2(a) we plot the local number density and of large and small disks, respectively, obtained by taking slices of width through the sample at a fixed value of and dividing the number of disks of each type in that slice by the slice area. Thus, and . The difference in local number density, , is shown as a function of in the rightmost panel of Fig. 2(a). Below the depinning transition, both disk species are distributed uniformly throughout the sample.
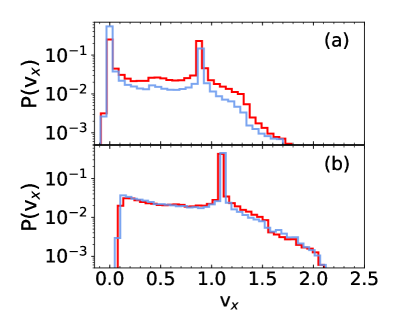
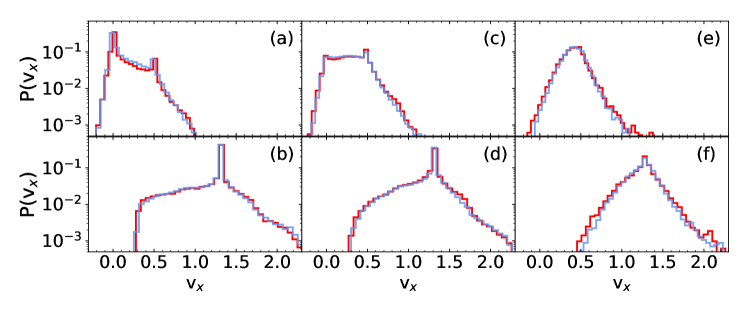
Figure 1(c) shows that for at , the velocity of the small disks is larger than that of the large disks, giving . At this drive the sample develops a horizontal band containing a high local density of small disks moving through a homogeneous distribution of large disks, as illustrated in Fig. 2(b). The peak in at coincides with the emergence of the dense band of small disks in the region . At the value of is nearly zero, but in the rest of the sample is roughly constant. The small disks flow continuously while the large disks undergo stick-slip motion that is enhanced in the vicinity of the band of small disks, as shown in the supplementary video supp3b . The species-dependent velocity distributions in Fig. 3(a) show that is bimodal for each species, with peaks at and arising from the alternating pinned and freely flowing motion of each disk. The peak is higher for the small disks than for the large disks since the small disks are more likely to move freely due to their separation into a dense band, and similarly the peak at is highest for the large disks, which are more likely to fall into a pinning site due to their greater radius. Strong interactions with the pinning sites are required to produce the peak. Although falls off rapidly above , there is still a tail with finite weight at produced by disks that undergo brief rapid motion just after escaping from a pinning site.
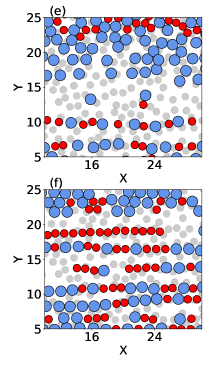
In Fig. 2(c) at , the band of small disks in the system becomes more diffuse. Simultaneously, the large disks segregate into dense bands surrounding the original band of small disks, while the lower density portion of the sample develops smectic ordering consisting of chains of mixed disk sizes that are oriented with the driving direction. We find in Fig. 1(c) that is slightly larger than at this drive since the higher density band of small disks is able to move more efficiently over the pinning sites, as illustrated in the supplemental video supp3c . Figure 2(e) shows a more detailed plot of the disk positions along with the pinning site locations in a portion of the sample from Fig. 2(c) containing both the dense band of large disks and the smectic chains. The disk species are not segregated within the chains, and since the pinning force and driving force are nearly equal, the disks do not experience much transverse displacement as they traverse the pinning sites. In the smectic state, has a single peak at with equal weight for both species, as shown in Fig. 3(b). Interactions of the disks with the pins in the lower density portions of the sample produce a broad plateau in over the range . Since , the pinning sites can only slow the disks but cannot trap them, so there is no longer a peak at .
At higher drives for , the smectic ordering spreads throughout the entire sample, as shown in Figs. 2(d) at . The detailed view of the sample in Fig. 2(e) illustrates that the long chains of disks have greater species separation and reduced fluctuations in the direction compared to the chains which form at lower . The dynamics of this state are illustrated in the supplemental movie supp3d . Similar lane formation was observed for a low density of monodisperse disks driven over quenched disorder 22 , and is due in part to the fact that strong density modulations incur no energy penalty in systems with short range interactions. Although on average , indicating that the large scale species segregation found at lower drives is lost, we find that individual chains can be preferentially composed of a single species of disk. The velocity distributions are similar to those shown in Fig. 3(b) but have a sharper peak at .
The moving smectic state we observe differs from those predicted by theory34 ; 35 and observed in simulations N2 ; 36 ; 37 and experiments N1 to occur in driven systems with quenched disorder such as vortices in type-II superconductors confined to two dimensions. The short-range nature of the disk-disk interactions permits the emergence of extreme chaining behavior in which the disks are nearly in contact along the driving direction but are well-spaced in the transverse direction. In contrast, superconducting vortices strongly repel one another at short distances, and thus have a more even spacing in the directions parallel and transverse to the drive. Adjacent vortex rows in the smectic state contain dislocations that can glide along the driving direction and permit the rows to slide past one another. For the disk system, adjacent rows are noninteracting and can move completely independently of each other.
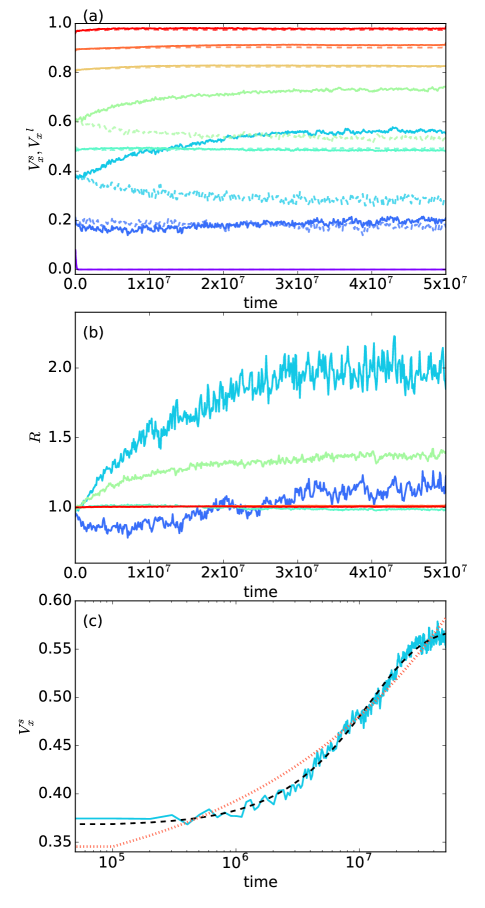
In Fig. 4 we illustrate the time-dependent behavior of the system. We find similar behavior when . Figure 4(a) shows the instantaneous values of and versus time at driving forces ranging from to . In Fig. 4(b), we show the corresponding ratio versus time. At , the disks are pinned, and except for a brief sharp decay at very early times from a nonzero value. At intermediate values of 0.75, 0.8, and 0.85, we find large fluctuations in both and , and although the velocities of the two disk species are initially identical, as the system evolves the velocities separate so that at long times . At , where the small disks first segregate into a band, we can fit the velocity of the small disks to a stretched exponential form, as shown in Fig. 4(c) where we find with . For comparison, we show a fit to with , which gives a poorer fit. We find a similar stretched exponential behavior at , and we show in Sec. III.C that this behavior is associated with enhanced transverse diffusion. The stretched exponential time response suggests that the formation of the segregated band of small disks is similar to an absorbing phase transition of the type found in clogging systems Peter2017 . For , 1.05, and , a stretched exponential fit gives a large time constant , and we show in Sec. III.C that these drives produce superdiffusion in the transverse direction. At higher driving forces , the sample quickly reaches a steady flow state with constant and .
III.2 High Disk Density
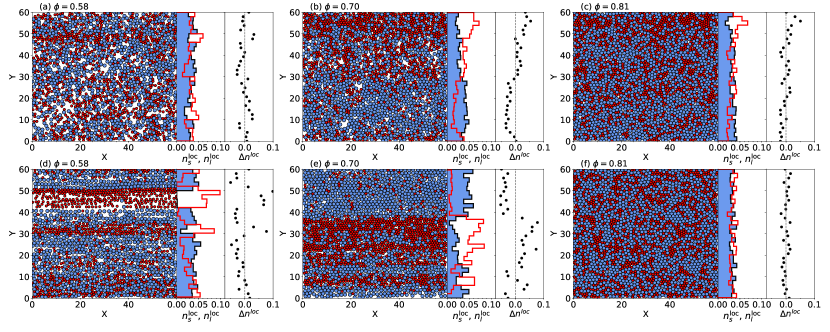
When , the effect of interstitial or unpinned disks on the depinning process becomes more important, and the depinning threshold drops to , as shown in Fig. 1. The peak in and at depinning is diminished in size, and we find that over the range . At , illustrated in Fig. 5(a), and both types of disks are in a gas-like state containing small regions of higher disk density in the form of clumps and chains. For this drive, the plots of and in Fig. 5(a) show that each disk species is uniformly distributed across the sample. The corresponding velocity histogram in Fig. 6(a) shows a bimodal distribution produced by the stick-slip motion of the disks, which are interacting strongly with the pinning sites. The peak is higher than the peak, indicating that the disks spend more time sticking and less time slipping, giving a low value of in Fig. 1(a). At in Fig. 5(d), where we again have , the disks phase segregate into a liquid region surrounding a smectic region, which extends from . The smectic state is characterized by strongly asymmetric spacing of the disks, which are much closer together parallel to the drive than perpendicular to the drive. In this case, the smectic region contains mostly small disks and is of relatively low density. The density of the liquid region varies as a function of , and the liquid is composed mainly of large disks separated by horizontal gaps for , while a densely packed liquid containing nearly equal numbers of small and large disks appears for . The large disks are almost completely depleted in the regions and but have a nearly uniform density in the rest of the sample, as shown by the plot of in Fig. 5(d). In Fig. 6(b), has a single peak at and a broad distribution of velocities in the range , including a low velocity plateau.
For higher disk densities of to 0.87, continues to decrease with increasing while becomes small. The increased disk-disk interactions that occur at the higher densities not only diminish the depinning force, but also equalize the velocities of each disk species due to the higher frequency of disk-disk collisions. In Fig. 5(b), we show a sample at , where the disks are in a liquid state containing some small localized clumps and chains. There is some species segregation, with the small disks preferentially located at the top of the sample and the large disks preferentially residing in the bottom of the sample, as indicated by the plots of and in Fig. 5(b). We find a bimodal distribution of as shown in Fig. 6(c), but the two peaks are barely higher than the background plateau since the increased disk-disk interactions reduce the effectiveness of the pinning sites. The same sample at develops polycrystalline structure in which the disks form wide species separated bands, as illustrated in Fig. 5(e). The polycrystalline clusters tend to be aligned in the driving direction. Figure 6(d) shows a single peak in at along with a broad distribution of velocities over the range . The plateau at low has vanished since all of the disks are always moving at this drive, and it is replaced by a rapid decrease in with decreasing .
At , Fig. 5(c) shows that when , the disks have a combination of liquidlike and polycrystalline structure. Although the plot of indicates that there is a local increase of small disk density near , the disks are nearly jammed, and as a result further species segregation is suppressed. In Fig. 6(e), has lost its distinct peaks and has a much more Gaussian shape, since the strong interactions between the disks prevent individual disks from being trapped by the pins. At for the same sample in Fig. 5(f), the disk structure is nearly the same except that any slight tendency for segregation into a band has been destroyed. The plot of in Fig. 6(e) shows a spread of velocities about due to the tightly packed motion of the disks.
For densities of and above, the disks have a glassy arrangement at both low and high drives, and the high packing fraction inhibits rearrangements of the disks, preventing both species segregation and the realignment of the polycrystalline regions with the driving direction. We have tested the system for finite size effects using a larger sample with , where we found structures similar to those illustrated in Figs. 2 and 5. The only difference is that the large system can accommodate multiple layers of segregated bands along the direction.
III.3 Transverse Diffusion and Topological Order
To further distinguish the phase behavior of each disk species, we measure the disk displacements in the direction transverse to the applied drive,
| (2) |
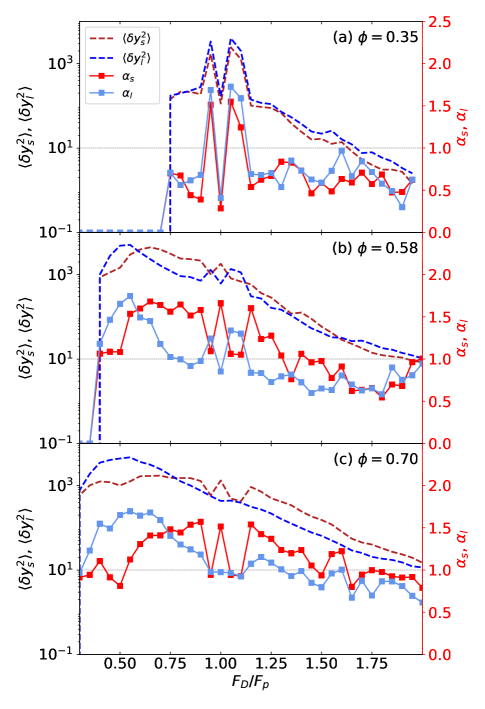
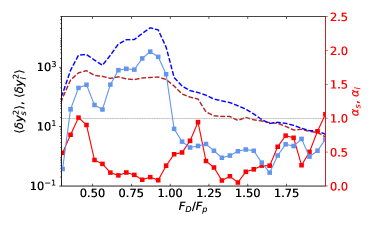
for the small and large disks, respectively. In Fig. 7 we plot and obtained over the time interval to simulation time steps versus for samples with , 0.58, and 0.7. We also show the corresponding diffusive exponents and obtained from long-time fits to . At all densities, and for when the disks are motionless. Previous studies of monodisperse disks showed superdiffusive transverse flow with in regimes where density phase separation occurred, since the increased frequency of disk-disk interactions in the high density region produces a greater amount of disk motion transverse to the driving direction 22 . The bidisperse disks have a more complex behavior since a wider variety of phase separated states occur that extend down to lower densities. In particular, the large and small disks generally exhibit different transverse diffusive behavior in the species separated regimes.
In Fig. 7(a) at , both disk species undergo subdiffusive transverse motion with when . Transverse movement is suppressed at low disk density due to the infrequency of disk-disk collisions. Near , we find large fluctuations of and due to the gradual emergence of the dense species separated bands illustrated in Fig. 2(b,c). At and 1.0, the dense liquid band of small disks is surrounded by a homogeneous low density gas of large disks, and we find subdiffusive behavior with . Superdiffusive behavior with appears at where the small disks have more fully segregated into a distinct horizontal band, and also at and 1.1 where the small disks form a smectic low density state containing horizontal chains. Similar fluctuations in appear near for , where some samples reach a steady phase segregated, particle separated state within time steps while others do not.
In Fig. 7(b) at we find diffusive transverse motion with whenever the disk density is homogeneous, including near depinning and for driving forces at which densely packed polycrystalline regions appear. For drives just above depinning, both types of disk undergo superdiffusive transverse motion as the species separation illustrated in Fig. 5(a) occurs. The large disks transition to diffusive behavior at , while the small disks remain superdiffusive until . Above , the driving force dominates the disk motion and the transverse displacements are subdiffusive for both species. In Fig. 7(c) at , the transverse motion is diffusive at depinning when . The large disks are superdiffusive in the range , and become diffusive at higher drives. The small disks are diffusive for , superdiffusive for , and diffusive above . A similar intermediate superdiffusive phase was observed in Ref. 40 . When the disk density is high, we find a transition from diffusive to subdiffusive behavior coinciding with the emergence of a locked polycrystalline phase. For example, at , for all . At , since the disks are kinetically trapped.
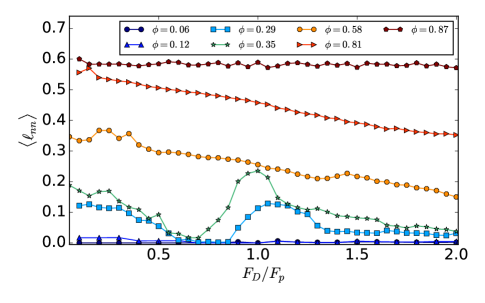
To characterize lane formation, we measure , the average perpendicular distance between disks that are in contact, given by
| (3) |
where . In Fig. 8 we plot versus for to . For small disk densities in the range to 0.12, almost no disks are in contact with each other and is nearly zero. For higher disk densities, in the pinned state the disks tend to form blockages perpendicular to the drive that become more extensive as increases, giving larger values of . As the depinning threshold is approached, these blockages fall apart, so that decreases monotonically over the range . For and , just below depinning where nearly all disk-disk contacts are lost, followed by a peak in near , where phase segregation into low and high density regions occurs. When chain structures form at higher , plateaus to a small but finite value. At and , decreases steadily for , where and 0.2, respectively. At , which is near the jamming limit, for all drives.
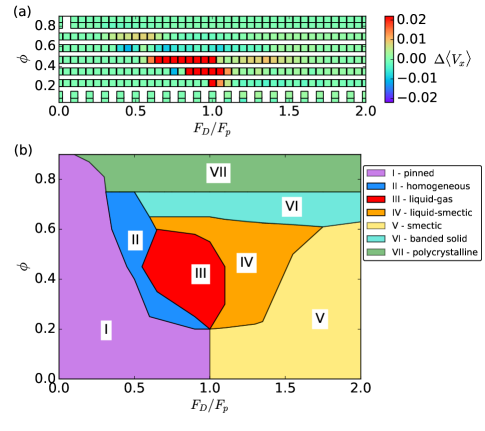
In Fig. 9 we show a heightfield plot of the data from Fig. 1(c) as a function of disk density versus driving force for the system, while in Fig. 9(b) we present a schematic dynamic phase diagram as a function of vs . Phase I is the clogged or pinned state illustrated in Fig. 2(a). Phase II, consisting of homogeneous plastic flow, is shown in Fig. 5(a,b). Phase III is the density phase separated liquid/gas state from Fig. 2(b). Phase IV, a density phase separated liquid/smectic state, is illustrated in Figs. 2(c) and Fig. 5(d). Phase V is the moving smectic/chain state from Fig. 2(d). Phase IV, the moving banded solid, appears in Fig. 5(e), and phase VII is the moving polycrystalline state shown in Fig. 5(c) and (f). Except for phase IV, we do not distinguish fractionation by species within the phases. We note that the liquid-gas phase separation observed for monodisperse disks in Ref. 22 is different in character from what we find here. It occurs at higher disk densities of to and is associated with the formation of close-packed clusters of disks.
The boundary between the pinned phase I and the moving phases II, V, or VII is determined by the critical depinning force plotted in Fig. 1(b). At low , where the pins outnumber the disks, the system depins directly into the moving smectic phase V. As increases, disk-disk interactions become important and the homogeneous phase II flow appears above depinning. For intermediate , this is followed at higher by density separation into the liquid/gas phase III or the liquid/smectic phase IV, while at higher drives the density becomes uniform again and the smectic phase V emerges. At higher , the disks are too dense to undergo phase separation and the system transitions directly from the homogeneous phase II flow to the banded solid phase VI. For very large disk densities, the disks can no longer exchange neighbors, and the system depins into a moving polycrystalline phase VII.
IV Enhanced Crystallization and Banding with Larger Radius Ratio at
We next increase the radius ratio to , a value that is known to produce phase separation for disks driven out of equilibrium 25 ; 27 . We fix and consider disk densities in the range to , corresponding to to . Here a disk density of corresponds to a ratio .
The plot of and versus in Fig. 10(a) for the system at different values of has similar behavior to that shown in Fig. 1(a), with a pinned state at low drives, a non-linear velocity-force relation above depinning, and a linear dependence of velocity on drive for high . The corresponding and versus curves in Fig. 10(b), as well as the plot of versus in the inset of Fig. 10(b), are also similar to what was shown in Fig. 1(b). In Fig. 10(c), the plot of versus indicates a higher velocity of the small disks at low similar to that found in Fig. 1(c); however, at low driving forces and high , we find that the large disks have a higher velocity than the small disks, as highlighted in the inset of Fig. 10(c).
At the lowest density of in Fig. 10, the small and large disks both have the same behavior, and the depinning occurs sharply at , with a distinct transition from pinned to elastic flow. Since this system contains fewer disks than the system, the depinning transition is sharper, and the peak in and at is larger.
At , we find an enhancement in the velocity of the small disks near depinning since the large disks can easily be pinned by traps and other large disks, while the small disks slip through smaller apertures to form a segregated dense band, as illustrated in Fig. 11(a) at . Here the large disks are uniformly distributed through the sample, while the small disks are concentrated in a band extending from . This is the same type of segregation found in Fig. 2(b). In Fig. 10(b), peaks at , whereas peaks at , indicating that the smaller disks begin to flow freely at lower drives than the larger disks. Above , there is a transition to a liquid of small disks surrounded by a smectic state of large disks, as illustrated in Fig. 11(d) for . This is accompanied by a large positive peak in over the range , as shown in Fig. 10(c). The smectic chain structure of the large disks increases the number of disk-disk interactions and diminishes the effectiveness of the pinning for the large disks. The small disks tend to form chains at higher drives.
Near depinning at , we find a density phase segregated state containing distinct bands of high density liquid smectic regions and low density regions, similar to the structure illustrated in Fig. 2(b) and (e). There are two distinct peaks in and in Fig. 10(b) near where the small disks begin to move freely and where the motion of the large disks increases. In Fig. 10(c), over the range , indicating that the small disks can flow more easily in the liquid smectic region, which they preferentially occupy. At , there is a pronounced crossover in in Fig. 10(c) from a negative value for to a positive value for , indicating that the large disks are moving faster than the small disks at lower drives but slower at higher drives.
For , is never positive but has an enhanced negative region at low drives above depinning in the range , as highlighted in the inset of Fig. 10(c). Species segregation of the disks occurs in the window . As illustrated in Fig. 11(b) for , the large disks form a cluster that spans nearly the entire system, while the small disks are concentrated in a band ranging from . The small disks form relatively few disk-disk contacts, making them less likely to be depinned due to disk-disk interactions, and thus reducing their velocity compared to the large disks. At higher drives, all of the disks depin and the difference in velocity among the two disk species drops to zero. At , shown in Fig. 11(e), the small disks remain in a single high density band while the large disks form a low density smectic state at coexisting with a high density liquid state containing polycrystalline regions at . A low density void region appears at . The motion of the particles in this state is illustrated in the Supplementary Material supp11b.
When , and have a smooth rather than sharp increase at . There is an extended regime in which the velocity of the large disks is higher than that of the small disks, with over the range for the system. As shown in Fig. 11(c) for at , a significant fraction of the large disks form tight polycrystalline packings while the small disks form trapped clusters over specific horizontal windows. The structure remains similar at higher drives, as shown in Fig. 11(e) at . For larger systems with at high , we find multiple large polycrystalline regions rather than a single band spanning the system.
IV.1 Transverse Diffusion and Topological Order
In Fig. 12, we plot the transverse diffusion and along with the exponents and versus for the system from Fig. 10. At in Fig. 12(a), we find homogeneous flow with at low driving forces of , indicating diffusive behavior. At intermediate driving forces, , the small disks are subdiffusive since they have become confined in a horizontal band, as shown in Fig. 11(b) and (d). The large disks are superdiffusive for , and become subdiffusive at higher drives once their structure changes from a homogeneous liquid with small voids to a denser liquid containing a large horizontal gap. The small voids permit a transverse flow of the large disks that is suppressed once a large void opens at higher drives. For , the driving force dominates the behavior of both disk species, which form chain states that move subdiffusively in the transverse direction. At in Fig. 12(b), at all driving forces above depinning, indicating diffusive transverse flow for both disk species. This is expected in a liquid phase containing polycrystalline regions of homogeneous density.
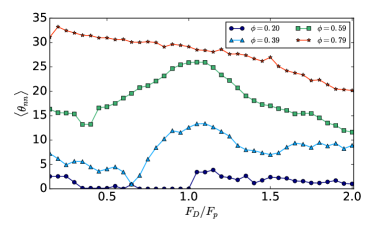
In Fig. 13, we characterize the lane structure of the disks based on the average angle between disks that are in contact,
| (4) |
sampled every simulation time steps after the system has reached a steady state. This measure is closely related to from Fig. 8. Figure 13 shows versus for systems with , 0.39, 0.59, and 0.79. For , is low for all drives due to the smectic structure which favors disk-disk contacts that are aligned with the direction. We find near depinning for , since the polycrystalline disk arrangements tend to contain crystallites aligned with the axis that contribute angles of 0∘ and equally to the sum. As the driving force increases, decreases monotonically due to an increase in the amount of smectic or chainlike ordering in the system. For and , a local maximum in at is produced by the denser structures that form when the phase separation is maximized for nearly equal pinning and driving strengths. This is followed by a decrease in at higher drives as smectic ordering emerges.
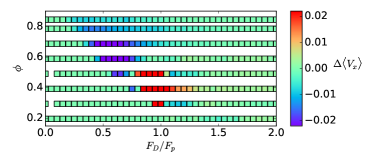
In Fig. 14, we show a heightfield plot of as a function of versus for the system. Compared to the system in Fig. 9, we find a much larger region in which . This indicates that increasing the relative size of the large disks can also increase their velocity relative to the small disks when the driving force is close to the depinning threshold and the total disk density is sufficiently large.
V Lower fraction of large disks,
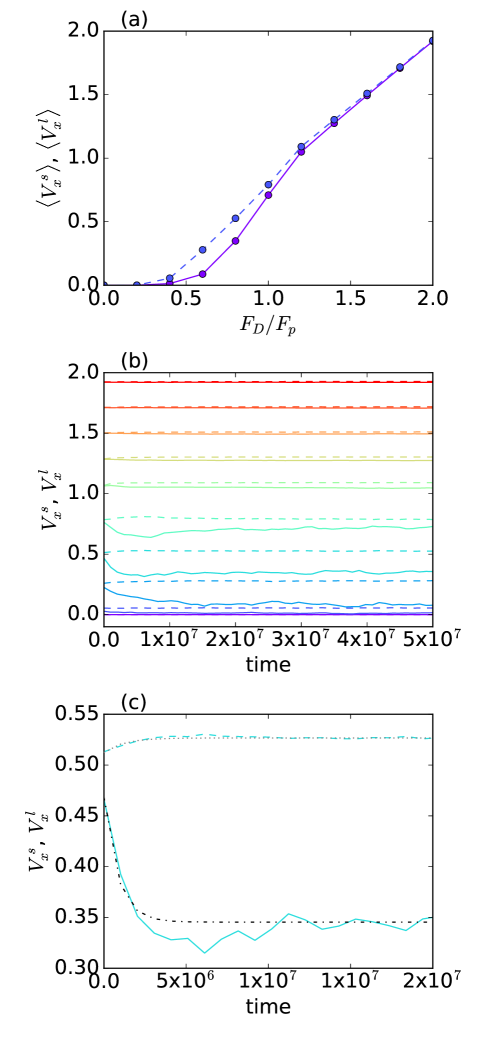
We next investigate the effect of changing the disk species ratio from to and for a system with . We find the same general phases as described in Sec. III but with a greater tendency for the large disks to move faster than the small disks. In Fig. 15(a), we plot and versus for the system at a disk density of . We find plastic depinning for both disk species, as indicated by the concave shape of the velocity-force curve, followed by a transition at higher drives to a linear dependence. At , illustrated in Fig. 16(a), the system can be divided into three regions: a small disk liquid, a small disk gas, and a mixed gas-like region containing both disk species at an intermediate density. At a higher drive of in Fig. 16(b), the small disk liquid has increased in density and contains a few large disks. A window of large disk liquid containing some small disks runs along one side of the small disk liquid, while the low density region of the sample contains roughly equal numbers of small and large disks arranged in a smectic structure. Due to the strong species segregation, these phases resemble the states found for monodisperse disks in Ref. 22 . Over the range where the species separation occurs, , giving (not shown).
In Fig. 15(b), we plot the time evolution of and for the same system at values ranging from to . For , the system is pinned and . When , we find , with remaining nearly constant over time while decays. For intermediate driving forces of , the curves have an exponential shape, , as shown in Fig. 15(c) for , where . A similar fit of at the same drive gives a time constant that is somewhat larger. As increases above , the system rapidly reaches a steady state and the difference between the velocity of the small and large disks vanishes. Due to the lengthy transient dynamics at intermediate , we wait a minimum of simulation time steps before measuring the velocity-force curves shown in Fig. 15(a).
In Fig. 17 we plot the transverse displacements and versus for the sample along with the corresponding exponents and . All four quantities increase monotonically between and . At intermediate , we find subdiffusive transverse motion of the small disks with accompanied by superdiffusive transverse motion of the large disks with . Here the small disks are confined within a dense liquid, while the large disks are in a low density region in which interactions with pinning sites can enhance the transverse diffusion. At large where smectic structures emerge, both disk species have subdiffusive transverse motion.
VI Scaling Near The Depinning Transition
In systems of particles that have long range interactions, the velocity-force relationship scales as 1 . For elastic depinning in which the structure of the particle lattice remains unchanged, , while when the depinning transition is plastic, . For Coulomb 6 and screened Coulomb 14 ; 33 interaction potentials, the plastic depinning exponents are and , respectively, while simulations of depinning of superconducting vortices with a Bessel function vortex-vortex interaction give 33 . It is interesting to ask whether similar scaling of the velocity-force curves occurs in the disk system. For monodisperse disks with , it was shown in Ref. 22 that the velocity-force curves can be fit to a power law with .
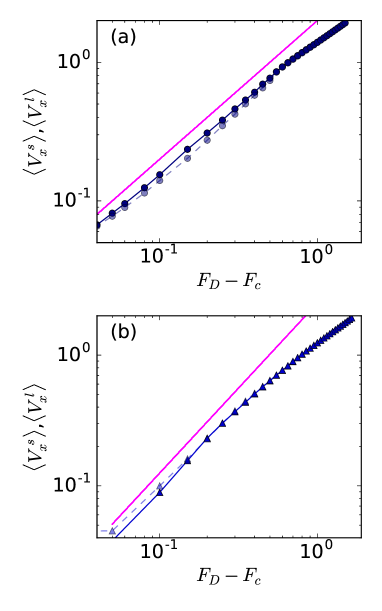
In Fig. 18(a,b) we plot and versus on a log-log scale at densities of and 0.58, respectively. By fitting the portion of the curve closest to depinning, we find . The scaling fit can be performed only for and does not work at low disk densities. We find similar scaling fits for sufficiently large disk densities for the system and for the and system. The depinning is clearly not elastic, but the lower values of compared to systems with longer range interactions suggest that the type of plastic depinning that occurs may be different for short range interacting systems than for longer range interacting systems.
VII Summary
We examine the dynamics of bidisperse disks driven over random quenched disorder to explore the dynamical phases of particles with short range interaction forces. At low disk densities, we observe a pinned state that transitions into a strongly chained state where the disks can undergo local demixing but where the overall disk distribution is homogeneous. At intermediate disk densities, the disks depin into a disordered flow state exhibiting stick slip dynamics, followed by a species segregated state in which the small disks form clusters and the large disks remain evenly distributed throughout the sample. For intermediate drives the disks form a partially laned state exhibiting both species separation and density segregation, while at high drives a mixed laning state emerges. At high disk densities of , a rigid polycrystalline state appears that moves as a solid and undergoes no species or density segregation. Both the density and the species segregation effects are the most prominent near when the driving force and pinning force directly compete. The anisotropic fluctuations induced by the pinning at high drives favor the formation of laned states. It is also possible to induce mixing between the two species just above the depinning transition. By increasing the radius of the large disks compared to that of the small disks, we find a larger amount of crystallization and banding of the large disks, while the small disks tend to form an interstitial liquid. Lowering the fraction of large disks compared to the fraction of small disks tends to increase the velocity of the large disks compared to that of the small disks, which species separate into a disordered liquid that flows unevenly over the pinning sites. When the disk density is sufficiently large, we find scaling of the velocity-force curves near the plastic depinning transition with an exponent that is slightly smaller than what is observed in systems with longer range interparticle interactions, suggesting that the plastic depinning transition may have distinct features when the interaction range is very short.
Our results could be relevant to multi-species flows of soft matter through random substrates or the flow of granular matter over a disordered background. It would be interesting to explore possible segregation effects for bidisperse systems with long range particle-particle interactions driven over random disorder. In the disk system, the segregation of particles into clumps reduces the number of disk-disk collisions and enhances the disk flow.
Acknowledgements.
This work was carried out under the auspices of the NNSA of the U.S. DoE at LANL under Contract No. DE-AC52-06NA25396. This research was supported in part by the University of Notre Dame Center for Research Computing and the Wabash College Computational Chemistry Cluster.References
- (1) C. Reichhardt and C.J.O. Reichhardt, Depinning and nonequilibrium dynamic phases of particle assemblies driven over random and ordered substrates: a review, Rep. Prog. Phys. 80, 026501 (2017).
- (2) S. Bhattacharya and M. J. Higgins, Dynamics of a disordered flux line lattice, Phys. Rev. Lett. 70, 2617 (1993).
- (3) A. E. Koshelev and V. M. Vinokur, Dynamic melting of the vortex lattice, Phys. Rev. Lett. 73, 3580 (1994).
- (4) M. C. Faleski, M. C. Marchetti, and A. A. Middleton, Vortex dynamics and defects in simulated flux flow, Phys. Rev. B 54, 12427 (1996).
- (5) F. Pardo, F. de la Cruz, P.L. Gammel, E. Bucher, and D.J. Bishop, Observation of smectic and moving-Bragg-glass phases in flowing vortex lattices, Nature (London) 396, 348 (1998).
- (6) C.J. Olson, C. Reichhardt, and F. Nori, Nonequilibrium dynamic phase diagram for vortex lattices, Phys. Rev. Lett. 81, 3757 (1998).
- (7) M.-C. Cha and H. A. Fertig, Topological defects, orientational order, and depinning of the electron solid in a random potential, Phys. Rev. B 50, 14368 (1994).
- (8) C. Reichhardt, C. J. Olson, N. Grønbech-Jensen, and F. Nori, Moving Wigner glasses and smectics: Dynamics of disordered Wigner crystals, Phys. Rev. Lett. 86, 4354 (2001).
- (9) T. Schulz, R. Ritz, A. Bauer, M. Halder, M. Wagner, C. Franz, C. Pfleiderer, K. Everschor, M. Garst, and A. Rosch, Emergent electrodynamics of skyrmions in a chiral magnet, Nature Phys. 8, 301 (2012).
- (10) C. Reichhardt, D. Ray, and C. J. Olson Reichhardt, Collective transport properties of driven skyrmions with random disorder, Phys. Rev. Lett. 114, 217202 (2015).
- (11) W. Koshibae and N. Nagaosa, Theory of current-driven skyrmions in disordered magnets, Sci. Rep. 8, 6328 (2018).
- (12) C. Reichhardt, C.J.O. Reichhardt, I. Martin, and A.R. Bishop, Dynamical ordering of driven stripe phases in quenched disorder, Phys. Rev. Lett. 90, 026401 (2003).
- (13) H.J. Zhao, V.R. Misko, and F. M. Peeters, Dynamics of self-organized driven particles with competing range interaction, Phys. Rev. E 88, 022914 (2013).
- (14) J. Hu and R.M. Westervelt, Collective transport in two-dimensional magnetic bubble arrays, Phys. Rev. B 51, 17279(R) (1995).
- (15) C. Reichhardt and C. J. Olson, Colloidal dynamics on disordered substrates, Phys. Rev. Lett. 89, 078301 (2002).
- (16) A. Pertsinidis and X.S. Ling, Statics and dynamics of 2D colloidal crystals in a random pinning potential, Phys. Rev. Lett. 100, 028303 (2008).
- (17) S. Deutschländer, T. Horn, H. Löwen, G. Maret, and P. Keim, Two-dimensional melting under quenched disorder, Phys. Rev. Lett. 111, 098301 (2013).
- (18) Y.G. Cao, Q.X. Li, G.Y. Fu, J. Liu, H.Z. Guo, X. Hu, and X.J. Li, Depinning dynamics of two-dimensional magnetized colloids on a random substrate, J. Phys.: Condens. Matter 22, 155101 (2010).
- (19) P. Tierno, Depinning and collective dynamics of magnetically driven colloidal monolayers, Phys. Rev. Lett. 109, 198304 (2012).
- (20) C. Bechinger, R. Di Leonardo, H. Löwen, C. Reichhardt, G. Volpe, and G. Volpe, Active Brownian particles in complex and crowded environments, Rev. Mod. Phys. 88, 045006 (2016).
- (21) A. Morin, N. Desreumaux, J.-B. Caussin, and D. Bartolo, Distortion and destruction of colloidal flocks in disordered environments, Nat. Phys. 13, 63 (2017).
- (22) Cs. Sándor, A. Libál, C. Reichhardt, and C.J.O. Reichhardt, Dynamic phases of active matter systems with quenched disorder, Phys. Rev. E 95, 032606 (2017).
- (23) Y. Yang, D. McDermott, C.J.O. Reichhardt, and C. Reichhardt, Dynamic phases, clustering, and lane formation for driven disk systems in the presence of quenched disorder, Phys. Rev. E 95, 042902 (2017).
- (24) C. Reichhardt and C.J.O. Reichhardt, Aspects of jamming in two-dimensional athermal frictionless systems, Soft Matter 10, 2932 (2014).
- (25) C.S. O’Hern, L.E. Silbert, A.J. Liu, and S. R. Nagel, Jamming at zero temperature and zero applied stress: The epitome of disorder, Phys. Rev. E 68, 011306 (2003).
- (26) K.M. Hill and J. Kakalios, Reversible axial segregation of binary mixtures of granular materials, Phys. Rev. E 49, R3610(R), (1994).
- (27) S.B. Santra, S. Schwarzer, and H. Herrmann, Fluid-induced particle-size segregation in sheared granular assemblies, Phys. Rev. E 54, 5066 (1996).
- (28) A. Samadani, and A. Kudrolli, Segregation transitions in wet granular matter, Phys. Rev. Lett. 85, 5102 (2000).
- (29) S.J. Fiedor, and J.M. Ottino, Dynamics of axial segregation and coarsening of dry granular materials and slurries in circular and square tubes, Phys. Rev. Lett. 91, 244301 (2003).
- (30) J. Dzubiella, G.P. Hoffmann, and H. Löwen, Lane formation in colloidal mixtures driven by an external field, Phys. Rev. E 65, 021402 (2002).
- (31) I.S. Santos de Oliveira, W.K. den Otter, and W. J. Briels, Alignment and segregation of bidisperse colloids in a shear-thinning viscoelastic fluid under shear flow, Eur. Phys. Lett. 101, 2802 (2013).
- (32) C. Reichhardt, and C.J.O. Reichhardt, Velocity force curves, laning, and jamming for oppositely driven disk systems, Soft Matter 14, 490 (2018).
- (33) C.J.O. Reichhardt, E. Groopman, Z. Nussinov, and C. Reichhardt, Jamming in systems with quenched disorder, Phys. Rev. E 86, 061301 (2012).
- (34) See video Fig3b.mp4 for the disk dynamics at and .
- (35) See video Fig3c.mp4 for the disk dynamics at and .
- (36) See video Fig3d.mp4 for the disk dynamics at and .
- (37) H. Peter, A. Libal, C. Reichhardt, and C.J.O. Reichhardt, Crossover from jamming to clogging behaviors in heterogeneous environments, Sci. Rep. 8, 10252 (2018).
- (38) P. Le Doussal and T. Giamarchi, Moving glass theory of driven lattices with disorder, Phys. Rev. B 57, 11356 (1998).
- (39) L. Balents, M.C. Marchetti, and L. Radzihovsky, Nonequilibrium steady states of driven periodic media, Phys. Rev. B 57, 7705 (1998).
- (40) K. Moon, R. T. Scalettar, and G. T. Zimányi, Dynamical phases of driven vortex systems, Phys. Rev. Lett. 77, 2778 (1996).
- (41) A. Kolton, D. Domínguez, and N. Grønbech-Jensen, Hall noise and transverse freezing in driven vortex lattices, Phys. Rev. Lett. 83, 3061 (1999).
- (42) C. Heussinger, L. Berthier, and J.-L. Barrat, Superdiffusive, heterogeneous, and collective particle motion near the fluid-solid transition in athermal disordered materials, EPL 90, 20005 (2010).
- (43) Y. Fily, E. Olive, N. Di Scala, and J. C. Soret, Critical behavior of plastic depinning of vortex lattices in two dimensions: Molecular dynamics simulations, Phys. Rev. B 82, 134519 (2010).