LSTM knowledge transfer for HRV-based sleep staging
Abstract
Automated sleep stage classification using heart rate variability (HRV) is an active field of research. In this work limitations of the current state-of-the-art are addressed through the use of deep learning techniques and their efficacy is demonstrated. First, a temporal model is proposed for the inference of sleep stages from electrocardiography (ECG) using a deep long- and short-term memory (LSTM) classifier and it is shown that this model outperforms previous approaches which were often limited to non-temporal or Markovian classifiers on a comprehensive benchmark data set (292 participants, 541214 samples) comprising a wide range of ages and pathological profiles, achieving a Cohen’s of and accuracy of annotated according to the Rechtschaffen and Kales (R&K) annotation standard.
Subsequently, it is demonstrated how knowledge learned on this large benchmark data set can be re-used through transfer learning for the classification of photoplethysmography (PPG) data. This is done using a smaller data set (60 participants, 91479 samples) that is annotated with the more recent American Association of Sleep Medicine (AASM) annotation standard, achieving a Cohen’s of and accuracy of for wrist-mounted PPG-based sleep stage classification, higher than any previously reported performance using this sensor modality. This demonstrates the feasibility of knowledge transfer in sleep staging to adapt models for new sensor modalities as well as different annotation strategies.
Index Terms:
Recurrent Neural networks, Photoplethysmography, Signal Processing Algorithms, Wearable SensorsI Introduction
Sleep is a reversible state of disconnection from the external environment characterized by reduced vigilance and quiescence. It plays an essential role in the diurnal regulation of mind and body in mammals, and is hypothesized to have a wide array of functions ranging from digestion to memory consolidation. The objective measurement of sleep in adult humans involves sleep staging: the process of segmenting a sleep period into epochs, typically 30 seconds long, and assigning a sleep stage to each epoch. The AASM [1] distinguishes five sleep stages: rapid eye movement (REM) sleep, three levels of non-REM sleep (NREM1, NREM2, NREM3) and wake (W). Sleep staging is usually performed by visually scoring the electric activity in the brain, eye movement and chin muscles, measured respectively with electroencephalography (EEG), electrooculography (EOG) and electromyography (EMG). Together with sensors measuring cardiac and respiratory activity, this setup is collectively referred to as polysomnography (PSG).
Although it remains the gold-standard for clinical assessment of sleep and diagnosis of sleep disorders, PSG is practically limited to one or two measuring nights, and cannot be effectively performed at home for a prolonged period of time. With the increasing availability of inexpensive and robust physiological sensors, cardiac and respiration-based sleep stage classification have been actively researched over the last few years, as they might provide a highly unobtrusive and cost-efficient surrogate of PSG sleep scoring.
Cardiac sleep stage classification in particular makes uses of the well-known relation between sleep stages and autonomic nervous system (ANS) activity, usually measured with different HRV characteristics, or features. The inference of sleep stages is done by training machine learning algorithms which translate HRV features to sleep stages. Usually, a set of physiological features make up the feature space , with a marginal probability distribution . Together they form the domain of the sleep staging problem. The sleep stage label space then, in the simplified case of four-class sleep staging, comprises the labels (corresponding to Wake, combined N1 and N2, N3 and REM sleep) and the conditional distribution . Finally, the classification task is a combination of the label space distribution and the domain: . Models are trained with training sample pairs and for each 30 second segment of sleep (i.e. epoch).
I-A Cardiac features
Although HRV features can be derived from ECG, this is arguably not the most convenient sensor for prolonged monitoring at home. Sensors such as wrist-worn reflective PPG are more adequate for the purpose of long-term sleep monitoring, since they are more comfortable, and can be easily set up by the individuals under investigation. However, the use of these sensors outside the consumer domain remains limited and very few data sets exist with which sleep staging classifiers can be adequately trained. In particular for models with many free parameters the size of the training set is likely to play a crucial role. While a model can be trained on HRV features derived from readily-available ECG, it is likely to perform sub-optimally for PPG-derived HRV for three reasons: coverage is typically lower; beat localisation methods are slightly less accurate than their ECG counterparts; and the time delay between the heart contraction (ECG R-peak) and the arrival of the pulse at the wrist PPG, known as the pulse transit time, is not constant: it is continuously modulated through properties of the arterial vessels such as blood pressure and vasoconstriction [2], which change throughout the night [3].
This motivates the need to develop techniques that on the one hand can make use of larger data sets with ECG, while on the other can adapt to PPG. This is not only true for PPG, there are many other unobtrusive sensors for which such a methodology would yield better algorithms, such as ballistocardiography, galvanic skin response or stationary camera-based PPG.
I-B Sleep stage annotation
Visual sleep stage scoring with PSG is usually performed with a fixed set of rules and guidelines. The current standard is maintained by the AASM [1]. However, before 2007 the R&K [4] guidelines were the most commonly used, since its publication in 1968. The main difference is that the older standard distinguishes between 4 classes of non-REM sleep, namely S1, S2, S3 and S4 (where S3 and S4 have been merged by the AASM into a single stage, NREM3). Next to that, and over the last few years, additional refinements and rules were introduced in the AASM manual to improve the inter-rater agreement between expert annotators. These small changes have been shown to lead to different results. It was found that there was a structural increase in NREM1 and NREM3, while NREM2 prevalence decreased. For REM, there seemed to be an age-dependent difference in annotation, with less REM being scored in younger people [5]. Although the change in scoring guidelines aimed to improve the overall scoring quality, it created a disparity between the annotations in older and newer data sets. When re-scoring of large, older data sets is impractical or prohibitively expensive, they might be of limited use. This motivates the need for machine learning methods that can exploit the large similarity between R&K and AASM guidelines, while adapting sufficiently to the current standard and future changes.
I-C Machine learning algorithms
The most popular algorithms in sleep stage research, which we have also used in the past [6, 7], are feed-forward models in which is estimated, where and are respectively the label and features at time step . Given that sleep architecture has common temporal patterns throughout the night, this approach may not achieve optimal performance as it does not exploit the dependency between time steps. To this end, approaches such as Elman recurrent networks [8], hidden Markov models [9] and conditional random fields (CRF) [10] were proposed, in which the conditional distribution is made dependent on the previous time point: . These models strongly outperform earlier models, demonstrating the value of modeling temporal dependence in sleep stage classification [11]. Given this improvement in performance, these approaches motivate the investigation of better temporal models that can take into account more than only the last time step, especially since it was shown in earlier work [12] that transition probabilities of sleep stages in a Markov model are different for each sleep cycle, i.e. that changes throughout the night, violating the Markov assumption for the linear chains traditionally used, and emphasizing the need for a non-Markovian temporal model.
I-D Objectives
In this work a new methodology for automated cardiac sleep staging will be presented that can leverage the long-term contextual information in sleep, building upon recent advancements in LSTM algorithms and deep neural networks. Next to that, a transfer learning methodology will be evaluated for the adaptation from ECG to PPG features as well as from R&K to AASM annotations as a means to learn domain- and target- invariant knowledge from older, larger ECG data sets and re-use the knowledge to train an algorithm using PPG and the AASM standard using smaller, newer data sets.
II Materials and Methods
II-A Materials
II-A1 Siesta data set
The first data set used in this study was collected as part of the EU SIESTA project [13] in the period from 1997 to 2000 in seven European countries. The study was approved by the local ethical committee of each research group and all participants signed informed consent. Participants had no history of alcohol or drug use or worked shifts. The data set includes 195 healthy participants and 97 patients with a sleep or sleep-disturbing disorder (26 patients with insomnia, 51 with sleep apnea, 5 with periodic limb movement disorder and 15 with Parkinson’s disease) [13].
Each participant was monitored for a total of 15 days and at day 7 and 8 participants were invited to sleep in the sleep laboratory to collect overnight PSG. Each recording was scored by two trained somnologists from different sleep centers according to the R&K guidelines [4], and revised by a third expert who took the final decision in case of disagreement. More details regarding participants and study design were described in [13]. Table I indicates the participant demographics, and corresponding sleep statistics.
II-A2 Eindhoven data set
The second data set was collected in 2014 and 2015 in Eindhoven, the Netherlands, approved by the Internal Committee of Biomedical Experiments of Philips Research and conducted in accordance with the Declaration of Helsinki. All participants gave informed consent before participation. It includes 101 recordings of 60 healthy participants with no primary history of neurological, cardiovascular, psychiatric, pulmonary, endocrinological, or sleep disorders. In addition, none of the participants were using sleep, antidepressant or cardiovascular medication, recreational drugs or excessive amounts of alcohol.
Each of the participants underwent one or two nights of PSG measurements in a hotel, where in addition to the standard montage recommended by AASM for offline sleep scoring [1], a CE-marked logging device containing a PPG and a tri-axial accelerometer sensor (Royal Philips, Amsterdam, the Netherlands) was used. The logging device was mounted on the non-dominant wrist of the participant, with the sensor facing the skin on the dorsal side of the hand, above the ulnar styloid process. The PSG data was annotated by a trained sleep technician according to the AASM rules of sleep scoring [1]. More details regarding study design were described in [14]. Table I indicates the participant demographics, and sleep statistics for this data set.
| Siesta | Eindhoven | |||
| Parameter | Mean (SD) | Range | Mean (SD) | Range |
| N | 292 participants, 584 recordings | 60 participants, 101 recordings | ||
| Sex | 126 female participants (43.2%) | 26 female participants (43.3%) | ||
| 252 female recordings (43.2%) | 48 female recordings (47.5%) | |||
| Age (year) | ||||
| BMI (kg/m2) | ||||
| TIB (hour) | ||||
| SE (%) | ||||
| N1 (%) | ||||
| N2 (%) | ||||
| N3 (%) | ||||
| REM (%) | ||||
-
N1, N2, N3, and REM percentages were calculated over the total sleep time for each recording.
BMI: body mass index, TIB: time in bed, SE: sleep efficiency.
II-B Feature extraction
This study used a set of 135 HRV features extracted from inter-beat intervals (IBIs) computed from either ECG or PPG. All features were described in earlier work, [15, 11] and are only summarized here. To extract features from ECG, the signal was first high-pass filtered to remove baseline wander using a Kaiser window of 1.016 s, a cut-off frequency of 0.8 Hz and a side-lobe attenuation of 30 dB. QRS complexes were detected with a Hamilton-Tompkins QRS detector [16, 17] and further localized with a post-processing algorithm [18]. IBIs were then computed from the time difference between pairs of consecutive R-R peaks. To extract features from PPG, individual heart beats were first extracted from the pulsatile component of the PPG using the same algorithm as used by Papini et al. [19]. IBIs were then computed from the time difference between pairs of consecutive pulses.
From the resulting IBI time series, features describing HRV characteristics were computed using windows of 4.5 min centered on each 30 second epoch of the recording. The time domain features included the mean absolute distance, mean, median, 5th, 10th, 25th, 75th, 90th and 95th percentiles, percentage of successive IBIs longer than 50 ms, range, root mean square of successive IBI differences, standard deviation, and standard deviation of successive IBI differences, all calculated on the original and on the detrended [20] IBI and instant heart rate time series [20, 15]. The frequency-domain HRV features included the normalized PSD of a 4 Hz-interpolated IBI series in the very low frequency (VLF), low frequency (LF) and high frequency (HF), the LF-HF ratio, and the peak frequency and power in the HF band, using fixed [21] and adapted boundaries [22], and the maximum phase and module in the HF pole [9]. The HRV feature set further included the mean, median, minimum and maximum posterior probabilities of arousals given sequences of five consecutive beats on each 30 second epoch [23]. Detrended fluctuation analysis (DFA) was applied on the IBI time series to calculate the scaling exponent for faster, slower, and all time scales, [24, 25] and the scaling exponent was also computed using Peng’s method [26]. In addition, windowed [27] and progressive [28] DFA were computed. The multiscale sample entropy of IBI time series was calculated at length 1 and 2, and scales 1–10 over windows of 510 s [29] in addition to the sample entropy of symbolic binary changes in consecutive IBIs [30].
Furthermore, Teager energy was used to characterize transition points and local maxima in IBI series [31], including the mean energy, percentage of transition points and maxima, mean and standard deviation of intervals between transition points and maxima, mean and standard deviation of the amplitude of normalized IBIs at transition points and maxima, all calculated based on the IBI time series, and on the first intrinsic mode function after empirical mode decomposition [32].
To express the interaction between cardiac and respiratory autonomic activity, a cardiac-to-respiratory phase synchronization ratio was computed in terms of percentage of beats synchronized with a 6:2, 7:2, 8:2, 9:2 and the dominant ratio, short- and long-term coordination in terms of presence and duration of synchronized heart beats [33, 34] and Higuchi’s fractal dimension measure of phase coordination [35]. Finally, visibility graphs were used to model cardiorespiratory interaction in the IBI series, and used to calculate the assortativity mixing coefficient, the mean and standard deviation of the clustering coefficients and degrees, slope of the power-law fit to the degree distribution and percentage of nodes with a small and with a high degree, all computed based on the visibility and difference visibility graphs.
II-C Long- and short term memory network
In this work bi-directional multi-level LSTM networks [36] are proposed as solution to the temporal processing limitations of models commonly used for this task, as described in Section I-C. LSTMs consist of memory cells that can store long-term information from time series and generate an output based on the current time step input, their last output (short-term recurrence) and the internal cell state (long-term recurrence). The cell state is controlled through gating mechanisms. A detailed description and equations of LSTM cells are given in the original paper [36]. Stacking multiple layers of LSTM cells allows for the memorization of deeper temporal structures in the data. By having two LSTM stacks in parallel, one applied in the forward and another in the backward direction, it is possible to take into account both past and future data to classify each single time step [37]. The proposed architecture is a neural network consisting of three distinct blocks:
Domain layer
consists of perceptrons that make 32 linear combinations of features. The function of this layer is to pre-weight, pre-select and combine the input into a more compact representation of the domain
Temporal layer
consists of the LSTM stacks. These LSTMs take over all time steps and generate 128 new features at each time step, where temporal information has been taken into account through the short- and long-term recurrence properties both from the past and future. This results in yet another translation of the domain .
Decision layer
consists of two levels of perceptrons, of which the final level generates four sigmoid outputs representing the class probabilities , given at that time step. The outputs sum up to one for each classification through softmax normalization.
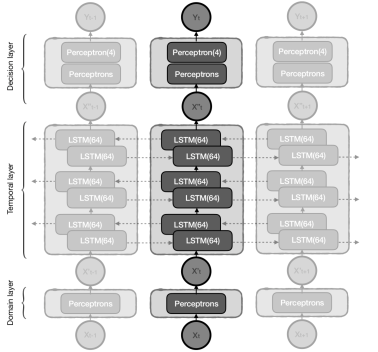
The complete model is illustrated in Figure 1. The free parameters of the model were trained simultaneously with the RMSprop optimizer,a variant of AdaDelta [38] introduced in a lecture series [39]. Dropout [40] on the input (20%), on LSTM outputs (50%) and recurrent connections (50%) was applied during training to reduce overfitting. Categorical cross-entropy was used as the loss function during model fitting.
II-D Model training
II-D1 Siesta model
The model will be initially trained and evaluated on the Siesta database using HRV derived from ECG (, where denotes Siesta), which will be named the Original model. This will be done using a 75-25% training-validation split of the complete Siesta data set which will allow an assessment of the overall performance of the LSTM architecture on a larger set of ECG-based HRV data.
While the model can be trained using , it is likely to not be optimal for PPG-derived HRV () data due to the differences between PPG and ECG (as explained in Section I-A). These differences are apparent in the Eindhoven data: the correlation between and (where denotes Eindhoven) is . In addition, Eindhoven data is annotated with the new AASM standard which might be a further source of performance degradation of the Original model (trained on R&K annotation), as described in Section I-B. The Original model will be evaluated on the Eindhoven data: using to show the performance difference due to annotation strategy, and to show the further difference due to the different sensor modality.
II-D2 Eindhoven model
An alternative approach is to directly train the model on and . However the model might reach a sub-optimal performance given the large amount of free parameters and the limited size of the Eindhoven data. This will be shown through 4-fold cross-validation on the Eindhoven data for both ECG and PPG.
II-D3 Transfer learning
To overcome the above issues, transfer learning is proposed, which involves transferring model knowledge to solve a new but related problem where less data samples are available. This technique has been proven effective in the context of deep neural networks, where knowledge is represented in a modular structure of layers and has been applied successfully in both computer vision [41] and natural language processing [42] networks. Transfer learning is practically achieved by retraining a small portion of a large model that had been previously trained on a larger data set.
In this case, the hypothesis is that the LSTM layer contains generalizable knowledge with respect to domain and target. This layer also contains 96.6% of the model’s weights, making it a good candidate for transfer. Thus the candidate layers for retraining are the domain and decision layers. Retraining the domain layer would imply adapting the domain layer to make more comparable to what the Siesta model expects (see Figure 1). However, this operation alone may not be sufficient, as fixing subsequent layers will leave little room for optimization. An alternative is to retrain only the decision layer. In this case, the Siesta model will be used to extract from Eindhoven data, but the final aggregation step will cope with changes due to sensor modality and annotation strategy. The third option is to retrain both domain and decision layers simultaneously, leaving it up to the optimizer to change weights as needed.
The models created with these three transfer learning strategies will be referred to as the Domain, Decision and Combined models (referring to which layers are retrained), and their performance on the Eindhoven data will be statistically compared against (1) the original trained model on the Siesta data set, which will be referred to as Siesta model, and (2) the model trained directly on Eindhoven data without prior training, which will be called the Eindhoven model.
These approaches will be evaluated using to show how much the transfer can adapt to the new AASM annotation strategy; and to show how much the model can adapt to both annotation strategy and the PPG modality. All transfer learning experiments will be performed in 4-fold cross-validation on the Eindhoven data set.
II-D4 Evaluation methodology
All training-validation and fold splits are done such that all recordings of a given participant are part of the training or the validation groups, but not both, or of a single fold in the case of cross-validation. The same fold assignments are used for all cross-validation experiments in the Eindhoven data set, to allow for a paired comparison of the validation performance. Performance is evaluated using metrics of accuracy and Cohen’s coefficient of agreement on an epoch-per-epoch basis in comparison with ground-truth. Differences in performance were compared on a per recording basis using a paired two-tailed Wilcoxon signed-rank test.
III Results
The results of training the Siesta model on the Siesta data set using ECG and R&K annotations are presented in Table II, where the average and the standard deviation of the performance for both the training and validation performance are shown. The evaluation of the model using the Eindhoven data set as hold-out set (without transfer learning) is shown in Table II both for the ECG-derived as well as for the PPG-derived HRV features. A significant difference () was found between the training and the validation performance on Siesta. The Non-transfer strategy resulted in a of and accuracy of for PPG while for ECG a of and accuracy of was found. These results were not significantly different from the performance of the Siesta model on the same data.
| Data set | Recs. (subjs.) | (-) | Accuracy (%) |
|---|---|---|---|
| Siesta Training split | 440 (220) | ||
| Siesta Validation split | 148 (74) | ||
| Eindhoven ECG | 101 (60) | ||
| Eindhoven PPG | 101 (60) |
-
1Significant difference () found between Training and Validation performance, after a Wilcoxon rank-sum test.
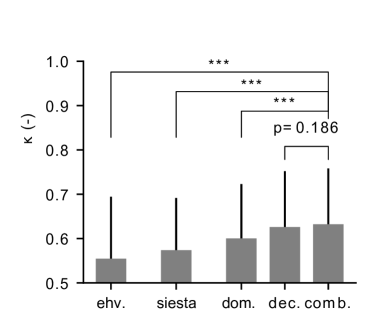
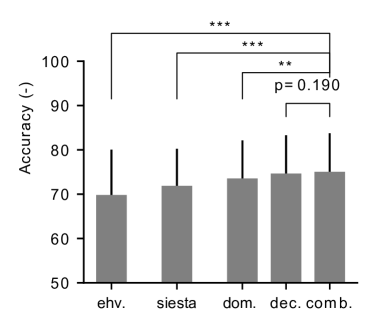
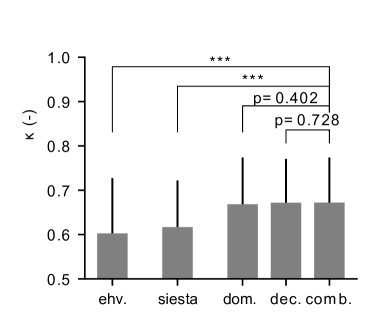
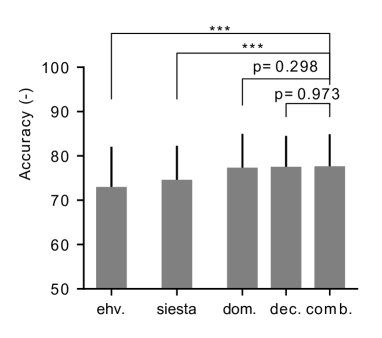
The performance after adapting the Siesta model using the three transfer experiments on the Eindhoven data set was derived for both ECG and PPG (separately) and shown in Table III. These metrics were compared with the performance of both Siesta and Eindhoven model performances. Results of these comparisons are illustrated in Figure 2 for PPG and Figure 3 for ECG. For PPG, the performance obtained with Combined is different from all strategies except Decision for both and accuracy (statistically significant). For ECG, the performance obtained with Combined is only significantly different from cross-validation and Siesta model performance.
| PPG | ECG | ||||
|---|---|---|---|---|---|
| Accuracy (%) | Accuracy (%) | ||||
| Domain | |||||
| Decision | |||||
| Combined | |||||
IV Discussion
IV-A LSTM as a sleep stage classifier
The level of agreement between an HRV-based sleep staging algorithm and PSG for the LSTM model (Table II) is beyond anything reported before in a data set containing a wide age range (20-95 years old) and a number of sleep disorders, including sleep apnea, insomnia, Parkinson’s disease and a few participants with periodic limb movement disorders. As reported in our earlier work on HRV-based sleep stage classifiers [11], the best performance achieved in a comparable part of the Siesta data using a non-temporal model (Bayesian Linear Discriminant) yielded and accuracy of 59.98% for 4-class sleep stage classification. When temporal models such as CRF [10] were used, this performance rose to a of 0.47 and accuracy of 68.77%, still well below the performance of the LSTM model presented in this study.
There are a few studies that have achieved a performance closer (but not equal) to the current study, though those were limited to a smaller set comprising only healthy ( of [7]) and/or young participants ( [43] and [44], which are known to be easier to classify with HRV features [11]. A closer analysis of the results obtained for the validation split of Siesta (Table II) revealed that for individuals below 45 years old the average was 0.67, higher than for middle-aged individuals (between 45 and 65, with a of 0.64) and much higher than for elderly (above 65, with a of 0.45), with a significant () correlation between age and of . In addition, all studies discussed in this paragraph used, besides HRV, also respiration as an input modality, which was not used in the current study.
Interestingly, two recent studies on the use of neural networks for EEG-based sleep stage classification [45, 46] also achieved superior performance using LSTM in their classification models. Given the state-of-the-art, it could be argued that LSTM models and other similar non-linear temporal classifiers adequately represent temporal relations during sleep and could be a key ingredient in future sleep staging algorithms.
IV-B Transfer learning
The average performance of the Siesta-trained model, when used with , dropped from a of 0.61 to 0.57. However, the performance using remained approximately the same with a of 0.62. While it is clear that the model degrades when used with PPG, the expected degradation on the ECG due to a change in scoring standard might have been offset by the fact that the Eindhoven data set only contains healthy participants which are, in general, slightly easier to classify using HRV than sleep-disordered patients [11]).
IV-B1 Adaptation to PPG
Both the Combined and Decision adaptation methods improved to an average of 0.63 for PPG as compared to 0.57 before transfer, while accuracy improved from 72% to 75%. The Domain approach resulted in a model that adapted halfway: increased to 0.60 and accuracy to 74%. Since there was no significant difference in performance for the Decision and Combined training strategies, we speculate that adapting the final Decision layer only would be sufficient, with the Combined approach not adding any extra value, while the Domain strategy proving to be insufficient for this task.
The performance obtained for PPG is considerably higher than that reported in state-of-the-art. Only two previous validation studies for PPG-based sleep staging are known to the authors, and which reported a of 0.42 [14] and 0.52 [47]. Both studies used only healthy participants and in addition made use of an accelerometer to improve the detection of the Wake class. With a of 0.55, training LSTM directly on the Eindhoven PPG data (without transfer) already achieved a higher performance than reported in these studies. After transfer learning the performance sets a considerably higher standard for PPG-based sleep stage classification, bringing this convenient sensing modality a step closer to the gold-standard PSG.
IV-B2 Adaptation to AASM-based scoring
A similar performance improvement was gained when doing transfer learning to as to . This could imply that part of the performance improvement obtained with transfer for both ECG and PPG is due to adaptation to AASM standard rather than to the sensor modality; this is compatible with the fact that the AASM scoring rules are more consistently reproducible, resulting in a higher inter-rater agreement between annotators [48], even though the Siesta data set was annotated by consensus according to R&K rules rather than a single annotator using AASM rules. The relatively small amount of adaptation to PPG could be attributed to the fact that PPG is a lower quality sensor of HRV: lower coverage means that model can only learn to deal with missing data, but not infer knowledge that it could not have learned from ECG. However it should be noted that for the PPG adaptation, it was not sufficient to only transfer the domain layer (see Figure
2) while for the
ECG transfer this approach did not differ from the other strategies (see Figure
3). This would suggest that the adaptation to PPG requires a larger optimisation space due to the change in modality. This could be related to differences between PPG and ECG that are not related to coverage, such as the variable time delays due to pulse transit time (see Section I-A).
A side-effect that was not hypothesised, is that the model might have also learned HRV characteristics specific of the Eindhoven data set, which comprises exclusively middle-aged healthy participants, as opposed to the Siesta data set which comprises, besides healthy participants, participants with sleep disorders as well as a wider range of ages. However, the Eindhoven data set does not include participants younger than 40 years old, which as was explained in Section IV-A are easier to classify than middle-aged and older individuals. Thus, it is unlikely that the population characteristics are the only driver of the performance gain after transfer, though untangling and quantifying the effects of these factors should be a topic of future work.
V Conclusion
In conclusion, a new method has been proposed for automated HRV-based sleep staging consisting of an LSTM neural network. The network has a higher capacity to learn and exploit temporal characteristics of sleep data than previous non-temporal or Markovian models and resulted in a increased performance in the Siesta data set when compared with previous work, showing its adequacy for participants of all ages and different pathological conditions. The second objective was to investigate transfer learning methodologies to adapt this model to a new problem and target domain, namely for the classification of HRV data from PPG instead of ECG, as well as to adapt to AASM guidelines for sleep staging instead of the older R&K guidelines. It was shown that the use of transfer learning resulted in a better model for this problem in comparison with a complete training of the model from scratch on this (smaller) data set. The performance achieved for PPG in this data set is considerably higher than reported in earlier work on PPG-based sleep scoring. The examined transfer strategies in most cases did not differ from each other, however for the transfer to PPG the decision layer was required to be part of the transfer for the best results.
It remains to be conclusively elucidated which factors contribute most to the performance improvements, but evidence suggests that the transfer to the modern AASM guidelines, which have been shown to yield higher inter-rater agreement, might be an important cause. Future work should focus on understanding whether similar improvements can be achieved with PPG sleep data of disordered participants, as well as replicating the transfer experiment to other unobtrusive modalities such as in-bed ballistocardiographic sensors.
References
- [1] R. B. Berry, R. Brooks, C. E. Gamaldo, S. M. Harding, C. L. Marcus, B. V. Vaughn et al., “The AASM manual for the scoring of sleep and associated events,” Rules, Terminology and Technical Specifications, Darien, Illinois, American Academy of Sleep Medicine, 2012.
- [2] M. Radha, G. Zhang, J. Gelissen, K. de Groot, R. Haakma, and R. M. Aarts, “Arterial path selection to measure pulse wave velocity as a surrogate marker of blood pressure,” Biomedical Physics & Engineering Express, vol. 3, no. 1, p. 015022, 2017.
- [3] M. Radha, K. de Groot, N. Rajani, C. C. P. Wong, N. Kobold, V. Vos, P. Fonseca, N. Mastellos, P. A. Wark, N. Velthoven, R. Haakma, and R. M. Aarts, “Wrist-worn blood pressure tracking in healthy free-living individuals using neural networks (in press),” 2018.
- [4] A. Rechtschaffen and A. Kales, A Manual of Standardized Terminology, Techniques and Scoring System for Sleep Stages of Human Subjects. Washington, DC: Public Health Service, U.S. Government Printing Office, 1968.
- [5] D. Moser, P. Anderer, G. Gruber, S. Parapatics, E. Loretz, M. Boeck, G. Kloesch, E. Heller, A. Schmidt, H. Danker-Hopfe et al., “Sleep classification according to AASM and Rechtschaffen & Kales: effects on sleep scoring parameters,” Sleep, vol. 32, no. 2, pp. 139–149, 2009.
- [6] M. Radha, G. Garcia-Molina, M. Poel, and G. Tononi, “Comparison of feature and classifier algorithms for online automatic sleep staging based on a single EEG signal,” Proceedings of the 36th Annual International Conference of the IEEE Engineering in Medicine and Biology Society, pp. 1876–1880, 2014.
- [7] P. Fonseca, X. Long, M. Radha, R. Haakma, R. M. Aarts, and J. Rolink, “Sleep stage classification with ECG and respiratory effort,” Physiological measurement, vol. 36, no. 10, p. 2027, 2015.
- [8] Y.-L. Hsu, Y.-T. Yang, J.-S. Wang, and C.-Y. Hsu, “Automatic sleep stage recurrent neural classifier using energy features of EEG signals,” Neurocomputing, vol. 104, pp. 105–114, 2013.
- [9] M. O. Mendez, M. Matteucci, V. Castronovo, L. Ferini-Strambi, S. Cerutti, and A. Bianchi, “Sleep staging from heart rate variability: time-varying spectral features and hidden markov models,” International Journal of Biomedical Engineering and Technology, vol. 3, no. 3-4, pp. 246–263, 2010.
- [10] P. Fonseca, N. den Teuling, X. Long, and R. M. Aarts, “Cardiorespiratory sleep stage detection using conditional random fields,” IEEE Journal of Biomedical and Health Informatics, vol. 21, no. 4, pp. 956–966, 2017.
- [11] ——, “A comparison of probabilistic classifiers for sleep stage classification,” Physiological measurement, vol. 39, no. 5, p. 055001, 2018.
- [12] G. Garcia-Molina, S. Vissapragada, A. Mahadevan, R. Goodpaster, B. Riedner, M. Bellesi, and G. Tononi, “Probabilistic characterization of sleep architecture: Home based study on healthy volunteers,” in IEEE 38th Annual International Conference of the Engineering in Medicine and Biology Society. IEEE, 2016, pp. 2834–2838.
- [13] G. Klosh, B. Kemp, T. Penzel, A. Schlogl, P. Rappelsberger, E. Trenker, G. Gruber, J. Zeithofer, B. Saletu, W. M. Herrmann et al., “The siesta project polygraphic and clinical database,” Proceedings of the 23rd Annual International Conference of the IEEE Engineering in Medicine and Biology Society, vol. 20, no. 3, pp. 51–57, 2001.
- [14] P. Fonseca, T. Weysen, M. S. Goelema, E. I. S. Møst, M. Radha, C. Lunsingh Scheurleer, L. van den Heuvel, and R. M. Aarts, “Validation of photoplethysmography-based sleep staging compared with polysomnography in healthy middle-aged adults,” Sleep, vol. 40, no. 7, p. zsx097, 2017.
- [15] P. Fonseca, N. den Teuling, X. Long, and R. M. Aarts, “Cardiorespiratory sleep stage detection using conditional random fields,” IEEE Journal of Biomedical and Health Informatics, vol. 21, no. 4, pp. 956–66, 2017.
- [16] P. S. Hamilton, “Open source ECG analysis,” in Computers in Cardiology. IEEE, sep 2002, pp. 101–104.
- [17] P. S. Hamilton and W. J. Tompkins, “Quantitative investigation of QRS detection rules using the MIT/BIH arrhythmia database,” IEEE Transactions on Biomedical Engineering, vol. 33, no. 12, pp. 1157–65, 1986.
- [18] P. Fonseca, R. M. Aarts, J. Foussier, and X. Long, “A novel low-complexity post-processing algorithm for precise QRS localization,” SpringerPlus, vol. 3, pp. 376–1/13, 2014.
- [19] G. B. Papini, P. Fonseca, X. L. Aubert, S. Overeem, J. W. M. Bergmans, and R. Vullings, “Photoplethysmography beat detection and pulse morphology quality assessment for signal reliability estimation,” in Proceedings of the 39th Annual International Conference of the IEEE Engineering in Medicine and Biology Society, 2017.
- [20] J. Redmond and C. Heneghan, “Cardiorespiratory-based sleep staging in subjects with obstructive sleep apnea,” IEEE Transactions on Biomedical Engineering, vol. 53, no. 3, pp. 485–96, 2006.
- [21] P. Bušek, J. Vaňková, J. Opavský, J. Salinger, and S. Nevšímalová, “Spectral analysis of the heart rate variability in sleep,” Physiological Research, vol. 54, no. 4, pp. 369–76, 2005.
- [22] X. Long, P. Fonseca, R. Haakma, R. M. Aarts, and J. Foussier, “Spectral boundary adaptation on heart rate variability for sleep and wake classification,” International Journal on Artificial Intelligence Tools, vol. 23, no. 3, p. 1460002, 2014.
- [23] M. Basner, B. Griefahn, U. Müller, G. Plath, and A. Samel, “An ECG-based algorithm for the automatic identification of autonomic activations associated with cortical arousal,” Sleep, vol. 30, no. 10, pp. 1349–61, 2007.
- [24] J. W. Kantelhardt, E. Koscielny-Bunde, H. H. A. Rego, S. Havlin, and A. Bunde, “Detecting long-range correlations with detrended fluctuation analysis,” Physica A: Statistical Mechanics and its Applications, vol. 295, no. 3, pp. 441–54, 2001.
- [25] T. Penzel, J. W. Kantelhardt, L. Grote, J.-H. H. Peter, and A. Bunde, “Comparison of detrended fluctuation analysis and spectral analysis for heart rate variability in sleep and sleep apnea,” IEEE Transactions on Biomedical Engineering, vol. 50, no. 10, pp. 1143–51, 2003.
- [26] C. K. Peng, S. V. Buldyrev, S. Havlin, M. Simons, H. E. Stanley, and A. L. Goldberger, “Mosaic organization of DNA nucleotides,” Physical Review E, vol. 49, no. 2, pp. 1685–1689, 1994.
- [27] M. Adnane, Z. Jiang, and Z. Yan, “Sleep-wake stages classification and sleep efficiency estimation using single-lead electrocardiogram,” Expert Systems with Applications, vol. 39, no. 1, pp. 1401–13, 2012.
- [28] M. Staudacher, S. Telser, A. Amann, H. Hinterhuber, and M. Ritsch-Marte, “A new method for change-point detection developed for on-line analysis of the heart beat variability during sleep,” Physica A: Statistical Mechanics and its Applications, vol. 349, no. 3-4, pp. 582–96, 2005.
- [29] M. Costa, A. Goldberger, and C.-K. Peng, “Multiscale entropy analysis of complex physiologic time series,” Physical Review Letters, vol. 89, no. 6, p. 068102, 2002.
- [30] D. Cysarz, H. Bettermann, and P. van Leeuwen, “Entropies of short binary sequences in heart period dynamics,” American Journal of Physiology - Heart and Circulatory Physiology, vol. 278, no. 6, pp. 2163–72, 2000.
- [31] E. Kvedalen, “Signal processing using the Teager Energy Operator and other nonlinear operators,” Ph.D. dissertation, University of Oslo, 2003.
- [32] N. E. Huang, Z. Shen, S. R. Long, M. C. Wu, H. H. Shih, Q. Zheng, N. C. Yen, C. C. Tung, and H. H. Liu, “The empirical mode decomposition and the Hilbert spectrum for nonlinear and non-stationary time series analysis,” Proceedings of the Royal Society of London. Series A: Mathematical, Physical and Engineering Sciences, vol. 454, no. 1971, pp. 903–95, 1998.
- [33] D. Cysarz, H. Bettermann, S. Lange, D. Geue, and P. van Leeuwen, “A quantitative comparison of different methods to detect cardiorespiratory coordination during night-time sleep,” Biomedical Engineering Online, vol. 3, no. 1, p. 44, 2004.
- [34] H. Bettermann, D. Cysarz, and P. Van Leeuwen, “Detecting cardiorespiratory coordination by respiratory pattern analysis of heart period dynamics - the musical rhythm approach,” International Journal of Bifurcation and Chaos, vol. 10, no. 10, pp. 2349–60, 2000.
- [35] T. Higuchi, “Approach to an irregular time series on the basis of the fractal theory,” Physica D: Nonlinear Phenomena, vol. 31, no. 2, pp. 277–83, 1988.
- [36] S. Hochreiter and J. Schmidhuber, “Long short-term memory,” Neural computation, vol. 9, no. 8, pp. 1735–1780, 1997.
- [37] A. Graves, S. Fernández, and J. Schmidhuber, “Bidirectional LSTM networks for improved phoneme classification and recognition,” in International Conference on Artificial Neural Networks. Springer, 2005, pp. 799–804.
- [38] M. D. Zeiler, “Adadelta: an adaptive learning rate method,” arXiv preprint arXiv:1212.5701, 2012.
- [39] T. Tieleman and G. Hinton, “Lecture 6.5-rmsprop: Divide the gradient by a running average of its recent magnitude,” COURSERA: Neural networks for machine learning, vol. 4, no. 2, pp. 26–31, 2012.
- [40] N. Srivastava, G. E. Hinton, A. Krizhevsky, I. Sutskever, and R. Salakhutdinov, “Dropout: a simple way to prevent neural networks from overfitting.” Journal of machine learning research, vol. 15, no. 1, pp. 1929–1958, 2014.
- [41] B. Sun, J. Feng, and K. Saenko, “Return of Frustratingly Easy Domain Adaptation,” in Proceedings of the Thirtieth AAAI Conference on Artificial Intelligence, vol. 6, no. 7, 2016, p. 8.
- [42] J.-T. Huang, J. Li, D. Yu, L. Deng, and Y. Gong, “Cross-language knowledge transfer using multilingual deep neural network with shared hidden layers,” in IEEE International Conference on Acoustics, Speech and Signal Processing. IEEE, 2013, pp. 7304–7308.
- [43] T. Willemen, D. Van Deun, V. Verhaert, M. Vandekerckhove, V. Exadaktylos, J. Verbraecken, S. Van Huffel, B. Haex, and J. Vander Sloten, “An evaluation of cardiorespiratory and movement features with respect to sleep-stage classification,” IEEE Journal of Biomedical and Health Informatics, vol. 18, no. 2, pp. 661–669, 2014.
- [44] M. Zhao, S. Yue, D. Katabi, T. S. Jaakkola, and M. T. Bianchi, “Learning sleep stages from radio signals: a conditional adversarial architecture,” in International Conference on Machine Learning, 2017, pp. 4100–4109.
- [45] J. B. Stephansen, A. Ambati, E. B. Leary, H. E. Moore, O. Carrillo, L. Lin, B. Hogl, A. Stefani, S. C. Hong, T. W. Kim, F. Pizza, G. Plazzi, S. Vandi, E. Antelmi, D. Perrin, S. T. Kuna, P. K. Schweitzer, C. Kushida, P. E. Peppard, P. Jennum, H. B. D. Sorensen, and E. Mignot, “The use of neural networks in the analysis of sleep stages and the diagnosis of narcolepsy,” arXiv preprint arXiv:1710.02094, oct 2017.
- [46] P. Anderer, P. Fonseca, M. Ross, A. Moreau, A. Cerny, X. Aubert, and M. Klee, “Deep learning for scoring sleep based on cardiorespiratory signals as compared to auto and multiple manual sleep scorings based on neurological signals,” in 28th European Respiratory Society International Congress (ERS) 2018, Paris, France, in press.
- [47] Z. Beattie, Y. Oyang, A. Statan, A. Ghoreyshi, A. Pantelopoulos, A. Russell, and C. Heneghan, “Estimation of sleep stages in a healthy adult population from optical plethysmography and accelerometer signals,” Physiological Measurement, vol. 38, pp. 1968–79, 2017.
- [48] H. Danker-hopfe, P. Anderer, J. Zeitlhofer, M. Boeck, H. Dorn, G. Gruber, E. Heller, E. Loretz, D. Moser, S. Parapatics et al., “Interrater reliability for sleep scoring according to the rechtschaffen & kales and the new AASM standard,” Journal of Sleep Research, vol. 18, no. 1, pp. 74–84, 2009.