A Network Topology Approach to Bot Classification
Abstract.
Automated social agents, or bots are increasingly becoming a problem on social media platforms. There is a growing body of literature and multiple tools to aid in the detection of such agents on online social networking platforms. We propose that the social network topology of a user would be sufficient to determine whether the user is a automated agent or a human. To test this, we use a publicly available dataset containing users on Twitter labelled as either automated social agent or human. Using an unsupervised machine learning approach, we obtain a detection accuracy rate of 70%.
1. Introduction
The use of automated agents, or bots, are increasingly prevalent on social media platforms (Ferrara et al., 2016). There are many examples of harmless, and even helpful bots, such as a massive Star Wars obsessed bot-net (Echeverría and Zhou, 2017), or countless client relations management bots, deployed by corporations to help deal with clients on online social networks (OSNs).
To create bots on OSNs is a relatively basic task and has been used for many years. Bots were employed mostly with harmless use-cases, but the applications have since spread to potentially more damaging activities. For a fee, organisations can artificially boost their profile, products, or ideas on OSNs by utilising such bots to tweet, post, favourite, retweet, follow, comment, befriend or reply. Similarly, a person can make themselves seem more trustworthy, credible or noteworthy, and ideas can also be boosted or quashed artificially. These objectives play well into the political arena, where the popularity and credibility of personalities and ideas are of central concern. Cresci et al. (2017) argue that there is evidence of a new paradigm in bot development, which they term ‘social bots’. This new wave of bots are smarter and have more advanced objectives. They attempt to evade detection by increasingly emulating expected social behaviour, by mimicking human behaviour. These social bots are much harder to detect, or at least, to distinguish from humans.
Echeverría and Zhou (2017) offer a brief overview of such ‘threatening’ bot activities on Twitter: spamming, fake trending topics, opinion manipulation, astroturfing111Astroturfing is the act of sponsoring a campaign to look like a legitimate grass-roots movement. Astroturf is an artificial type of grass, thus the name., fake followers and API contamination. The most notorious example in recent memory of such activities was with the British referendum on European Union membership,222Popularly referred to as Brexit, which is an amalgamate of British Exit. where both sides of the debate included bot activities (Bastos and Mercea, 2017). Another is the 2016 US Presidential election (Shao et al., 2018). This is an interesting turn from social media’s earlier hopeful and optimistic coming of age with the Arab Spring (Howard et al., 2011; Gerbaudo, 2012). Indeed, recent warnings from historians are highlighting the argument that connectedness does not necessarily lead to togetherness (Ferguson, 2017).
The above are examples of political interference in relatively homogeneous and politically stable developed nations. One can argue that these elections are extremely consequential worldwide, and therefore attract attention from various players, who are willing and able to interfere. Thus, elections in a developing nation may not attract such attention and levels of artificial interference. This is however not a good assumption, since there is evidence of interference by both local and international players in the South African political landscape on social media (Findlay, 2018).
Since 2016, South Africa has been experiencing its first large scale political interference on OSN platforms. There are multiple accounts of astroturfing involving pressure groups, and social bots driving political messages for a controversial politically connected business family, and ‘fake news’ spreading about various topics. Many hundreds of ‘bot’ accounts and misinformation networks have been uncovered by journalists who join a growing community of researchers attempting to solve the difficult, and increasingly important, issue of bot detection on OSNs (Fraser, 2017).
The scale of the worldwide issue has even attracted the attention of DARPA who hosted a competition for teams to detect automated social agents (Subrahmanian et al., 2016). The outcomes of the competition revealed that bot detection should be a semi-supervised process, a combination of crowd-sourcing and feature-based detection, which are discussed later in this paper.
The rest of the paper will firstly review the relevant literature on detecting bots on OSNs. From the literature, we find two major approaches to bot detection that can be classified as feature based and network based. We then propose social network topology as viable feature vector in distinguishing between bots and humans. We then propose an unsupervised learning methodology using social network topology. Finally, in the last section, we report the results of the classification.
2. Bot Detection
An exhaustive overview of bot detection methods is beyond the scope of this study, and it is sufficiently covered by Ferrara et al. (2016), who offer a helpful taxonomy of detection methods. Gilani et al. (2017) pointed out that many of these methods have claims of highly successful classification attempts, but few offer their methods and/or datasets with which to benchmark. The next sections offer a brief and general overview of previous approaches to bot classification.
2.1. Crowd Sourcing
The first is a non-computational solution, which relies on humans to detect bots on social platforms. The idea is that a large group of people would act like a mass Turing test to classify users as human or bot. There is a high success rate and near zero false positives, since humans are able to pick up on social nuances that are difficult to encode (Wang et al., 2012).
There are, however, multiple drawbacks to this approach, most notably the cost to scale implications. Only large social networking platforms are able to afford a group of expert analysts. Moreover, there are clear issues with privacy concerns when user profiles and data are exposed to people for annotation purposes. More modern bots are able to easily appear as more human, so annotation becomes inceasingly difficult. Especially if no supplementary automated methods are used.
Instead of relying on humans to detect anomalous features of OSN profiles, the problem would be well suited to a machine learning approach. The next sections explores such approaches.
2.2. Feature-based Detection
Feature-based detection methods distil data from OSN users into analysable features. Given sufficient examples of bots and humans, multiple features can be recorded from each category to identify significant differences between them. These features mostly rely on behavioural data of the agents for classification, however, it is reasonable to combine multiple features.
This problem lends itself to the implementation of machine learning libraries in order to help classify using multiple features. Botometer, the first publicly available classifier, uses a random forest ensemble supervised learning method (Davis et al., 2016).333The name was originally BotOrNot, but was since changed to Botometer, see https://botometer.iuni.iu.edu. The classifier uses multiple features from the user’s network, user profile, friends, temporal features, content and sentiment. The exact implementation is not publicly available, but Gilani et al. (2017) attempted a reproduction and extension to the work of Davis et al. (2016) and made the methodology and data open access.
This type of bot detection and classification work enjoys the most success. There are some notable new developments since the review of Ferrara et al. (2016). Inspired by digital DNA sequencing, Cresci et al. (2017) developed ‘Social Fingerprinting’ as a way to classify bots and human agents. DNA sequencing creates a set of similarity curves to which honest and dishonest nodes adhere. The approach has a 92.9% accuracy (Cresci et al., 2017).
Since the platforms are fundamentally social, many researchers have developed methods that use these social characteristics in bot detection. The next sections explore these characteristics in the form of graph-based methods.
2.3. Graph-based Detection
The intuition with graph-based approaches is that because the platform is social, the interaction between users of the platform generate trace data of their interactions. This trace data can be used to uncover the social aspect of the user behaviour, which can be used to differentiate between bots and humans. Generally the trace data is envisioned as a network graph.
There are two approaches to generating graph data. The first uses the content interaction between users of a social media platform to create a graph. The second approach uses the relational data, such as following and friending, to create a network. Each approach is discussed in more detail below.
2.3.1. Content-based
Content-based graphs are used as feature variables as described in Section 2.2. Examples include Varol et al. (2017) who use content networks produced by retweet, mention and hash-tag co-occurrence of users to produce network structures (also see Davis et al., 2016; Gilani et al., 2017; Cresci et al., 2017). For each network, various network features are calculated, including indegree, outdegree, density and clustering coefficient. These measures are then combined with other features including user meta data, friends data, content, sentiment and timing. A recent unique content based method is by Shao et al. (2018), who used content interaction to investigate the dynamics of the spread of false information. They observed, through k-core decomposition, that social bots proliferate at the fringes of the interaction network.
Most research where the graph is used as the key, or only, feature is categorised as relation-based detection. The next section reviews this research agenda.
2.3.2. Relation-based
Research using relation-based graphs for bot detection is dominated by what is labelled Sybil research.444The original usage of the term ‘Sybil’ is by Douceur (2002). In Sybil research the key assumption is that trust is more difficult or expensive to establish between a bot and a human. This means that the number of connections between humans and bots would be less than within each group. In other words, people will not readily follow bots. This assumption lends itself to community detection methods, which is well developed within graph theory. The intuition is that if one can identify nodes belonging to the same community as a confirmed account, either bot or human, they should inherit the label.
These methods first identify a confirmed honest or Sybil seed node, then a surrounding relational network structure is elicited. From this network structure, they use various community detection algorithms to classify all nodes in the network into a community (Viswanath et al., 2010). Those nodes classified into a community with the seed node inherit the label; honest or Sybil. Examples of such methods include SybilGuard (Yu et al., 2006), SybilLimit (Yu et al., 2008), SybilInfer (Danezis and Mittal, 2009), and more recently SybilFuse (Gao et al., 2018).
Bots are able to establish connections to humans either through effective disguise or poor due-diligence by the human agents. Many researchers found that the trust assumption is not as valid as originally anticipated.555Although the use of trust is a broad application of actual human trust. A better proxy for this might be a type of threshold. Yang et al. (2012) investigated the effectiveness of criminal supporter accounts which aim to infiltrate and hide actual bot accounts, offering proxy attack edges.666Attack edges are connections made from a sybil account to an honest user, through which attacks can be performed. Edwards et al. (2014) experimentally tested whether a known bot would be perceived differently from a human in terms of communication factors. They found no difference between communication quality of bots and human agents, except for a measure of attraction. Boshmaf et al. (2011) tested the level of social penetration by building their own bot-net, which achieved as high as 80% penetration. Ghosh et al. (2012) highlighted the effect of the social capitalists—human agents who always follow back—who make it easy for bot-nets to penetrate social networks and increase attack edges between bot communities and humans. Bilge et al. (2009) investigated how easy it would be to automate cloning attacks. Both their simplistic and more advanced methods offered positive results. The assumption of strong trust networks is, therefore, difficult to rely on. Aiello et al. (2012) conducted a social experiment where they determined how a bot can gain influence on social media.
Bots are, therefore, becoming more socially complex and thus more difficult to distinguish from honest users of the platform. The assumptions of previous methods are increasingly becoming ineffective in detecting such bots (Cresci et al., 2017). The most successful methods are those that combine multiple methods into a comprehensive detection and classification regime.
Consequently, the options for future research are two-fold. Firstly, to determine effective combinations of the above explored methodologies, such as Varol et al. (2017); Cresci et al. (2017); Gilani et al. (2017), and secondly, to develop new specialised methodologies and data gathering techniques, such as new measures of on-line agents. Here we propose a new specialised methodology, which could be included in future blended methodologies. The proposed method is an unsupervised machine learning approach, using existing clustering methods on features extracted from a K-2 network of a target node.777This is defined in section 3.2, but a K-2 network is a network that spans two steps from an original seed node (ego).
2.3.3. Issues with prior approaches
Existing classification methods have two key issues. Firstly, many are sensitive to the training datasets used to validate the method—especially methods relying on supervised machine learning. Secondly, since research about bot detection is published—an obvious reason why Twitter does not do so—the detection methods are available to those who wish to avoid detection.
By using human annotators, Gilani et al. (2017) determined that Botometer could only achieve accuracy measure of 48% when presented with a new dataset. This is compared to a claimed 95% accuracy rate with previous training data by by Davis et al. (2016), which was later reduced to 88% by Varol et al. (2017).
Supervised machine learning methods are sensitive to biases in training datasets. For instance, the Botometer classifier is based on an ensemble learning random forest algorithm. Although they do check for over-fitting, it is difficult to completely alleviate the sensitivity, and automated social agents are constantly evolving, which necessitates new features to be developed to cover for such evolution. A less covered and less substantiated method is the botcheck.me classifier,888See https://botcheck.me/ which offers an example of specialisation classification. They use machine learning to classify automated agents, but are explicit about the narrow application, which is politically orientated bots. The botcheck.me classifier is specifically trained on ‘politically orientated’ bots, instead of attempting a generalist approach such as BotOrNot. The prominence of more complex approaches, for example SybilFuse by Gao et al. (2018), is a response on the oversimplification of existing methods in bot detection.
Cresci et al. (2017) determined that bots evolve as new detection methods arrive. It is reasonable to expect that bot detection methodologies that are well publicised as being effective would enable those avoiding detection to learn how to avoid it (Varol et al., 2017). The most well known publicly available method of bot detection is Botometer, since generating coverage in news articles and research ‘fact tanks’ such as Pew Research Centre (John, 2018). If this is the reason for the low correlation between human annotators and the Botometer detection method’s accuracy, then it deteriorated at a surprisingly rapid pace. The Botometer paper by Davis et al. (2016) was published in April of 2016, and a year and a half later, Gilani et al. (2017) determined that the accuracy of the method dropped by an estimated 47%.
2.4. Network Topology Approach
We propose here a new specialised approach, using ego-centred network topology as feature vectors for unsupervised machine learning.
The appeal of network topology as a feature is that it is able to capture complex social structure, which social bots would struggle to effectively emulate. A large body of work exists, which investigates the complexities of social networks, like small-world and scale-free properties (Albert and Barabási, 2002; Newman, 2003). At risk of oversimplifying the field, people do not form social relations in a random manner. The establishment of connections have local biases, yet the macro effect of these biasses have complex outcomes. For instance, the preferential attachment model is put forth as the reason why networks have scale-free properties (Albert and Barabási, 2002). Preferential attachment implies that nodes with more relations are more probable to receive more relations. This is also called the Matthew effect, or the rich get richer effect.
If we imagine a simplistic bot befriending people at random, the degree distribution would most probably follow a normal distribution, whereas real social networks almost exclusively follow a power law distribution (Albert and Barabási, 2002). This is easily remedied by the designer of the social bot by adding a parameter to prefer befriending people with more followers and friends. The network topology, therefore, seems to be easily circumvented by a well designed social bot. However, these bots can not control the interactions by the bots alters. For instance, if they are only ever followed back by people who automatically follow back all requests, such as how Ghosh et al. (2012) reports, then this would show up clearly in the topology as an extraordinarily dense and large network. Emulating such complexities of social networks become increasingly more difficult when considering the many idiosyncratic social behaviours of users.
The next section expands on the methodology, specifically the network topology methods that were used in developing the feature vector. We also highlight the classification methodology used.
3. Methodology
To test the accuracy of the proposed method, an annotated dataset containing both bots and humans is required. Given a list of identifiers, a two step crawler, which we label the K-2 crawler, is utilised. Multiple network measures are then calculated for each graph as a feature of the seed node. These measures are then used in a clustering procedure. The inherited labels from the clusters are then compared to the original annotations to determine the accuracy of the method. The following sections describe this methodology in more detail.
3.1. Dataset
Since we need an annotated dataset containing only a Twitter user identifier, and its annotation as bot or not, there are a few publicly available datasets that satisfy these criteria. The most accessible dataset for our purposes was made available by Varol et al. (2017). The Varol et al. (2017) dataset contains Twitter user identifiers and their corresponding classification; 1 = Bot, 0 = Not. The labels were assigned as 1 when the user has a classification score of 0.5 and above (Varol et al., 2017). With the identifiers it is possible to crawl the follower networks. The original dataset contained 2573 identifiers containing 68% (1747) nots and 32% (826) bots. After checking which of the accounts are still active, the revised dataset contains 2178 identifiers, which is a 15% (395) reduction. The split between the annotations are similar with 67% (1462) annotated as Nots and 33% (671) as Bots.
3.2. K-2 Crawler
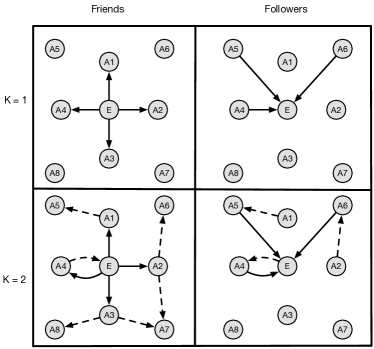
The objective of the crawler is to be able to gather the surrounding relational network structure of the ego. Previous studies have also generated such relational graphs around a focal node, but we propose a wider crawl. Most prior research stop the crawl at K=1 from ego, and some include both friends and followers. To illustrate the variants of the crawl we refer to Figure 1. A simplistic crawl can vary in two parameters, direction (friends or followers) and k (steps). As an example, Yang et al. (2013) did both the top two quadrants by crawling K=1 on both the friends and followers of each user. Many researchers take the count of followers and friends in order to calculate the ratio. Actually retrieving the user identifiers of the friends or followers make it possible to determine, as in the case of Yang et al. (2013), different measures such as reciprocity. Extending the crawl to K=2, makes even more measurements possible. In practice a K=3 crawl is impractical on Twitter, since this could theoretically crawl the whole network with a median distance of 4.12 reached in 2010 already (Kwak et al., 2010, p. 594). We, therefore, perform a crawl as illustrated in the bottom-left quadrant in Figure 1, which makes more nuanced graph measures possible. We are only interested in friends of egos and alters, and not followers, since we are interested in the ‘choices’ of the users, and the reaction to those choices. For instance, we are interested to know whether, if an ego follows an alter, does the alter follow back, and among those that follow back, do they follow each other.
3.3. K-1 Graph
We also reduced the original graph to an ego-centric, or K-1, graph. This graph utilises the full graph’s K-2 crawl and then reduces the number of nodes in the dataset by doing a k-core decomposition. The goal is to gain insight about the structure, function, and composition of network ties around the ego specifically (Wasserman and Faust, 1994). Since Boshmaf et al. (2011) showed that it is possible for a bot to penetrate true social structures, we are cognisant of the possibility that the actual social topology might distort the structure of a possible bot. Reducing the K-2 to a K-1 network will reduce the added noise of the alters’ full networks and concentrate the measurements on the seed node, thus called an ego-centric network, since it centres around the ego node.
Since social networks can not be compared directly, we have to reduce them to certain features to compare them with. The following section outlines the measures of interest here.
3.4. Graph Measures
While there are many relevant graph measures,999 For a good start see Wasserman and Faust (1994). we are more interested in a few general and easily interpretable measures as a proof of concept in using graph structure as a means to classify users on Twitter. Table 1 offers a brief overview of the measures used. Since the K-2 networks can become excessively large, we can not use computationally expensive measures. For convenience the measures are summarised in Table 1.
| Measure | Description | Source |
|---|---|---|
| Size | The number of nodes in the graph. | (Harris et al., 2008, p.5-8) |
| Global Clustering Coefficient | “The fraction of paths of length two in the network that are closed”. i.e. Whether a friend of a friend is a friend. | (Newman, 2010, p. 199) |
| Local Clustering Coefficient | The same as the global measure, but measured for a focal node. | (Newman, 2010, p. 201) |
| Indegree Graph Centralization | A graph-level measure of the number of edges directed towards the nodes in a graph. | (Wasserman and Faust, 1994, p. 175-177) |
| Outdegree Graph Centralization | A graph-level measure of the number of edges directed from the nodes in a graph. | (Wasserman and Faust, 1994, p. 175-177) |
| Degree Graph Centralization | A graph-level measure of the number of edges directed to and from the nodes in a graph. | (Wasserman and Faust, 1994, p. 175-177) |
| Indegree Graph Centrality | The number of edges that are directed towards a single node. | (Wasserman and Faust, 1994, p. 178,199-202) |
| Outdegree Graph Centrality | The number of edges that are directed from a single node to other nodes in the graph. | (Wasserman and Faust, 1994, p. 178,199-202) |
| Degree Graph Centrality | The number of edges directed from and at a single node in a graph. | (Wasserman and Faust, 1994, p. 178,199-202) |
| Density | Ratio of the amount of edges and the amount of possible edges in the graph. | (Wasserman and Faust, 1994, p. 165) |
| Reciprocation | The proportion of mutual connections in a directed graph. | (Wasserman and Faust, 1994, p. 515) |
| Assortativity | Also known as assortative mixing. Assortativity is the preference for a graph’s nodes to attach itself to other nodes that are similar to it. The similarity, in this case is measured by degree. | (Newman, 2003) |
| Articulation Points | Nodes that if removed, increases the number of connected components in a graph. Also known as cut vertices. | (Italiano et al., 2012) |
3.4.1. Network Size
Network size is a measure of the number of nodes (users) in the network. Network size is not a particularly useful measure of network topology, but it is an important measure for normalisation of the data.
3.4.2. Density
Density is the measure of how well connected a network is. It is expressed as a proportion of relations out of the theoretical maximum possible relations in the network. It is also a control measure of other topology measures such as centrality, since the measures are sensitive to the density and the size of the network.
3.4.3. Clustering Coefficient
Clustering coefficient is the simple, yet informative, measure of how transitive a relation is between any three nodes. It, therefore, measures whether a friend of a friend is also a friend. Social networks tend to have a higher clustering coefficient than a random network of the same size (Albert and Barabási, 2002, p. 50). We calculate both the global clustering coefficient and the local clustering coefficient, to capture the transitivity of the network as a whole as well as the ego self.
3.4.4. Centrality
Centrality is a useful measure of importance of nodes in a graph. There are many measures of centrality, but the simplest measure is to count the number of connections to a node. These connections could be either undirected, or directed in or out of a node. A node has the highest degree centrality when it has more relations to it than any other node. Some nodes might have high indegree but low outdegree. For instance, celebrities on Twitter tend to have more people following them than they themselves follow. Therefore, celebrities might have high indegree but low outdegree. Simply using degree, without direction, would not offer this type of nuance. A simplistic bot on the other hand might have very high outdegree but very low indegree, since most people will not follow a bot back. A social capitalist on Twitter could be identified by a balanced indegree and outdegree, since they reciprocate every relation.
3.4.5. Graph centralisation
Graph centralisation is a measure of how much the degree count is concentrated in a single node. Centralisation can be calculated by either taking the degree of nodes (bot incoming and outgoing relations), or it can use the direction of the relation. A graph is perfectly centralised if a single node contains all the relations. A graph is completely decentralised if all the nodes have an equal degree.
3.4.6. Reciprocity
Reciprocity is measure of how many relations in the network are reciprocated. It is anticipated that bots would have lower reciprocity than human users.
3.4.7. Assortativity
Assortativity is a measure of the tendency of nodes to connect to similar nodes, i.e. homophily. Usually assortativity is calculated using a node variable such as gender or age, we use degree as a measure of similarity. We therefore test the tendency of high degree nodes to only follow other high degree nodes, and inversely low degree nodes to only follow fellow low degree nodes. This can be likened to celebrities only following celebrities.
3.4.8. Articulation Points
Articulation points are the points which, if removed, increase the number of connected components in a network. Social networks tend to have higher redundancy, which translates to fewer articulation points than random graphs.
Each seed node in the Varol dataset was crawled using the K-2 crawler. The resulting network of each crawl was copied and reduced to an K-1 network. We, therefore, have two networks representing each identifier from the dataset. The metrics were then calculated for each of these networks. There are, therefore, two sets of network measures for each identifier. These measures were then used as feature vectors in the clustering methodology.
3.5. Clustering Methodology
The clustering methodology involves various steps. Firstly, a visual assessment of clustering tendency (VAT) is performed as prescribed by Bezdek and Hathaway (2002). This offers a means to determine the most applicable distance measures. Secondly, four distinct clustering methods are considered in order to determine which method offers the best performance in classifying users.
3.5.1. Distance Measures
There are multiple distance measures to consider. In addition to standard euclidean distance, three generally applicable measures are, Pearson, Spearman, and Kendall. To determine which distance measures perform best, we inspect the performance of the measures in producing clear clusters. To do this, we follow the VAT procedure from Bezdek and Hathaway (2002). Firstly, we compute the dissimilarity matrix between the objects based on the network topology measures. This dissimilarity matrix is then reordered to place similar objects closer to each other, producing an ordered dissimilarity index which is shown in Table 2.
| Method | ||||||
|---|---|---|---|---|---|---|
|
Euclidean | Kendal | Spearman | Pearson | ||
![[Uncaptioned image]](/html/1809.06190/assets/Full_euc.png) |
![[Uncaptioned image]](/html/1809.06190/assets/Full_ken.png) |
![[Uncaptioned image]](/html/1809.06190/assets/Full_spe.png) |
![[Uncaptioned image]](/html/1809.06190/assets/Full_pea.png) |
|||
| Original (K-2) | ||||||
![[Uncaptioned image]](/html/1809.06190/assets/Reduc_euc.png) |
![[Uncaptioned image]](/html/1809.06190/assets/Reduc_ken.png) |
![[Uncaptioned image]](/html/1809.06190/assets/Reduc_spe.png) |
![[Uncaptioned image]](/html/1809.06190/assets/Reduc_pea.png) |
|||
| K-1 (Ego-centric) | ||||||
A visual inspection indicates that the two correlation measures offer the best definition of clusters—Pearson and Spearman.
Pearson measures the difference between the variables of each observation, while Spearman ranks the observations based on the differences between the variables. In other words, both correlations evaluate to the relationships between two nodes but differ in that Spearman correlation measures variables that change together but not necessarily at the same time.
Therefore, both Spearman and Pearson are used as options for distance measures in the clustering procedure.
3.5.2. Clustering Methods
To determine the most appropriate clustering method and number of clusters, we use cluster validation procedures as suggested by Kassambara (2017, p 138-141). Both internal and stability validation methods were performed. Internal cluster validation procedures evaluate the results of clustering procedures on three measures: connectivity, Dunn and silhouette. Stability measures include: average proportion of non-overlap (APN), average distance (AD), average distance between means (ADM) and the figure of merit (FOM) Kassambara (2017, p 152). All the measures were performed on a representative sample of the dataset, roughly 10% of the full Varol dataset, since the measures require an exponential amount of processing power as the number of nodes increase. The results of these validation methods suggest that the most applicable clustering methods would be partitioning around medoids (PAM), fuzzy analysis clustering (FANNY) and agglomerative nesting (AGNES), with two clusters as the most optimal number. Each method is briefly explained below.
K-means (Partitioning Around Medoids)
The first clustering method, PAM, is used to partition the data into K groups, where K is the amount requested by the analyst. This groups the nodes around the two or more largest mean distances between nodes. For the purpose of analysing this dataset, two points were chosen to cluster Bots and Nots into groups that could be easily distinguished (Wagstaff et al., 2001).
Fuzzy Analysis Clustering
FANNY groups nodes based on the probability of belonging to a specific cluster. The algorithm calculates the distance between nodes and the centre of a cluster and assigns a coefficient to each node. The clusters were computed using the R statistical language according to the guide provided by (Kassambara, 2017).101010All analysis was conducted using R.
Agglomerative Nesting Method
AGNES groups nodes based on their similarity coefficient. The algorithm merges nodes in series of steps, creating a larger cluster with each step until only one remains, leaving behind a dendrogram representation of the nodes (Kassambara, 2017).
The two distance measures (Pearson and Spearman), three clustering methods (FANNY, AGNES and PAM) and two graph structures (full and K-1), result in twelve distinct methods to use in classifying the observations. Before proceeding to the performance results, the methodology for measuring the performance of the 12 methods needs to be defined. The next section covers the measures of clustering performance.
3.6. Clustering Performance Methodology
A confusion table is a helpful framework to measure the performance of classification methods.
Table 3.6 is an example of a Confusion Table. To use the confusion table, there must be a predicted outcome and an actual outcome. Each clustering method offered two clusters, each observation was placed within a cluster. There is no a-priori way of knowing what the clusters consist of, nor is it known if it is actually differentiating between bots and humans. For each observation the original label from Varol et al. (2017) used as comparison. Recall that each observation was classified as either 1 or 0, indicating (respectively) bot or not. We therefore know the actual class of the observation, and can then compare the prediction of the clustering method against the original Varol labels.
| Cluster | Actual Label | |||
|---|---|---|---|---|
| Bot | Not | Total | ||
| Bot′ | True Positive | False Positive | BOTS′ | |
| Not′ | False Negative | True Negative | NOTS′ | |
| Total | BOTS | NOTS | ||
Table 3.6, shows the four possible outcomes for a classifier. When both the clustering method and the actual labels indicate Bot, the classification is a true positive (TP). If the classification indicates that an observation is classified as Not, where the actual label is Bot, the result of the classifier is a false negative (FN). If the classification method indicates that an observation is a Bot, but the original label is Not, then the classification is a false positive. Lastly, when the classification indicates that the observation is a Not, whereas the original label indicates Bot, it is deemed as a true negative. It is a oversimplification to only record the true positive rate of classifier accuracy. More nuanced measures of classification performance is therefore needed. There are many measures that can be derived from the confusion table, but only five measures will be calculated to assist in defining the most successful classification method among the 12 proposed. Table 4 briefly outlines the five accuracy measures. 111111The descriptions are from Sing et al. (2005).
| Measure | Abbreviation | Description |
|---|---|---|
| False Positive Rate | FPR | The predictive outcome of the classifiers we used to identify if the instance is either bot or not. In this case the the prediction is positive, but the instance is negative. This is also known as fallout. |
| True Positive Rate | TPR | Similar to the FPR, however the prediction is correct. The prediction by the classifier and the instance were both positive. Calculation for this is done by dividing the true positives by the positive samples. This is also known as recall. |
| Accuracy | Acc. | The degree to which the prediction made by the classifier matches the instance of the dataset, in this case Varol. To calculate the accuracy, the true positive and negative results are combined, and then divided by the positive and negative results. |
| Phi Coefficient | Phi | Supplies a range between minus one and one, where one is perfect prediction and zero is random prediction. Below zero is worse than random prediction. |
| F-Score | F | Introduced by van Rijsbergen in 1979, is a combination of precision and recall, and tests the accuracy of the test. The highest score for the F-Score is one and the worst score is zero. |
| Precision | Prec. | Measures the probability that a classifier’s prediction which has a positive outcome also has a positive instance. The reverse is true for a negative outcome. |
4. Results
Each clustering method produced two clusters in which all observations are classified. It is not known which cluster is bot and which is not. The accuracy of each methodology is therefore first calculated to make an informed choice as to which cluster corresponds to which classification. In all the methodologies the ‘second’ cluster was mostly grouping bots (as per the original labels), except four methods where the assumption is reversed: (1) Spearman-FANNY(full); (2) Spearman-PAM (full); (3) Pearson-FANNY (full); and (4) Pearson-PAM (full). The results reported below adjusted the assumptions appropriately.
The performance measures are captured in Table 5. It is observed that the Spearman resulted in overall higher scores. On average, Spearman exhibits a slightly lower difference in FPR (0.04), which is the same score as Pearson for TPR. When considering phi, Spearman offers a marginal improvement over Pearson. The performance measurements for K-1 graphs performs between 0.10 and 0.23 points lower than that of the K-2 graph for Pearson, and between 0 and 0.19 lower for Spearman.
To further investigate the performance of the clustering methods, a receiver operating characteristics (ROC) graph is used to aid in the discussion. The ROC is commonly used graph in determining the general performance of clustering methods.
[c] Distance Method Graph Type Clustering Method FPRa TPRb Accc Phid Fe Precf Spearman* 0.43 0.71 0.62 0.27 0.53 0.43 Original (K-2)* 0.43 0.82 0.65 0.37 0.60 0.47 AGNES 0.37 0.85 0.70 0.44 0.64 0.51 FANNY 0.42 0.77 0.64 0.32 0.57 0.46 PAM 0.49 0.85 0.62 0.35 0.58 0.44 K-1* 0.43 0.63 0.59 0.19 0.49 0.40 AGNES 0.30 0.46 0.62 0.16 0.44 0.41 FANNY 0.46 0.69 0.59 0.22 0.51 0.41 PAM 0.53 0.74 0.56 0.20 0.51 0.39 Pearson* 0.47 0.71 0.59 0.23 0.52 0.41 Original (K-2)* 0.41 0.79 0.65 0.36 0.59 0.47 AGNES 0.33 0.76 0.70 0.40 0.61 0.51 FANNY 0.42 0.77 0.64 0.32 0.57 0.46 PAM 0.49 0.85 0.62 0.35 0.58 0.44 K-1* 0.51 0.65 0.54 0.13 0.47 0.37 AGNES 0.54 0.51 0.48 -0.03 0.38 0.30 FANNY 0.46 0.69 0.59 0.22 0.51 0.41 PAM 0.53 0.74 0.56 0.20 0.51 0.39
-
•
* Average of performance measures for the methods within the category.
-
•
(a) False Positive Rate;
-
•
(b) True Positive Rate;
-
•
(c) Accuracy;
-
•
(d) Phi Coefficient;
-
•
(e) F-Score;
-
•
(f) Precision;
4.1. ROC
The ROC graph visualises the classifiers based on their performance. The x and y scales display a range from zero to one. The false positive rate of the classifier is represented by x, and y represents the true positive rate. Coordinates or indicate the best performance, although the latter indicates an incorrect assumption of the classifier predictions compared to the original labels.121212Since the assumption is adjusted, all methods would be above the x and y line. The diagonal, , indicated as a red dashed line on Figure 2, displays a random guessing strategy. Any point on that line is considered to be equal to a random guessing strategy (Fawcett, 2003).
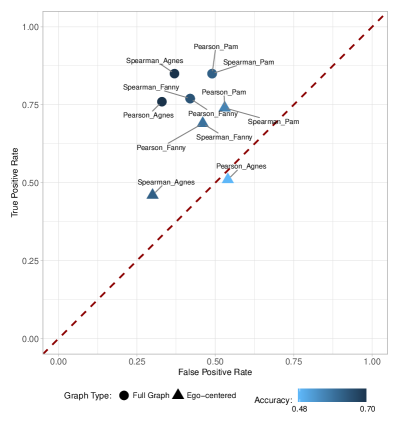
Figure 2 visualizes the clustering performance of the 12 methods. It is clear that the topology measures of the full graph were best able to contribute to true positive classification. The reduced graph negatively impacted the classification performance in all cases except one, Spearman-AGNES, which had a marginal improvement in false positive rates, but at high cost of true positives. Pearson-AGNES on the reduced graph is almost equal to a random guessing strategy, where the same method on the full graph contends for best classification methodology. Our hypothesis of a reduced K-1 graph leading to more accurate classification is, therefore, mostly rejected.
The remainder of the methods performed above the random guessing strategy. The methods with the best performance are: Spearman-AGNES; Pearson-PAM; and Spearman-PAM, all using the full K-2 graph topology.
The hypothesis that a K-2 network topology is capable of distinguishing between bots and humans is, therefore, confirmed.
5. Conclusion
Instead of using the network topology of an ego to classify the rest of the network as bot or not, as with Sibyl research, we use the network as the classifier of the ego itself. This relies on the intuition that bots are not capable of mimicking complex social network structures. While it is possible to classify bots using social network analysis with an estimated maximum accuracy of 0.70, it would best be used in conjunction with existing blended methodologies as a specialised method.
Of the five distance measures that were considered, Pearson and Spearman were chosen based on a visual inspection of their cluster definition. They offered the best definition of clusters and would offer the most accurate analysis of clusters. Four stability validation measures provided the three most applicable clustering methods: PAM, Fanny and AGNES. The combination of these distance and cluster analysis produced twelve methods used to build the classification model. Each of the methods were tested by calculating the difference between the predictions of each proposed method, and the labels provided by the Varol dataset. The labels were assigned to 1 based on the user having a classification score of 0.5 and above (Varol et al., 2017). In terms of correctly identifying Bots, three methods achieved an 85% True Positive Rate. When also accounting for the False Positive Rate, two methods, achieved an accuracy score of 70%. These two methods both employed the AGNES clustering method, on the full graph topography, and the choice of distance measure thus made no difference. Both these methods also performed exactly the same in terms of precision, with 51%. The only measure to differentiate between the two measures is the Phi Coefficient. The Phi indicates that Spearman-AGNES, the highest performing measurement, performs 0.44 higher than that of random chance, which is impressive considering that the method is unsupervised.
Future methods should, therefore, consider including the social network topology, specifically a full K-2 graph of each user, as a means to successful classifying automated social agents on OSNs. We also note that we included all observations in the classification methodology. The methodology might be improved by removing obvious outliers, such as graphs containing only a few nodes. The inclusion of these spurious observations may affect the classification capabilities of the method.
References
- (1)
- Aiello et al. (2012) Luca Maria Aiello, Martina Deplano, Rossano Schifanella, and Giancarlo Ruffo. 2012. People are Strange when you’re a Stranger: Impact and Influence of Bots on Social Networks. In Proceedings of the Sixth International AAAI Conference on Weblogs and Social Media People. Dublin, Ireland, 10–17.
- Albert and Barabási (2002) Réka Albert and Albert-László Barabási. 2002. Statistical mechanics of complex networks. Reviews of Modern Physics 74, 1 (2002), 47–97. https://doi.org/10.1103/RevModPhys.74.47 arXiv:cond-mat/0106096v1
- Bastos and Mercea (2017) Marco T. Bastos and Dan Mercea. 2017. The Brexit Botnet and User-Generated Hyperpartisan News. Social Science Computer Review Preprint (2017), 1–18. https://doi.org/10.1177/0894439317734157
- Bezdek and Hathaway (2002) J.C. Bezdek and R.J. Hathaway. 2002. VAT: A Tool for Visual Assessment of (Cluster) Tendency. In Proceedings of the 2002 International Joint Conference on Neural Networks. IJCNN’02. IEEE, Honolulu, HI, 2225–2230. https://doi.org/10.1109/IJCNN.2002.1007487
- Bilge et al. (2009) Leyla Bilge, Thorsten Strufe, Davide Balzarotti, and Engin Kirda. 2009. All Your Contacts Are Belong to Us : Automated Identity Theft Attacks on Social Networks. In WWW 2009 MADRID! Mardrid, 551–560. https://doi.org/10.1145/1526709.1526784
- Boshmaf et al. (2011) Yazan Boshmaf, Ildar Muslukhov, Konstantin Beznosov, and Matei Ripeanu. 2011. The socialbot network: when bots socialize for fame and money. In Proceedings of the 27th annual computer security applications conference. 93–102. https://doi.org/10.1145/2076732.2076746
- Cresci et al. (2017) Stefano Cresci, Roberto Di Pietro, Marinella Petrocchi, Angelo Spognardi, and Maurizio Tesconi. 2017. Social Fingerprinting: detection of spambot groups through DNA-inspired behavioral modeling Stefano. In Proceedings of the 26th International Conference on World Wide Web Companion. Perth, Australia, 963–972. https://doi.org/10.1145/3041021.3055135
- Danezis and Mittal (2009) George Danezis and Prateek Mittal. 2009. SybilInfer: Detecting Sybil Nodes using Social Networks. In 16th Network & Distributed System Security Symposium(NDSS). San Diego, California, USA, 1–15.
- Davis et al. (2016) Clayton Allen Davis, Onur Varol, Emilio Ferrara, Alessandro Flammini, and Filippo Menczer. 2016. BotOrNot: A System to Evaluate Social Bots. In Proceedings of the 25th International Conference Companion on World Wide Web. ACM Press, Montréal, Québec, Canada, 273–274. https://doi.org/10.1145/2872518.2889302
- Douceur (2002) John R Douceur. 2002. The Sybil Attack. In IPTPS ’01 Revised Papers from the First International Workshop on Peer-to-Peer Systems. Springer, London, England, 251–260.
- Echeverría and Zhou (2017) Juan Echeverría and Shi Zhou. 2017. Discovery, Retrieval, and Analysis of ’Star Wars’ botnet in Twitter. In Proceedings of the 2017 IEEE/ACM International Conference on Advances in Social Networks Analysis and Mining 2017. Sydney, Australia, 1–8. https://doi.org/10.1145/3110025.3110074
- Edwards et al. (2014) Chad Edwards, Autumn Edwards, Patric R. Spence, and Ashleigh K. Shelton. 2014. Is that a bot running the social media feed? Testing the differences in perceptions of communication quality for a human agent and a bot agent on Twitter. Computers in Human Behavior 33 (2014), 372–376. https://doi.org/10.1016/j.chb.2013.08.013
- Fawcett (2003) Tom Fawcett. 2003. ROC Graphs: Notes and Practical Considerations for Data Mining Researchers ROC Graphs : Notes and Practical Considerations for Data Mining Researchers. Technical Report. Intelligent Enterprise Technologies Laboratory, Palo Alto. 27 pages. https://doi.org/10.1.1.10.9777
- Ferguson (2017) Niall Ferguson. 2017. The False Prophecy of Hyperconnection: How to Survive the Networked Age. Foreign Affairs 96, 68 (2017), 8–23. https://doi.org/10.3868/s050-004-015-0003-8
- Ferrara et al. (2016) Emilio Ferrara, Onur Varol, Clayton Davis, Filippo Menczer, and Alessandro Flammini. 2016. The Rise of Social Bots. Commun. ACM 59, 7 (6 2016), 96–104. https://doi.org/10.1145/2818717
- Findlay (2018) Kyle Findlay. 2018. South Africans take Bell Pottinger’s interference personally: reactions to the PR company on Twitter. , 11 pages. https://bit.ly/2MFbTNa
- Fraser (2017) Andrew Fraser. 2017. TechCentral: We go inside the Guptabot fake news network. , 10 pages. https://bit.ly/2NxMRvK
- Gao et al. (2018) Peng Gao, Binghui Wang, Neil Zhenqiang Gong, Sanjeev R Kulkrani, Kurt Thomas, and Prateek Mittal. 2018. SybilFuse : Combining Local Attributes with Global Structure to Perform Robust Sybil Detection. (2018).
- Gerbaudo (2012) Paolo Gerbaudo. 2012. Tweets and the Streets: Social Media and Contemporary Activism. Pluto Press, London, England. 196 pages. https://doi.org/10.1017/CBO9781107415324.004
- Ghosh et al. (2012) Saptarshi Ghosh, Bimal Viswanath, Farshad Kooti, Naveen Kumar Sharma, Gautam Korlam, Fabricio Benevenuto, Niloy Ganguly, and Krishna Phani Gummadi. 2012. Understanding and combating link farming in the twitter social network. In Proceedings of the 21st international conference on World Wide Web - WWW ’12. Lyon,France, 61–70. https://doi.org/10.1145/2187836.2187846
- Gilani et al. (2017) Zafar Gilani, Ekaterina Kochmar, and Jon Crowcroft. 2017. Classification of Twitter Accounts into Automated Agents and Human Users. In Proceedings of the 2017 IEEE/ACM International Conference on Advances in Social Networks Analysis and Mining 2017. ACM, Sydney, Australia, 489–496. https://doi.org/10.1145/3110025.3110091
- Harris et al. (2008) John Harris, Jeffry L. Hirst, and Michael Mossinghoff. 2008. Combinatorics and Graph Theory. In Combinatorics and graph theory (Vol. 2, p. 139) (2 ed.). Springer, New York, NY, Chapter 1: Graph T, 1–30. https://doi.org/10.1007/978-0-387-79711-3
- Howard et al. (2011) Philip N Howard, Aiden Duffy, Deen Freelon, Muzammil Hussain, Will Mari, and Mrawa Mazaid. 2011. Opening closed regimes: what was the role of social media during the Arab Spring? Technical Report. 1–30 pages. https://doi.org/10.1007/s13398-014-0173-7.2 arXiv:gr-qc/9809069v1
- Italiano et al. (2012) Giuseppe F. Italiano, Luigi Laura, and Federico Santaroni. 2012. Finding strong bridges and strong articulation points in linear time. Theoretical Computer Science 447 (2012), 74–84. https://doi.org/10.1016/j.tcs.2011.11.011
- John (2018) Gramlich John. 2018. Q And A: How Pew Research Center identified bots on Twitter. http://www.pewresearch.org/fact-tank/2018/04/19/qa-how-pew-research-center-identified-bots-on-twitter/
- Kassambara (2017) Alboukadel Kassambara. 2017. Practical Guide to Cluster Analysis in R: Unsupervised Machine Learning (1 ed.). STHDA. 187 pages.
- Kwak et al. (2010) Haewoon Kwak, Changhyun Lee, Hosung Park, and Sue Moon. 2010. What is Twitter, a Social Network or a News Media ?. In Proceedings of the 19th international conference on World Wide Web (IW3C2). Raleigh, North Carolina, USA., 591–600. https://doi.org/10.1145/1772690.1772751
- Newman (2003) Mark E J Newman. 2003. Mixing patterns in networks. Physical Review E - Statistical Physics, Plasmas, Fluids, and Related Interdisciplinary Topics 67, 2 (2003), 13. https://doi.org/10.1103/PhysRevE.67.026126
- Newman (2010) Mark E J Newman. 2010. Networks: An Introduction. Oxford University Press, New York, NY. 1–784 pages. https://doi.org/10.1093/acprof:oso/9780199206650.001.0001
- Shao et al. (2018) Chengcheng Shao, Pik-Mai Hui, Lei Wang, Xinwen Jiang, Alessandro Flammini, Filippo Menczer, and Giovanni Luca Ciampaglia. 2018. Anatomy of an online misinformation network. PLoS ONE 13, 4 (2018), 1–23. https://doi.org/10.1371/journal.pone.0196087
- Sing et al. (2005) Tobias Sing, Oliver Sander, Niko Beerenwinkel, and Thomas Lengauer. 2005. ROCR: Visualizing classifier performance in R. Bioinformatics 21, 20 (2005), 3940–3941. https://doi.org/10.1093/bioinformatics/bti623
- Subrahmanian et al. (2016) V.S. Subrahmanian, Amos Azaria, Skylar Durst, Vadim Kagan, Aram Galstyan, Kristina Lerman, Linhong Zhu, Emilio Ferrara, Alessandro Flammini, and Filippo Menczer. 2016. The DARPA Twitter Bot Challenge. Computer 49, 6 (6 2016), 38–46. https://doi.org/10.1109/MC.2016.183
- Varol et al. (2017) Onur Varol, Emilio Ferrara, Clayton A. Davis, Filippo Menczer, and Alessandro Flammini. 2017. Online Human-Bot Interactions: Detection, Estimation, and Characterization. In Proceedings of the Eleventh International AAAI Conference on Web and Social Media (ICWSM 2017). Association for the Advancement of Artificial Intelligence, Montreal, Quebec, Canada, 280–289. http://arxiv.org/abs/1703.03107
- Viswanath et al. (2010) Bimal Viswanath, Ansley Post, Krishna P. Gummadi, and Alan Mislove. 2010. An analysis of social network-based Sybil defenses. In ACM SIGCOMM Computer Communication Review 2010. New Delhi, India, 363–374. https://doi.org/10.1145/1851182.1851226
- Wagstaff et al. (2001) Kiri Wagstaff, Claire Cardie, Seth Rogers, and Stefan Schroedl. 2001. Constrained K-means Clustering with Background Knowledge. In Proceedings of the Eighteenth International Conference on Machine Learning. Williamstown, MA, USA, 577–584. https://doi.org/10.1109/TPAMI.2002.1017616
- Wang et al. (2012) Gang Wang, Manish Mohanlal, Christo Wilson, Xiao Wang, Miriam Metzger, Haitao Zheng, and Ben Y. Zhao. 2012. Social Turing Tests: Crowdsourcing Sybil Detection. In arXiv preprint. http://arxiv.org/abs/1205.3856
- Wasserman and Faust (1994) Stanley Wasserman and Katherine Faust. 1994. Social Network Analysis: Methods and Applications (first ed.). Cambridge University Press, New York.
- Yang et al. (2013) Chao Yang, Robert Harkreader, and Guofei Gu. 2013. Empirical Evaluation and New Design for Fighting Evolving Twitter Spammers. IEEE Transactions on Information Forensics and Security 8, 8 (2013), 1280–1293. http://citeseerx.ist.psu.edu/viewdoc/download?doi=10.1.1.414.5888&rep=rep1&type=pdf
- Yang et al. (2012) Chao Yang, Robert Harkreader, Jialong Zhang, Seungwon Shin, and Guofei Gu. 2012. Analyzing spammers’ social networks for fun and profit: a case study of cyber criminal ecosystem on twitter. In WWW ’12: Proceedings of the 21st international conference on World Wide Web. Lyon,France, 71–80. https://doi.org/10.1145/2187836.2187847
- Yu et al. (2008) Haifeng Yu, Phillip B Gibbons, Michael Kaminsky, and Feng Xiao. 2008. SybilLimit: A Near-Optimal Social Network Defense against Sybil Attacks. In IEEE Symposium on Security and Privacy. 3–17. https://doi.org/10.1109/SP.2008.13
- Yu et al. (2006) Haifeng Yu, Michael Kaminsky, Philip B. Gibbons, and Abraham D. Flaxman. 2006. SybilGuard: Defending against sybil attacks via social networks. ACM SIGCOMM Computer Communication Review 36, 4 (2006), 267–278. https://doi.org/10.1109/TNET.2008.923723