Molecular Structure and Multi-Body Potential of Mean Force
in Silica-Polystyrene Nanocomposites
Abstract
We perform a systematic application of the hybrid particle-field molecular dynamics technique [Milano et al, J. Chem. Phys. 2009, 130, 214106] to study interfacial properties and potential of mean force (PMF) for separating nanoparticles (NPs) in a melt. Specifically, we consider Silica NPs bare or grafted with Polystyrene chains, aiming to shed light on the interactions among free and grafted chains affecting the dispersion of NPs in the nanocomposite. The proposed hybrid models show good performances in catching the local structure of the chains, and in particular their density profiles, documenting the existence of the “wet-brush-to-dry-brush” transition. By using these models, the PMF between pairs of ungrafted and grafted NPs in Polystyrene matrix are calculated. Moreover, we estimate the three-particle contribution to the total PMF and its role in regulating the phase separation on the nanometer scale. In particular, the multi-particle contribution to the PMF is able to give an explanation of the complex experimental morphologies observed at low grafting densities. More in general, we propose this approach and the models utilized here for a molecular understanding of specific systems and the impact of the chemical nature of the systems on the composite final properties.
I Introduction
Polymer composites containing nanosized particles are currently the object of a quite intensive investigation, carried out in the general perspective of generating new potential technologies Glotzer et al. (2017); Kumar et al. (2017). The interest in them comes from the possibility to control the effects that polymer/filler interactions have on the polymer chains, in order to improve the macroscopic material properties Koo (2016); Balazs et al. (2006); Brown et al. (2008). Polymer nanocomposites have been deeply investigated by theoretical approaches Hooper et al. (2004) and computer simulations Ndoro et al. (2011); Liu et al. (2011); Meng et al. (2013); Martin et al. (2015), beside a large variety of experimental techniques (see, for instance, Refs. Dukes et al. (2010); Xie et al. (2013); Tang et al. (2014)). As for theoretical descriptions of nanocomposites, most of recent studies have been focused on the density-functional theory (DFT) Patel and Egorov (2004) and on the Polymer Reference Interaction Site Model (PRISM) theory Schweizer and Curro (1987); Curro and Schweizer (1987): it was found that these approaches are able to reproduce local structure and interface properties observed in simulations Striolo and Egorov (2007); Egorov (2008) and experiments Allegra et al. (2008); Jancar et al. (2010); Ganesan and Jayaraman (2014). However, theoretical methods are typically developed for generic models and not made to take into account the chemical structure of a given compound. On the other hand, atomistic simulations, while providing accurate descriptions of nanocomposites (to quote few examples, see Refs. Barbier et al. (2004); Eslami et al. (2013); De Nicola et al. (2015); Karatrantos et al. (2015)), are typically limited to small polymer chain length and short timescales. In order to consider larger, properly relaxed, systems several specific coarse-grained (CG) models have been proposed Reith et al. (2003); Huang et al. (2010); Ghanbari et al. (2012); Shen et al. (2015); Shi et al. (2017). A further speed up of the simulation times can be obtained by combining the traditional molecular dynamics (MD) approaches with a field representation of the non-bonded interactions, following the self-consistent field theory approach Kawakatsu (2004): according to this description, the mutual interactions among particles are decoupled and replaced by a field representation. In such a way it is possible to obtain a hybrid particle-field model Milano and Kawakatsu (2009, 2010), allowing length and time scales large enough to successfully characterize complex systems, including polyelectrolytes Zhu et al. (2016), carbon nanotubes Zhao et al. (2016), polymer melts of with large molecular weight De Nicola et al. (2014) and nanocomposites De Nicola et al. (2016). A more general view on the possibility to employ hybrid models including chemical details can be found in Ref. Soares et al. (2017).
In the present study, we investigate the behavior of a CG model of a nanocomposite constituted by Silica nanoparticles (NPs) dispersed in a Polystyrene (PS) matrix by means of the hybrid particle-field molecular dynamics representation (MD-SCF) De Nicola et al. (2016). The specific choice of this system is lead by the large amount of experimental studies characterizing structural and thermodynamic properties of this composite Lan et al. (2007); Akcora et al. (2009); Chevigny et al. (2010, 2011); Sunday et al. (2012). The main target of this study is to provide an accurate representation of the effective interactions among NPs in the polymer melt; this is an issue of crucial importance for the dispersion state of the NPs, that is in turn the main factor determining the final properties of the polymer nanocomposite. To this end, we first validate the MD-SCF approach by comparing our results with previous MD investigations of the same system Ghanbari et al. (2013); Voyiatzis et al. (2016); Pfaller et al. (2016); Rahimi et al. (2012); Ndoro et al. (2012); Ghanbari et al. (2012); Ndoro et al. (2011), in particular by ascertaining the accuracy of the MD-SCF scheme in reproducing the structural properties of polymer chains. Once validated our approach, we use the proposed method for calculating the potential of mean force (PMF) between a pair of NPs (bare or grafted with further PS chains) as a function of chain length and grafting density. Such an issue has been investigated in the past by means of several approaches, including DFT Frischknecht and Yethiraj (2011) and PRISM theory Hooper et al. (2004); Martin et al. (2013) and MD simulations Cerdà et al. (2003); Smith et al. (2003); Marla and Meredith (2006); Smith and Bedrov (2009); Lo Verso et al. (2011); Meng et al. (2012); Baran and Sokolowski (2017). In particular, previous numerical investigations have highlighted the effects due to the strength of attractive interactions among polymer and NPs Smith et al. (2003); Marla and Meredith (2006), the role played by the NP size and curvature on the PMF Lo Verso et al. (2011); Cerdà et al. (2003), the importance of the ratio between free and grafted chain lengths Smith and Bedrov (2009) and the influence of grafting density and polymer matrix length on the effective NP-polymer interactions Meng et al. (2012). However, all these simulation works have been generally devoted to study generic models for polymers and NPs, based on pearl-necklace or bead-spring representations; here we deal with a specific and realistic model of nanocomposite, where the chemical detail is properly taken into account. In addition, we have explicitly included in the calculation of the PMF the contribution due to multi-particle effects such as three-body interactions: the importance of multi-particle terms for a proper description of the PMF has been already highlighted in experimental works (see, for instance, Ref. Akcora et al. (2009)) when facing the issue of self-assembly of grafted NPs in polymer melts. In the same context, previous theoretical works based on the DFT Frischknecht and Yethiraj (2011) have also proved that three-body interactions cannot be neglected in a proper description of the PMF between NPs in polymer melts, since their contribution can be significant. So far, explicit calculations of multi-body contributions to the total PMF by means of molecular simulations have been performed mainly for studying the formation of small clusters of nonpolar solutes in water Rank and Baker (1997), and in particular the effects due to cooperativity in hydrophobic association Czaplewski et al. (2000, 2003). An accurate treatment of the multi-body effects also in simulation studies of polymer nanocomposites is hence highly desirable. Finally, molecular weights up to 1000 monomeric units in a single PS chain have been considered, to make the system as realistic as possible.
Summarizing, in the present work we: I) validate MD-SCF predictions for the local structure of PS chains by comparing our results with previous MD studies; II) exploit our approach for studying the PMF between two NPs in a PS melt as a function of chain length and grafting densities; III) estimate the three-body contribution to the total PMF, discussing this effect in comparison with simulation and experimental data on Silica NPs dispersed in PS and gaining more detail inside the effective interactions between NPs.
All details concerning the CG models and the simulation procedure are provided in the Model systems and Methods sections respectively, while results concerning the above said points are presented in the Results and Discussion section. Final remarks are given in the Conclusions section.
II Model systems
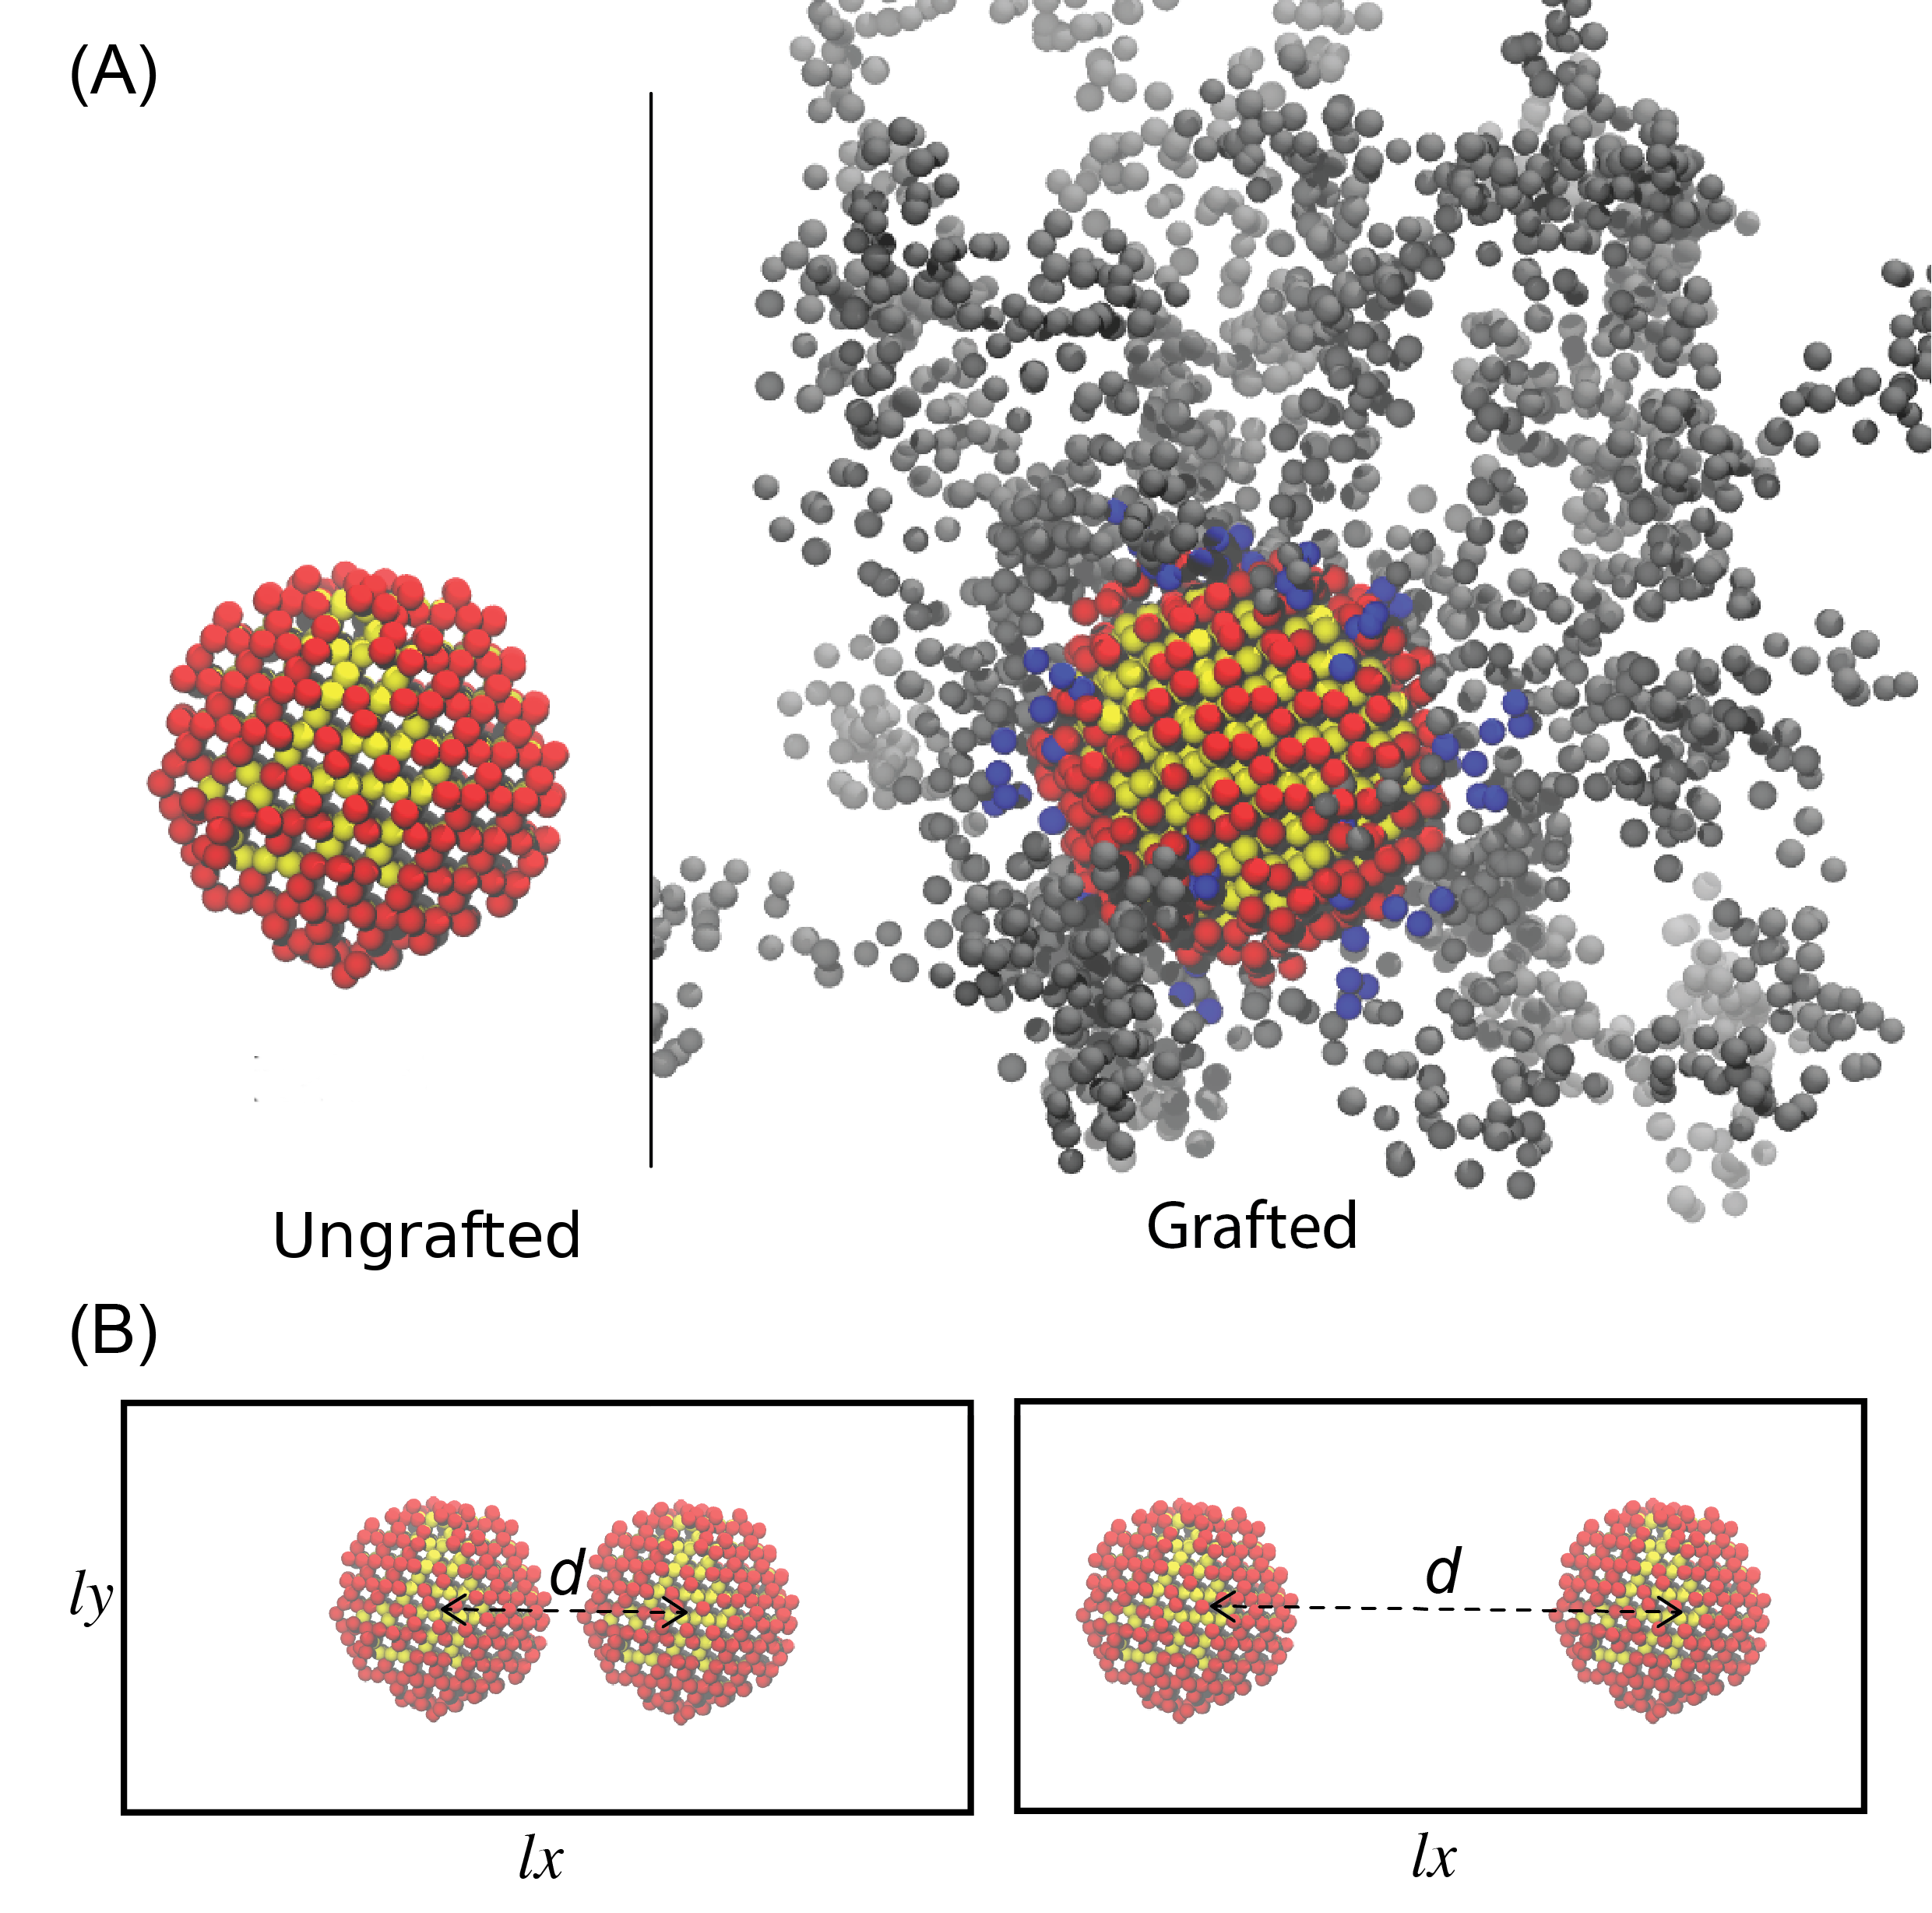
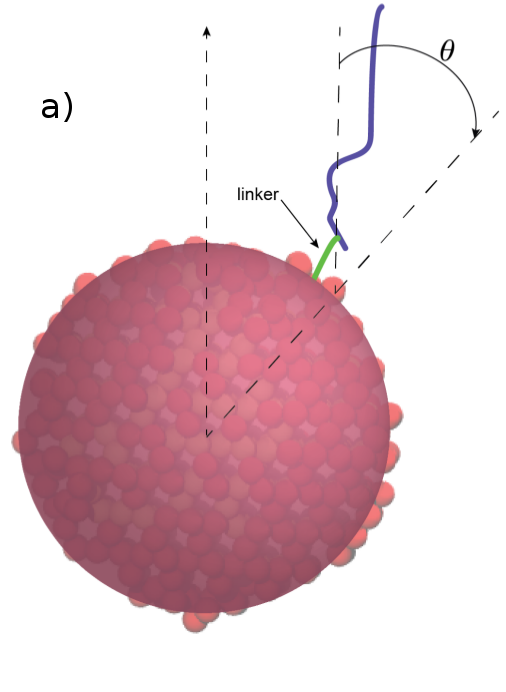
The CG models that we adopt for studying Silica NPs embedded in PS melts have been introduced by Qian and coworkers Qian et al. (2008) and successfully implemented in Refs. Ghanbari et al. (2012); De Nicola et al. (2016): each repeating units of atactic PS is represented as one bead located at the repeating unit center-of-mass. Two different beads (R and S) account for the chirality of the asymmetric carbon. As for the NP, the effective bead is centered on the silicon atom position and represents one unit. The total mass of the hydrogen atoms is distributed over all the CG beads of the NP. All simulated NPs have a diameter of 4 nm and contain 873 beads. In addition, we also consider systems where some PS chains are grafted to the NP surface. Following the prescription by Ghanbari and coworkers Ghanbari et al. (2012), each grafted chain is attached to the NP surface through a linker unit, that is divided into four CG beads of two kinds with the same mass. A representative snapshot of ungrafted and grafted NPs is shown in Fig. 1 (panel a), along with the schematic procedure for calculating the two-body PMF (panel b). Further details on this CG representation and its validation can be found in Refs. Ghanbari et al. (2012); De Nicola et al. (2016).
It is worth noting that, as already pointed out in Ref. De Nicola et al. (2016), the periodic interstitial structure of the NP surface gives rise to an oscillating density field inside the NP core; as a consequence, the incompressibility condition can lead to an unphysical presence of PS chains inside the NP. This is true in particular for ungrafted NPs, whereas for grafted NPs the presence of the external chains precludes the free chains to get close to the NP surface. To counteract this effect, the NP density is described by an analytical effective field: such an approach has been applied also in SCF theory to deal with excluded volume interactions of solid NPs Sides et al. (2006). Here we model the NP density field as a combination of two different splines: a first, quadratic function describes the density field inside the NP core, and a second, cubic function prevents the external chains from overlapping the NP. These functions can be calculated by fixing four parameters: the NP radius , the maximum value of the density field inside the NP (), the value of the density field at the NP surface () and the interval giving the width of the NP density profile (i.e. how fast the NP density field goes from at to zero at ). In our model, , , and . Spline coefficients are obtained by imposing these conditions and continuity of NP density and its derivative. Further details can be found in Ref. De Nicola et al. (2016).
III Methods
The simulation approach that we adopt in the present study for studying CG systems is based on a combination of a standard molecular dynamics approach and a self-consistent field theory Kawakatsu (2004) for the calculation of non-bonded potentials. The resulting scheme is known as hybrid particle-field model Milano and Kawakatsu (2009): according to such an approach, the hamiltonian of a system comprised by molecules can be split as:
| (1) |
where represents a point in the phase space and the symbol indicates that a given quantity is a function of the microscopic state corresponding to . In Eq. 1, is the Hamiltonian of a system with molecules experiencing only intramolecular interactions, whereas is the contribution due to the other non-bonded interactions. The latter can be calculated as an external potential on single particles, which is due to the density field. The details of the derivation of can be found elsewhere Milano and Kawakatsu (2009). According to this derivation, the mean field solution for the potential acting on a particle of type at position , is:
| (2) |
where is the Boltzmann constant, is the temperature, are the mean field parameters for the interaction of a particle of type with the density field due to particles of type and the second term on the right-hand side of Eq. 2 is the incompressibility condition, being the compressibility. Also, and are the density functions of the CG beads of type and , respectively. The value of has been fixed to 5.25, in agreement with a previous MD-SCF study of the same model De Nicola et al. (2016).
All CG simulations have been performed by means of the OCCAM code, whose details can be found in Ref. Zhao et al. (2012); in particular, MD-SCF simulations have been performed in the NVT ensemble, with the temperature (fixed at 590 K) controlled by the Andersen thermostat and a time step of 4 fs. All particles have been enclosed in a cubic simulation box with periodic boundary conditions: values of box sizes are reported in Tab. 1. In the implementation employed here, we have divided the simulation box into cubic cells of size and 1.2 nm. The total force acting on each particle is the sum of intramolecular interactions (obtained by means of tabulated potentials) and contributions due to its interactions with the density fields.
| Grafting density | Grafted chains | Grafted chains | Free chains | Free chains | Box length |
| () | () | length () | () | length () | () |
| 0.5 | 25 | 80 | 808 | 20 | 15.20 |
| 0.5 | 25 | 80 | 24 | 2400 | 22.40 |
| 1.0 | 50 | 20 | 177 | 20 | 9.70 |
| 1.0 | 50 | 80 | 708 | 20 | 15.18 |
| 1.0 | 50 | 80 | 177 | 80 | 15.07 |
| 1.0 | 50 | 80 | 88 | 160 | 15.04 |
| 1.0 | 50 | 80 | 24 | 2400 | 22.55 |
As for the calculation of the two-body PMF, for each system we have prepared a set of 30 independent initial configurations, each one corresponding to a pair of NPs placed at a fixed distance from each other and embedded in the polymer matrix. Such initial configurations have been built by using the Packmol program Martinez et al. (2009). One simulation has been performed for each configuration, where the NPs were allowed to freely rotate but not to translate, in order to keep their mutual distance fixed. Forces on the centers of mass of the two NPs have been computed each 0.4 ps and averaged over 80 ns. Convergence has been ensured by verifying that the average values of the forces do not change anymore up to the first significant figure. If not explicitly reported in the figures, error bars corresponding to standard deviations are smaller than symbol sizes of the corresponding curves. The resulting PMF has been calculated according to the equation:
| (3) |
where is the interparticle distance, ranging in the interval. In our simulations, nm and nm; therefore is coincident with the NP diameter, while indicates an interparticle distance where the potential can be confidently assumed equal to zero. In all simulations, distances are sampled with a step of 0.2 nm and the numerical integration is performed by employing the trapezoidal rule.
IV Results and Discussion
IV.1 Relaxation times and molecular structure of polymer chains
The main advantage of the hybrid particle-field scheme is that non-bonded interactions are calculated among single particles and an external potential. Since such interactions constitute the computationally most intensive part of MD simulations, even nanocomposites containing NPs and polymers with high molecular weights can be well relaxed De Nicola et al. (2014, 2016).

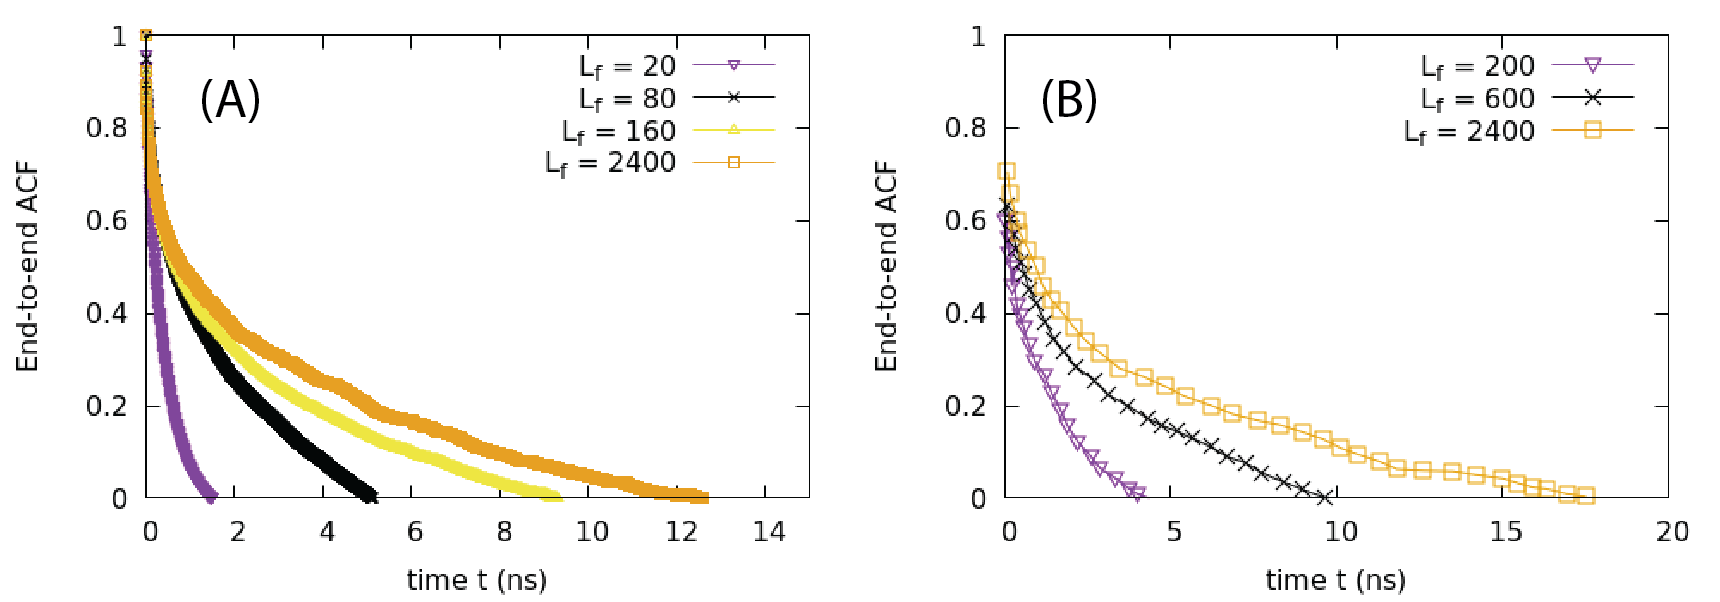
The complete collection of systems investigated by means of MD-SCF simulations is reported in Tab. 1: in all cases there is one NP in the PS melt, grafted with other PS chains of variable length. We consider several values of free and grafted chain length ( and , respectively) for two different grafting densities , corresponding to two different numbers of grafted chains . The number of free chains is also allowed to vary. Relaxation times and local structure of free and grafted chains are collectively reported in Fig. 2: specifically, we show in the top panels the autocorrelation function (ACF) of the end-to-end vector of free chains of variable length embedding a single grafted NP with chains/nm2 and . The simulation time required to obtain an independent chain configuration is equivalent to the time that the corresponding end-to-end vector ACF needs to decay to zero. Even for long PS chains () this time is less than 13 ns, which indicates the efficiency of the MD-SCF approach. In order to investigate the role played by the presence of the grafted chains on the relaxation times of the free chains we have compared our results (panel a) with previous calculations made for ungrafted NPs De Nicola et al. (2016) (panel b). The comparison is purely indicative, since the specific values of are not the same, but it seems to suggest that the presence of grafted chains increases the relaxation times of the free chains. A noticeable exception is found for , where this trend is reversed: this can be explained in terms of repulsive interactions among free and grafted chains, this repulsion becoming stronger upon increasing and , hence giving rise to a faster chain relaxation.
| End-to-end (free) | End-to-end (grafted) | |||||||
|---|---|---|---|---|---|---|---|---|
| 0.5 | 80 | 808 | 20 | 0.909 0.002 | 2.4 0.16 | 2.039 0.008 | 6.5 0.5 | |
| 0.5 | 80 | 24 | 2400 | 8.06 0.02 | 2.808 0.004 | 10.2 0.21 | 8.2 0.16 | |
| 1.0 | 20 | 177 | 20 | 0.908 0.005 | 0.93 0.01 | 2.02 0.02 | 2.25 0.06 | |
| 1.0 | 80 | 708 | 20 | 0.916 0.002 | 2.41 0.07 | 2.055 0.009 | 6.3 0.27 | |
| 1.0 | 80 | 177 | 80 | 1.99 0.02 | 2.49 0.03 | 4.56 0.07 | 6.6 0.14 | |
| 1.0 | 80 | 88 | 160 | 2.83 0.05 | 2.3 0.13 | 5.9 0.20 | 6.2 0.39 | |
| 1.0 | 80 | 24 | 2400 | 8.42 0.02 | 2.51 0.05 | 10.5 0.31 | 7 0.17 |
|
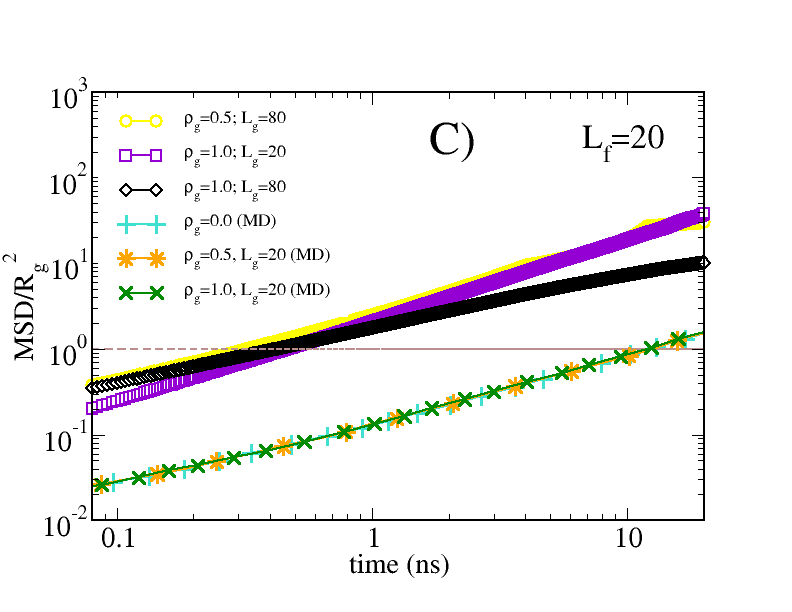
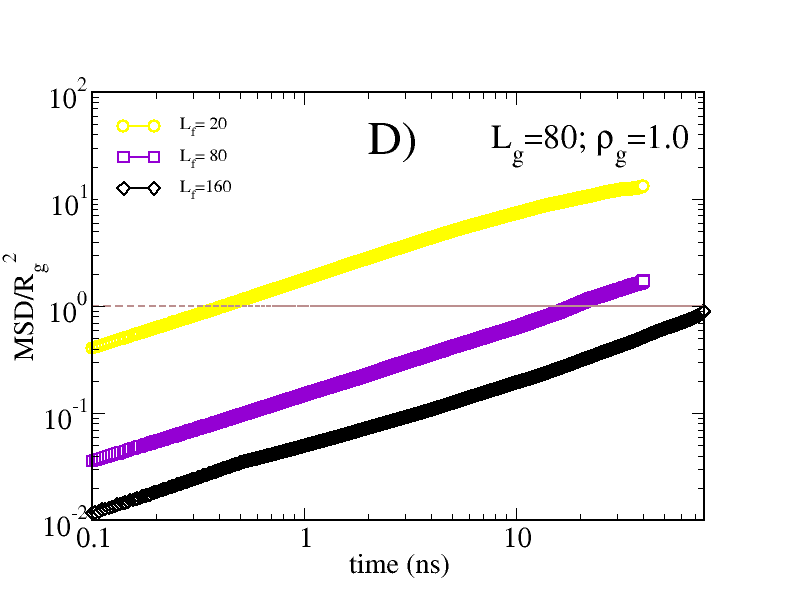
Further indication on the relaxation time of PS chains can be gained by calculating the MSD, since, following Ref. De Nicola et al. (2016), one can assume that the equilibration procedure is effective if each chain moves its center of mass by at least its gyration radius. In the bottom panels of Fig. 2 we show the time dependence of the MSD (divided by ) for a fixed with various and (panel c) and for fixed chains/nm2 and with various (panel d). In panel (c) we also report a comparison with bulk MSD values obtained in previous atomistic MD simulations of the same system Ndoro et al. (2012) for and various . For the MD-SCF approach is faster than standard MD simulations of almost two order of magnitude in relaxing the chains: this is due both to the speed up given by the field representation and to the adoption of CG models instead of atomistic representations. In addition, it is worth noting that in MD-SCF simulations there is a (slight) dependence of the MSD on the grafting density. In MD simulations this dependence is not observed, but this is due to the fact that in the figure only the bulk values of free chains are reported; as stated in Ref. Ndoro et al. (2012), the MSD calculated for chains close to the NP surface depends on , as observed also in our results. Finally, the increase of the MSD with is reported in Fig. 2d: as already known for Gaussian polymer chains, MSD scales as even in presence of a grafted NP; according to MD-SCF approach, chains containing up to 160 beads can be relaxed within 80 ns. Further evidence of the speed-up of hybrid simulations in comparison with the standard MD approach in properly relaxing polymer melts and nanocomposites can be found in Refs. De Nicola et al. (2014, 2016)
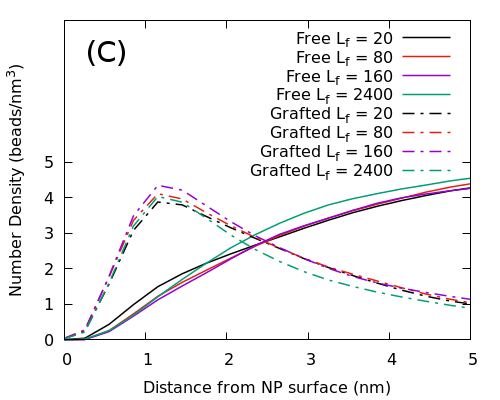
The bead number density of free and grafted chains as a function of the distance from the NP surface is reported in Fig. 3. In particular, the effect of increasing on the density profile of short () and long () free chains is investigated in panels (a) and (b), respectively, while the role played by the free chain length is analyzed in panel (c). It emerges that upon increasing the peak of the grafted chains distribution increases, while that of free chains decreases; also, for low distances ( nm) from the NP surface, there is a slight drop of the bead number density of free chains when increases, whereas this behavior is reversed for grafted chains. At higher distances, the number density keeps almost constant. The picture is compatible with the known “wet-brush-to-dry-brush” transition, observed in both experimental Chevigny et al. (2010) and numerical Ndoro et al. (2011); Ghanbari et al. (2012) studies of similar systems, and corresponding to the progressive expulsion of the free chains from the grafted corona when the grafting density increases. It is also worth noting that both the existence of a crossover distance (2.5 nm in our model) and the dependence of the transition on and not on have been documented in Refs. Ndoro et al. (2011); Ghanbari et al. (2012).
IV.2 Chains extension and orientation
The investigation of the chain structure is completed by analyzing their extension and spatial arrangement. Gyration radii and end-to-end distances of free and grafted chains for progressively higher and are reported in Tab. 2, where and label the gyration radius of free and grafted chains, respectively. Neither the gyration radii nor the end-to-end distances depend on the grafting density, since their values are practically unchanged upon increasing from 0.5 to 1.0 chains/nm2; on the other hand, and the end-to-end distance of free chains significantly increase upon increasing , as can be expected. This is not the case of and the end-to-end distance of grafted chains, whose values are almost constant regardless of the specific values of and .
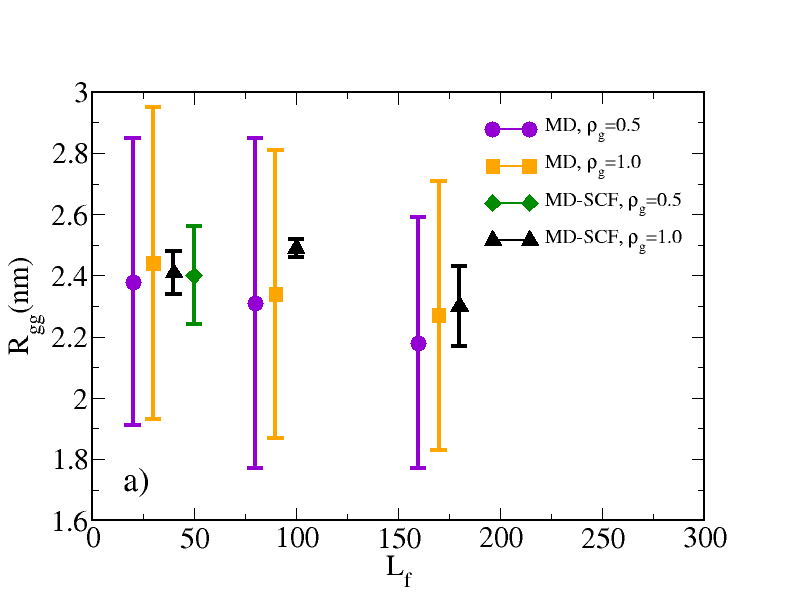
MD-SCF results for the radii of gyration of grafted chains are assessed against MD simulations of the same CG model Ghanbari et al. (2012) in Fig. 4a: it turns out that MD-SCF results are in agreement with MD data in providing the independence of on both and . In addition, it is worth noting that the error bars of MD data are systematically higher than those of MD-SCF simulations, this suggesting the capability of this approach to provide more precise estimates of structural parameters.
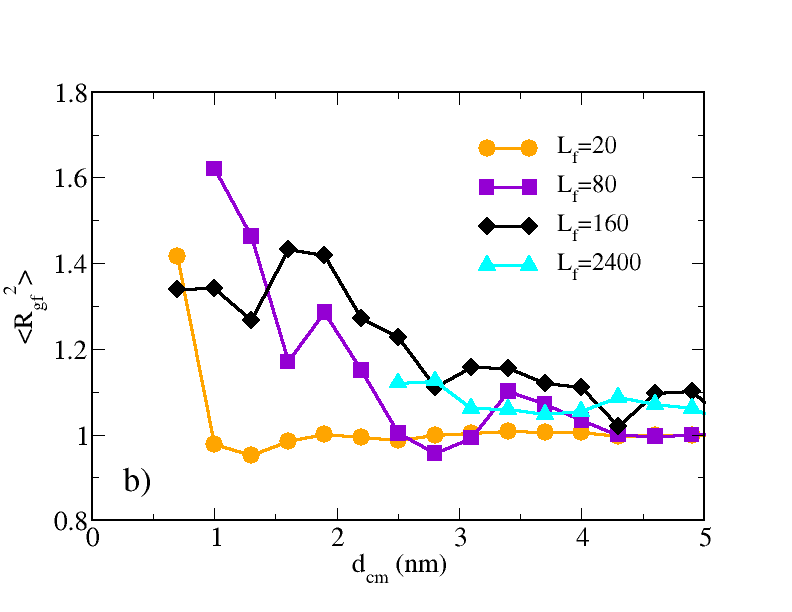
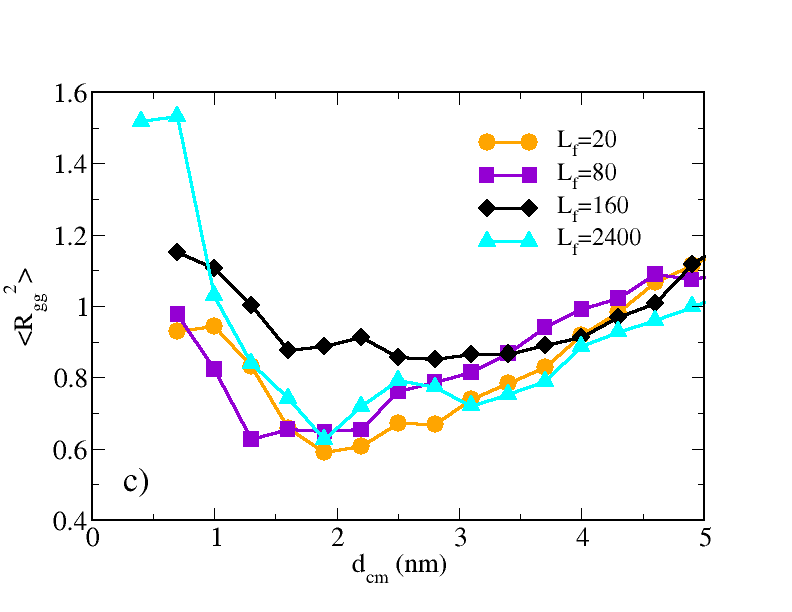
The dependence of the gyration radius on the distance between the centers of mass of the chains and the surface of the NP is shown in panels (b) and (c) of Fig. 4. (panel b) remarkably increases for at short : this circumstance suggests that in such conditions the free chains are flattened against the NP surface. This effect is observed only for small , since the NP does not provide enough surface area for long chains to be flattened against; the same picture emerged also in previous MD studies of the same CG system Ghanbari et al. (2012). A different trend is observed for grafted chains (Fig. 4c): in this case, increases with for chains in close contact to the NP surface. This trend indicates that for high , grafted chains assume stretched configurations, since they are pushed toward the NP surface by the surrounding free chains. The rise of for is then followed by a decay, with a minimum observed at , which is in turn followed by a new rise for higher distances. Hence, in comparison with free chains, the conformations of grafted chains appear more dependent on , this dependence becoming particularly enhanced for .
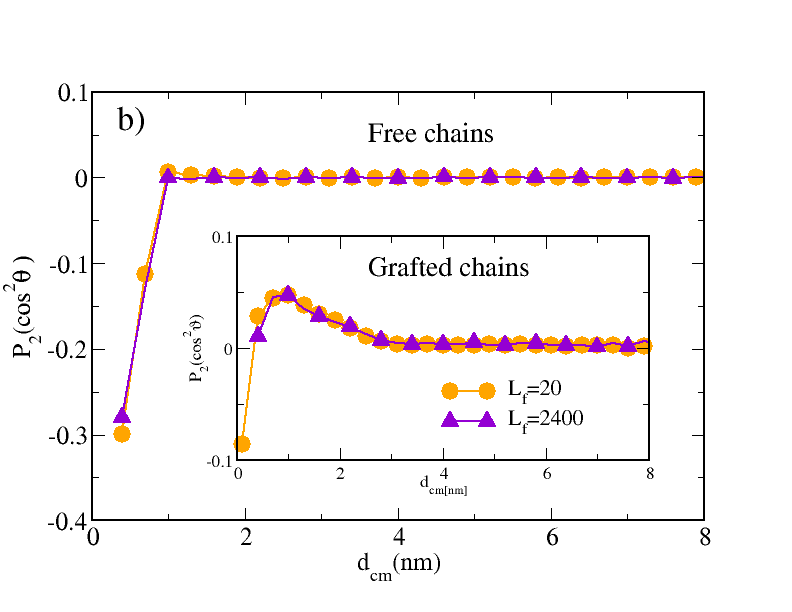
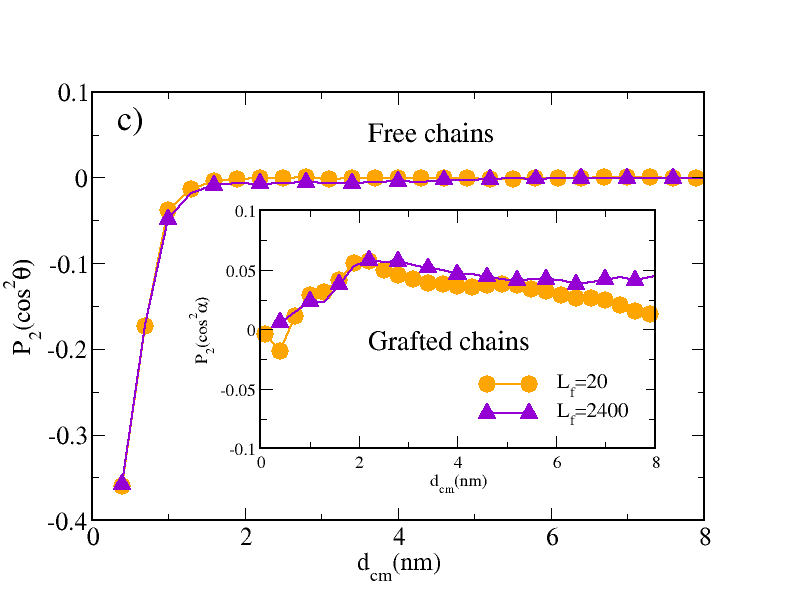
Beside the elongation of free and grafted chains, we also investigate their orientation as a function of their distance from the NP surface. We use the second Legendre polynomial defined as:
| (4) |
where is the angle between the NP-surface normal and some vector of interest. In Fig. 5a we show a schematic representation of such an angle when the vector of interest joints nearest neighbours (1-2) or next-nearest neighbours (1-3). Results for for free and grafted chains are reported in panels (b) and (c) of Fig. 5 for all 1-2 and 1-3 segment pairs. The figure shows that the distributions are independent of the length of the free chains, since the 1-2 and 1-3 inter-bead vectors are governed by local length scales Ghanbari et al. (2012); Ndoro et al. (2011), not by the chain size. Segment pairs which get very close to the NP surface ( nm) orient parallel to it (and perpendicular to the normal, whence ). Above this distance they are randomly oriented (). The transition is sharper for 1-2 vectors (Fig. 5b) than for 1-3 vectors (Fig. 5c). For grafted chains we find an intermediate region (around 3-4 nm) with a very small preference of perpendicular orientation with respect to the surface. These vectors connect one monomer, which is adsorbed on the surface, to one in the layer above. Therefore the vector connecting them points away from the surface. These calculations reproduce very well the findings of full MD simulations Ghanbari et al. (2012); Ndoro et al. (2011).
In summary, comparing our results with previous simulation studies with a full particle-particle potential Ndoro et al. (2011); Ghanbari et al. (2012), we observe that all essential features characterizing the nanocomposite are well reproduced within the hybrid particle-field approach. In addition, the possibility to fully relax the systems even for long polymer chains paves the way for the investigation of equilibrium properties, very hard to describe with the traditional simulation approaches. In particular, the behavior of one of such properties, the PMF, is the object of a detailed investigation in the following subsections.
IV.3 Two-nanoparticles interactions
| Grafting density | Grafted chains | Grafted chains | Free chains | Free chains |
| () | () | length () | () | length () |
| 0 | 0 | - | 1044 | 20 |
| 0 | 0 | - | 104 | 200 |
| 0.5 (+) | 25 | 80 | 854 | 20 |
| 1.0 () | 50 | 20 | 944 | 20 |
| 1.0 () | 50 | 80 | 644 | 20 |
| 0.5 () | 25 | 80 | 17 | 1000 |
| 1.0 () | 50 | 20 | 19 | 1000 |
| 1.0 () | 50 | 80 | 13 | 1000 |
| 0.04() | 2 | 40 | 1028 | 20 |
| 0.1 () | 5 | 80 | 995 | 20 |
| 0.4 () | 20 | 20 | 99 | 200 |
The total collection of the investigated systems for the calculation of the two-body PMF between a pair of ungrafted or grafted NPs is reported in Tab. 3: for clearly identifying the various cases, we have labeled each system with a different symbol. Note that the simulation box has been taken rectangular, with the long side oriented along the axis connecting the centers of mass of the two NPs. In order to obtain the full interaction, we have first calculated the interaction between the cores of the two NPs by performing all-atom MD simulations in the vacuum and comparing the results with an analytical theory developed by Hamaker Hamaker (1937) (see the Supporting Information), following the procedure described and validated in Ref. Munaò et al. (2018).
|
|
|
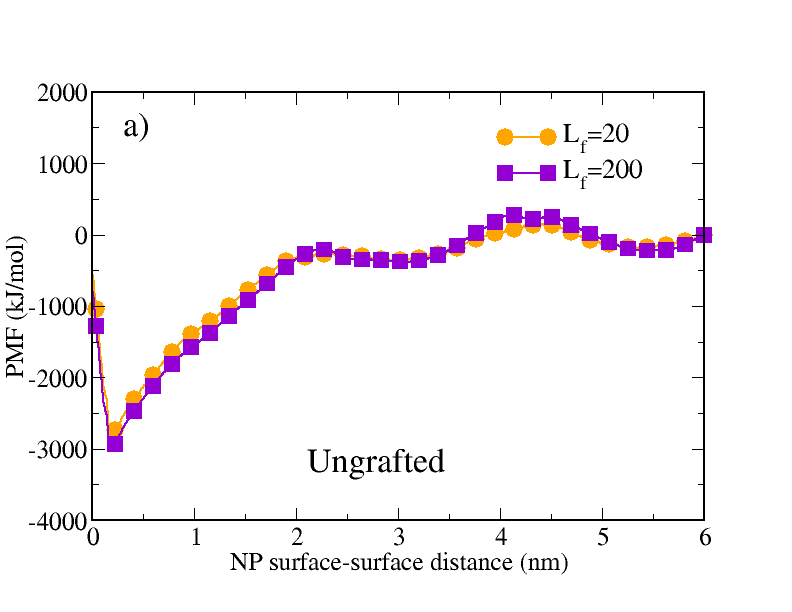
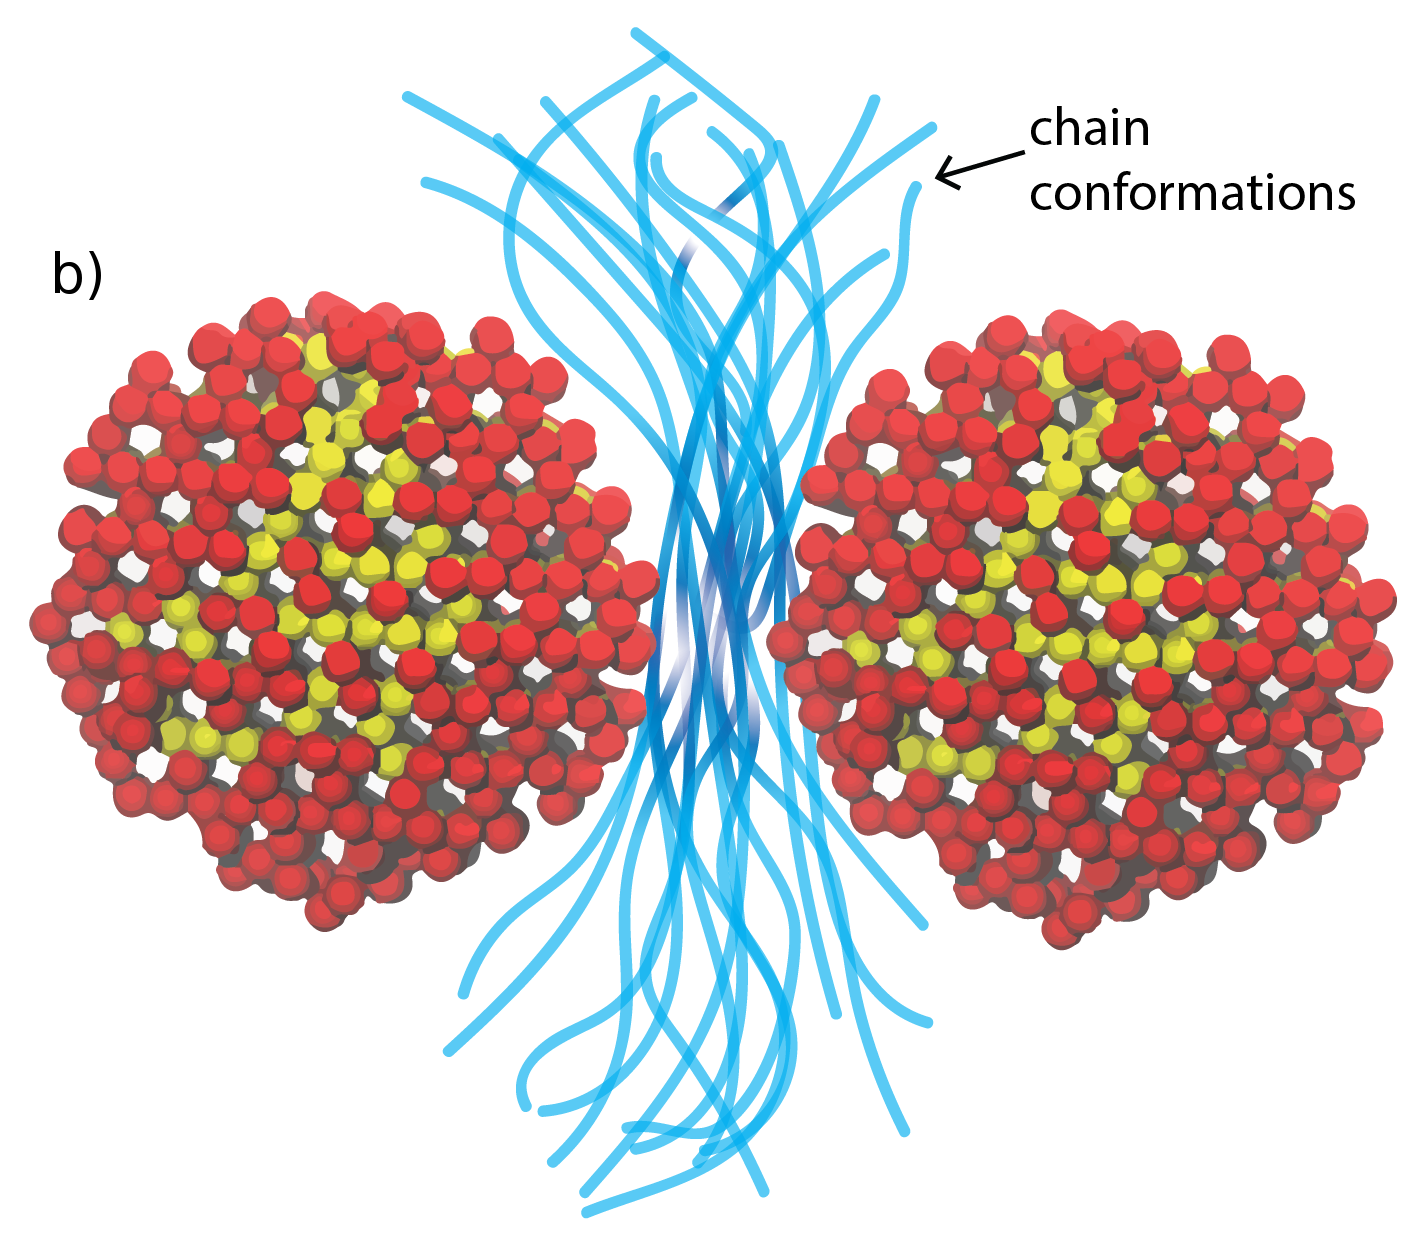
The two-body PMF between ungrafted and grafted NPs included in a PS matrix of variable chain length are reported in Fig. 6. In the ungrafted case (panel a) the interaction is strongly attractive and independent on the chain length: this behavior is in agreement with previous DFT Frischknecht and Yethiraj (2011); Patel and Egorov (2004) and PRISM Hooper et al. (2004) studies of the PMF in simple CG models and can be understood in terms of chains confinement: in panel (b) we show a cartoon representing several configurations of a single chain confined between the NPs for a interparticle separation of 1 nm.
b)
As visible, in the confinement zone the chain is considerably compressed, whereas outside this zone it is able to explore a larger variety of geometrical configurations. Therefore, chains can be arranged between the two NPs only by assuming extended conformations: the high entropic penalty of this conformation gives rise to a strong attraction between the NPs. Upon increasing the interparticle distance, a progressively higher number of chains can be confined in a more coiled states and the attraction diminishes. It is also worth noting that the PMF oscillates until reaching the zero value with a period corresponding to the radius of a NP. This is in agreement with previous theoretical Hooper et al. (2004); Hooper and Schweizer (2005); Frischknecht and Yethiraj (2011) and simulation Bedrov et al. (2003) studies, where it was found that oscillations develop when the polymer chains are confined between the NPs and the regions of perturbed polymer density around each NPs begin to overlap. More specifically, the oscillatory behavior indicates a correlation between the structure of the polymer in the interparticle region and matrix-induced NP-NP interactions. For particles in close contact, oscillations can not develop and a monotonic decay toward strongly negative values of the PMF is found, as expected for high NP-PS repulsive interactions.
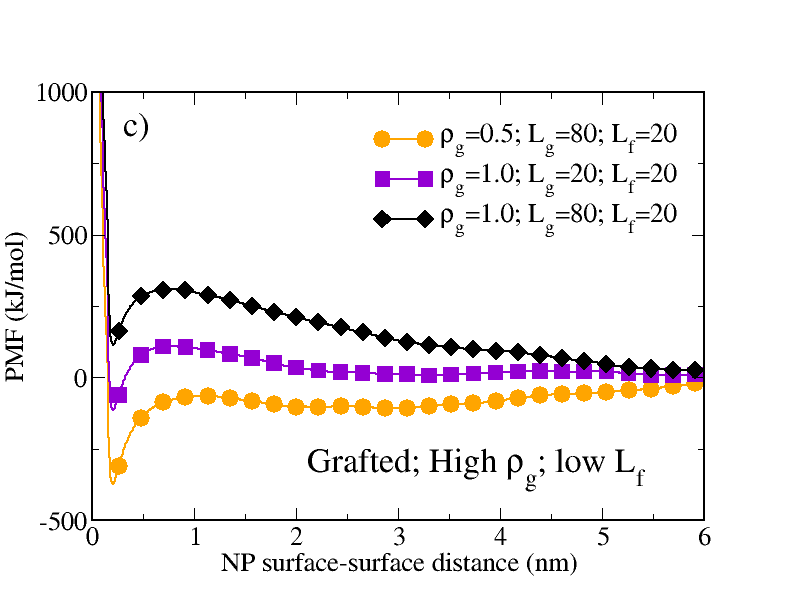
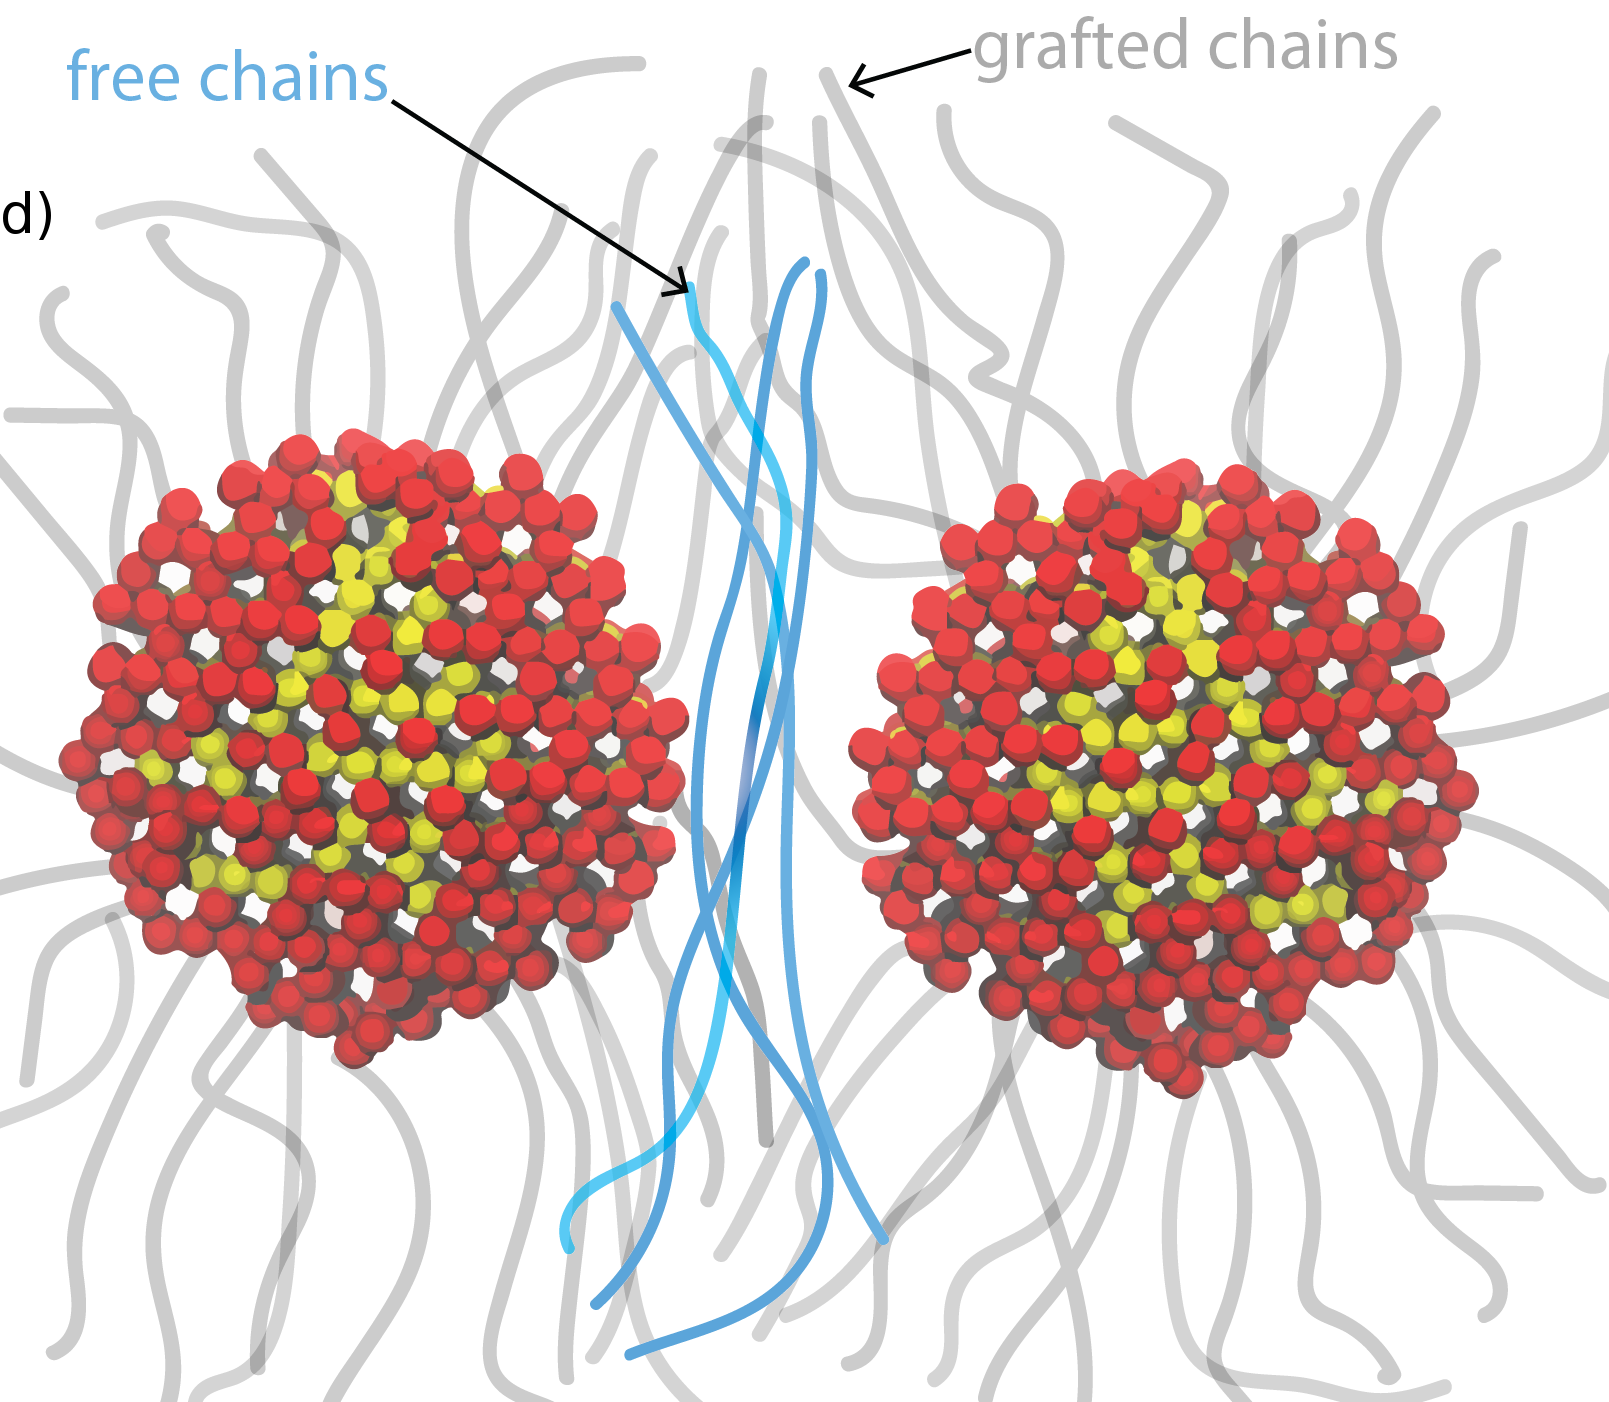
A different scenario is observed for the grafted cases: for high grafting densities and low molecular weigths of the free chains (panel c) the PMF is mainly repulsive, such repulsion becoming stronger upon increasing or . The cartoon reported in panel (d) clarifies the origin of the NP-NP repulsion: in comparison with the ungrafted case, now a large number of grafted chains are forced to be confined between the two NPs; even if a small number of free chains can still be confined, the available space contains especially the grafted ones, that push the two NPs away from each other, hence generating the repulsion between them.
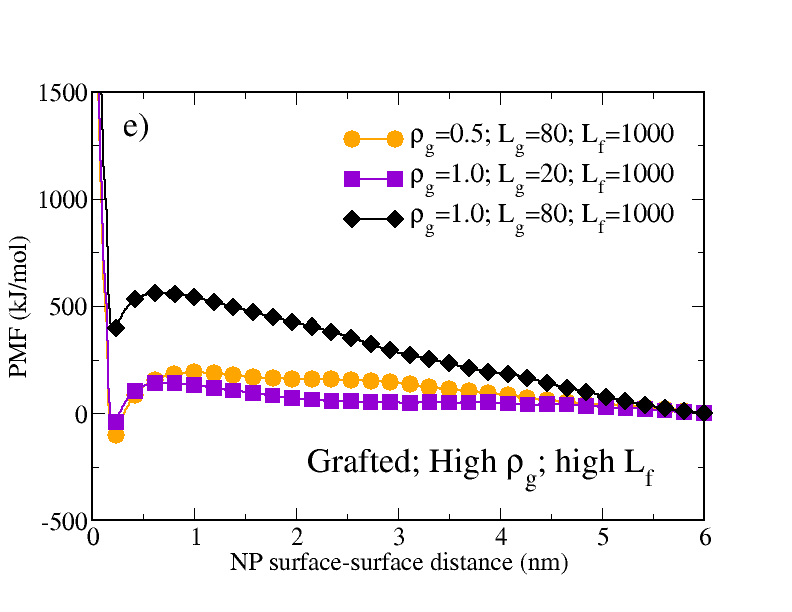
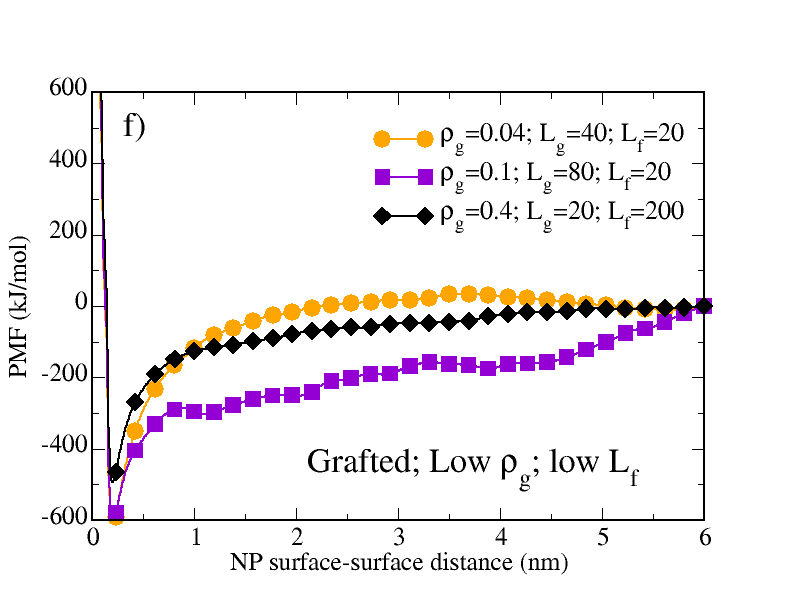
If the free chain length increases (panel e), the repulsion between the NPs increases in turn, and this is especially clear for chains/nm2 and : in fact the minimum of the total PMF, previously found at -380 kJ/mol, is now observed at -140 kJ/mol. As a consequence, the total PMF for chains/nm2 and and for chains/nm2 and are now almost coincident. The increase of the short-range repulsion between a pair of grafted NPs upon increasing and is also in agreement with previous simulation studies of bead-spring models Smith and Bedrov (2009); Meng et al. (2012). The analysis is completed by exploring cases corresponding to low grafting densities and free chain lengths (panel f): unlike what has been observed so far, the PMF shows a pronounced attractive well, keeping negative values for almost the entire range of interparticle distances. The attraction strength increases upon decreasing , with the PMF monotonically going to zero, except for chains/nm2, where a maximum is observed for an interparticle distance of 4 nm. We infer that such a feature could be reminiscent of the oscillating behavior observed for ungrafted NPs, since the grafting density is quite low. For we have also verified that upon decreasing from 200 to 20, no qualitative difference in the PMF are observed (see the Supporting Information).
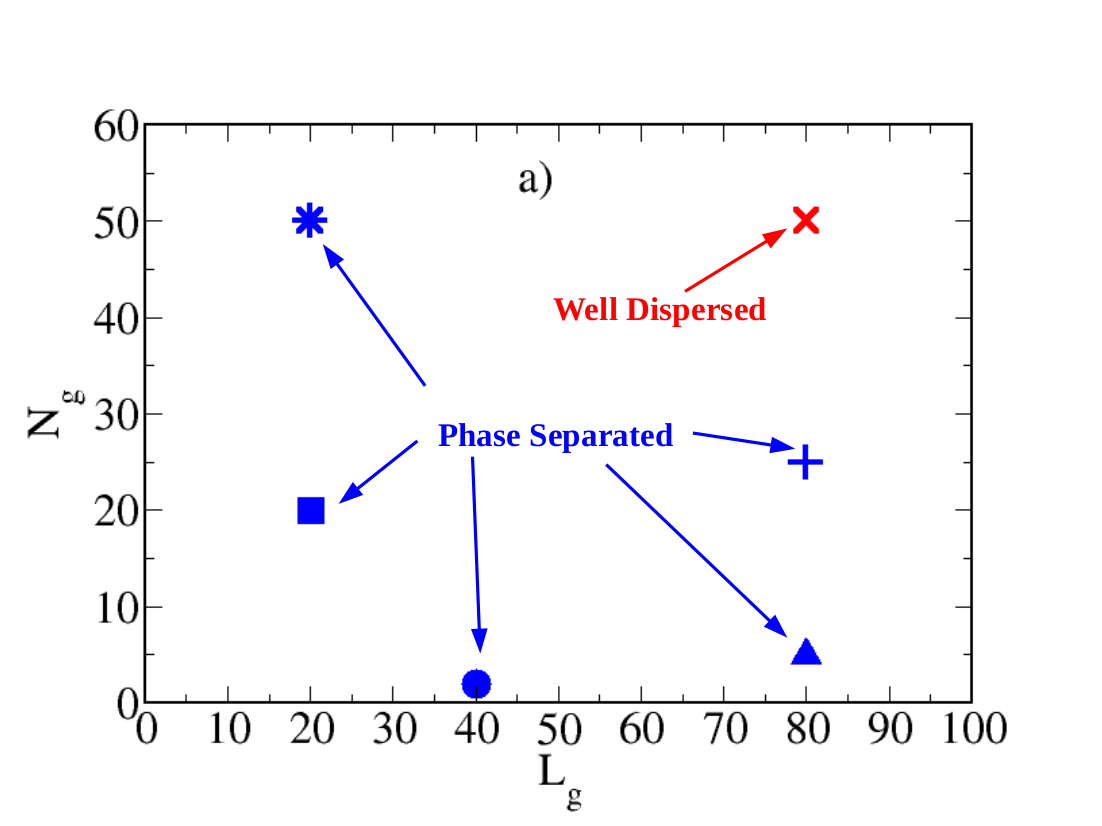
By collecting these results, it emerges that the molecular weight of the free chains does not significantly influence the PMF. On the other hand, the grafting density plays a critical role in determining the behavior of the effective interactions between grafted NPs: for high the two-body PMF is always repulsive, whereas for low it becomes attractive. As a consequence, a system comprising several NPs in a PS melt should be well dispersed in the first case and phase-separated in the second case. This assumption can be verified by calculating the second virial coefficient from the PMF, since positive values of identify regions of the phase diagram where repulsive contributions are dominant, whereas its negative values indicate that attractive interactions prevail. The general definition of the second virial coefficient for a potential without an angular dependence can be written as McQuarrie (1976):
| (5) |
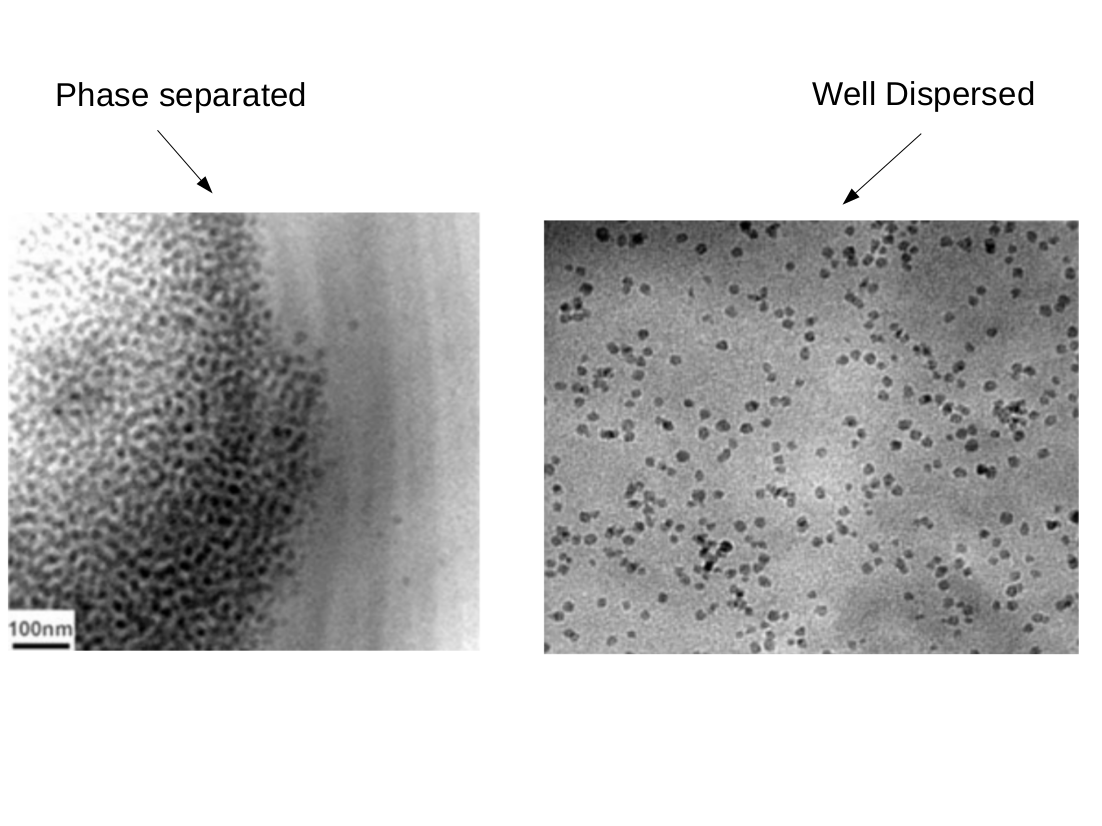
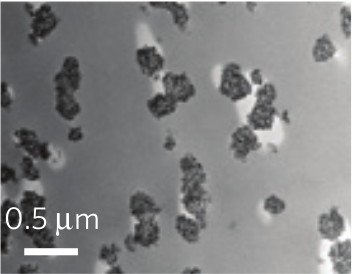
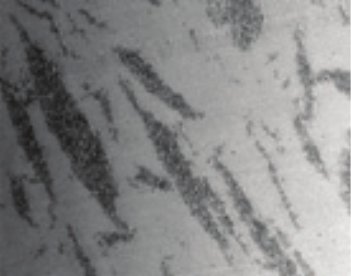
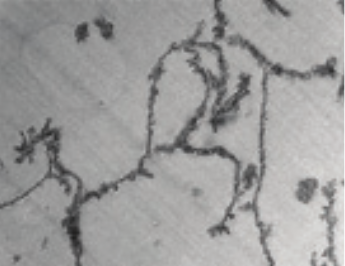
where is the PMF, and is the interparticle separation. In our case the interval of integration is replaced by according to the definition of Eq. 3. By performing the calculation of , keeping into account the effects due to and and following a prescription reported in Ref. Akcora et al. (2009), it is possible to draw a schematic representation of the phase behavior of the nanocomposite as obtained from the two-body PMF and reported in panel (a) of Fig. 7. Experimentally obtained images of well dispersed and phase separated conditions (redrawn from Lan et al. Lan et al. (2007)) are shown in panel (b). It is noteworthy to compare such findings with simulation Akcora et al. (2009) and experimental Lan et al. (2007); Chevigny et al. (2011); Sunday et al. (2012); Kumar et al. (2013) data on the collective behavior of grafted NPs embedded in a PS matrix: we first note that, unlike what we find, it is experimentally observed that for high molecular weights of the free chains a phase separation is detected. However, it must be pointed out that all data reported in Ref. Lan et al. (2007); Chevigny et al. (2011); Sunday et al. (2012); Kumar et al. (2013) refer to NPs of bigger size than that investigated here. Previous experimental Srivastava et al. (2012) and simulation Hall et al. (2010) studies on the effects of the NP size on the PMF have effectively proved that for small NPs (when the radius of gyration of the grafted chains is comparable to the NP radius) the effective interactions between NPs are mainly repulsive. In particular, a DFT study Schmidle et al. (2012) has established that in good solvent conditions the PMF betwen two grafted NPs is always repulsive. The results obtained in these studies explain the repulsive behavior of the two-body PMF observed in our simulations.
| Grafting density | Grafted chains | Grafted chains | Free chains | Free chains |
|---|---|---|---|---|
| () | () | length () | () | length () |
| 0 | 0 | - | 2796 | 20 |
| 0.5 | 25 | 80 | 2527 | 20 |
| 1.0 | 50 | 20 | 2662 | 20 |
| 1.0 | 50 | 80 | 2194 | 20 |
| 0.5 | 25 | 80 | 50 | 1000 |
| 1.0 | 50 | 20 | 53 | 1000 |
| 1.0 | 50 | 80 | 44 | 1000 |
| 0.04 | 2 | 40 | 2792 | 20 |
| 0.1 | 5 | 80 | 2775 | 20 |
| 0.4 | 20 | 20 | 274 | 200 |
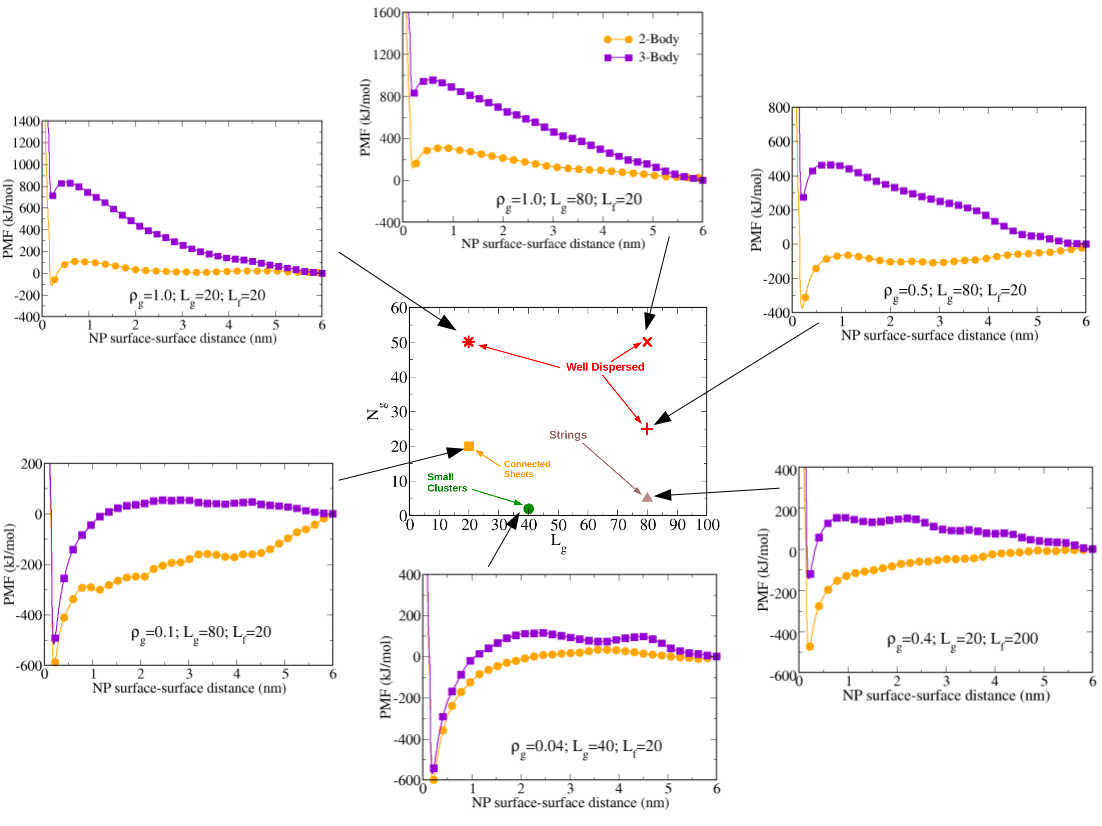
The comparison with simulation and experimental morphology diagrams reported in Refs. Akcora et al. (2009); Kumar et al. (2013) shows a futher interesting feature: in those diagrams, for low grafting densities the NPs are found to self-assemble in complex nanostructures, like strings, connected sheets and small clusters. The appearance of a given structure strongly depends on a proper combination of , and . According to the behavior of the two-body PMF at low grafting densities, reported in Fig. 6f, it emerges that the resulting NP-NP interactions are purely attractive for all the interparticle distances and then cannot reproduce the appearance of complex structures. This is due to the subtle competition between attractive and repulsive contributions (rather than a clear prevalence of one of the two effects) which takes places for low grafting densities, where these structures appear. The crucial role played by the grafting density in determining the structure of nanoscale aggregates has been recently stated also in Ref. Bachhar et al. (2017). On the other hand, a proper characterization of this region of the morphology diagram is important, due to the variety of possible technological applications connected to the appearance of nanostructures. Multi-body effects can play a significant role for a proper dealing of the competition between attractive and repulsive effects, as shown in the next subsection, focused on the three-body contribution to the global PMF.
IV.4 Three-nanoparticles interactions
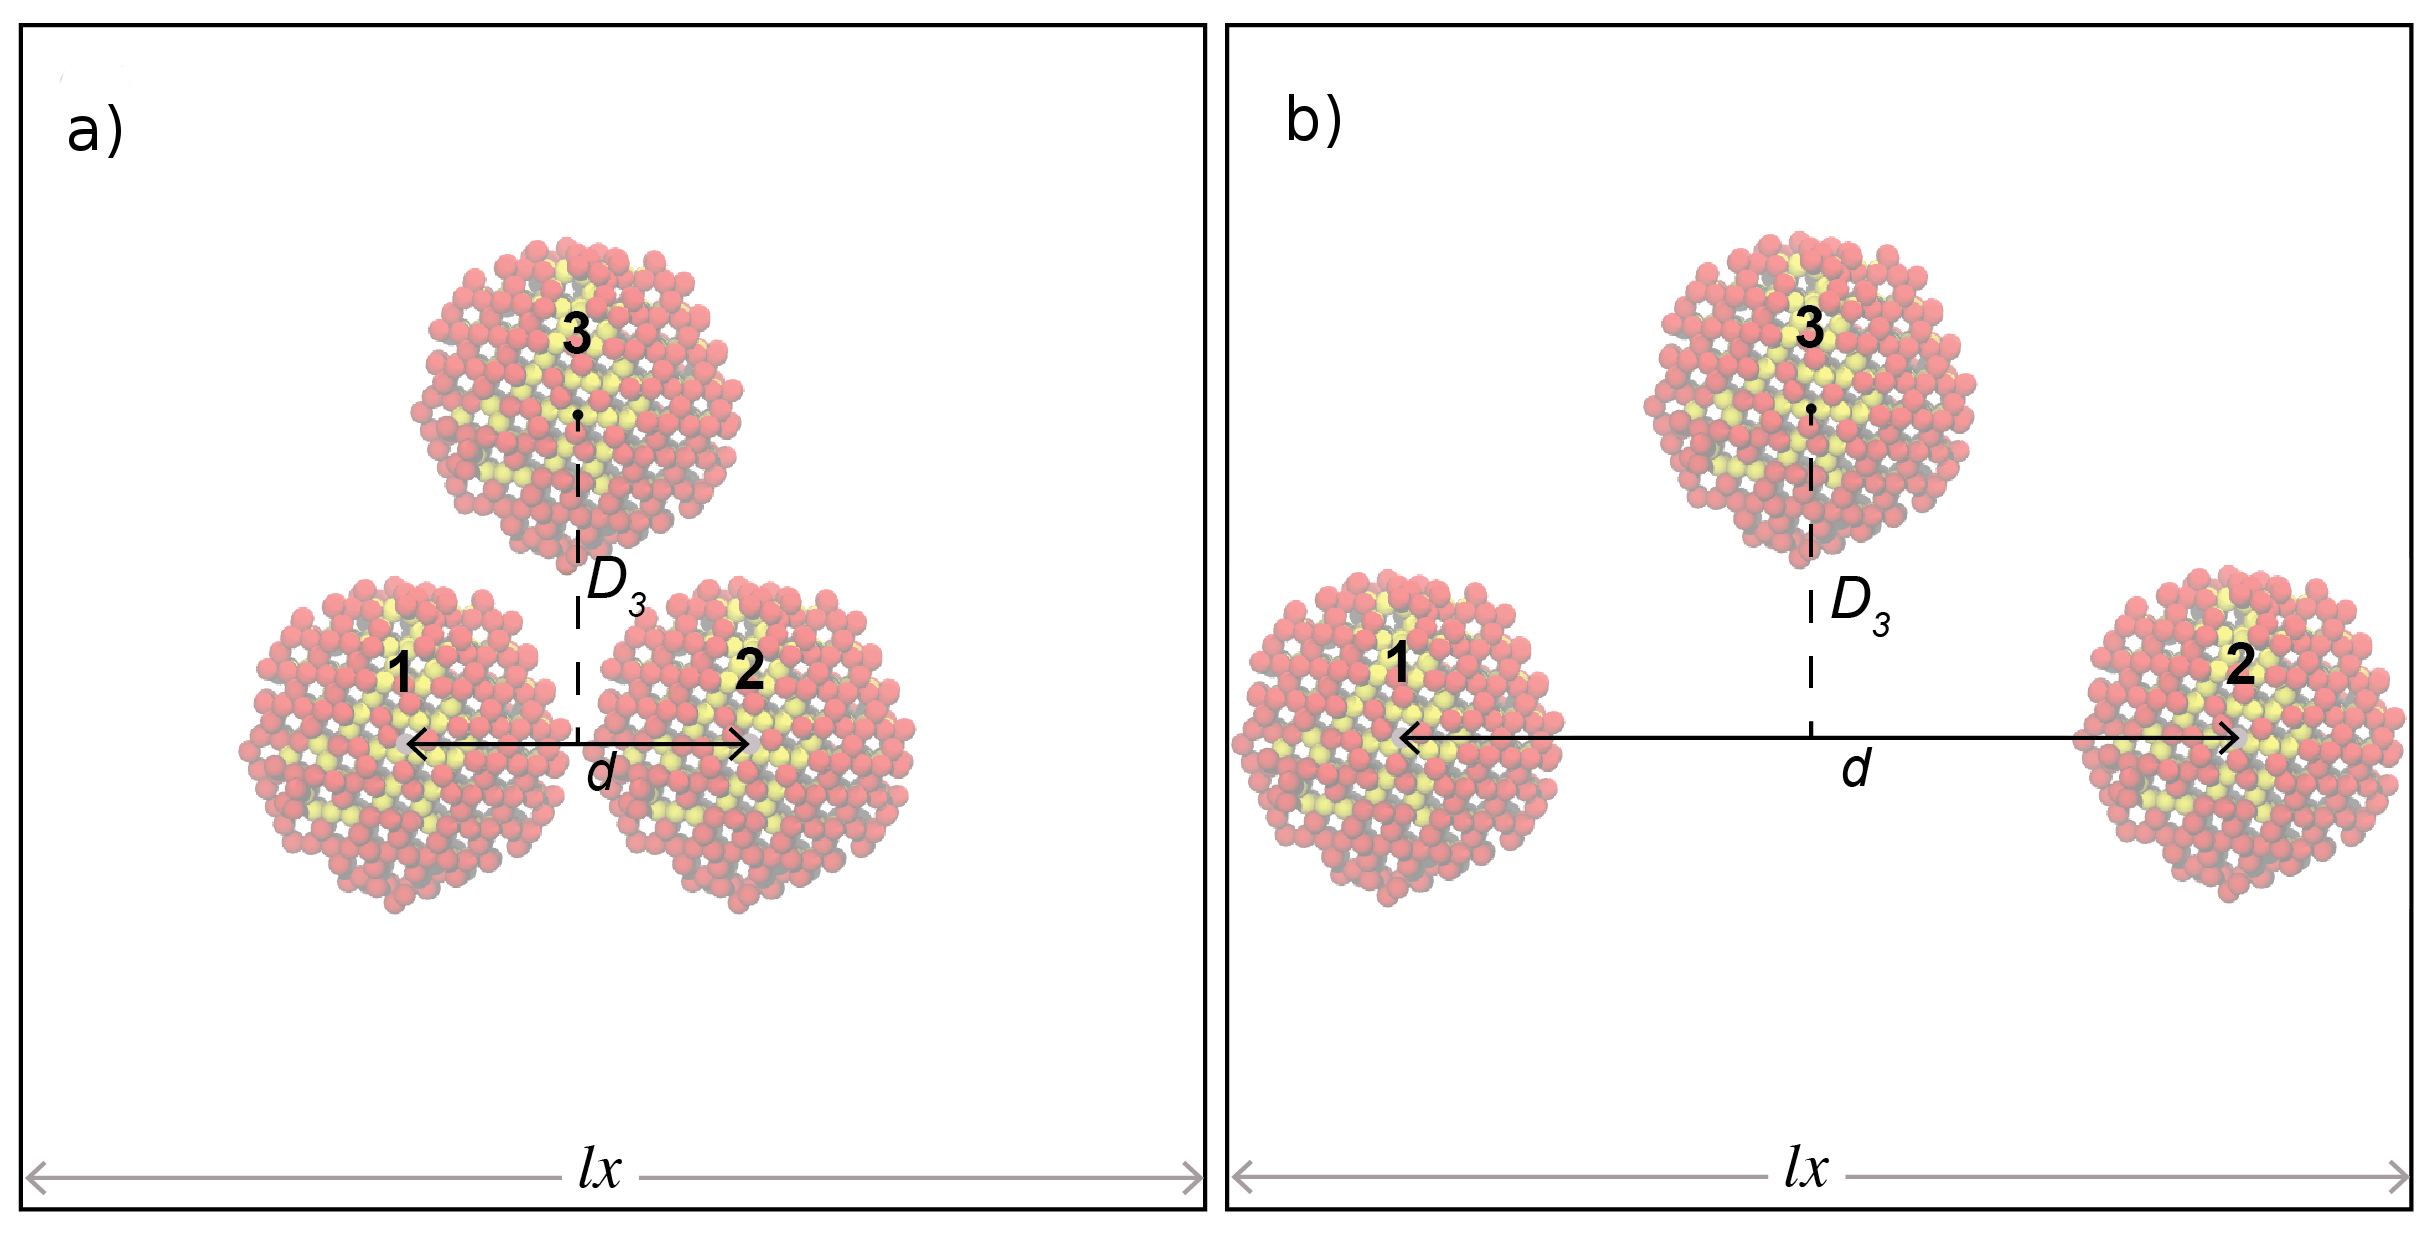
The total collection of the investigated systems for the calculation of the three-body PMF is reported in Tab. 4 and the schematic procedure for its calculation is given in panels (a), (b) of Fig. 8: the systems are now made of a variable number of PS chains plus three NPs (for clarity labeled 1, 2 and 3), whose mutual distances are kept fixed. These NPs are placed in a T-shaped arrangement with the horizontal bar being the 1-2 vector, and the vertical bar being the vector between the 1-2 midpoint and particle 3 at distance . The contribution due to the presence of particle 3 is calculated by computing the total forces acting on the centers of mass of particles 1 and 2. The two-body PMF corresponds to a particular case of the three-body PMF where ; due to the particular arrangement of the three NPs, the shape of the simulation box is now cubic, with nm. The comparison between two and three-body PMF between ungrafted NPs embedded in a PS matrix constituted by chains of 20 beads and for nm is reported in panel (c) of Fig. 8. It emerges that the addition a third NP in the simulation box has a remarkable effect on the resulting interaction, since the three-body PMF is considerably more attractive than the two-body counterpart. Furthermore, oscillations observed for the two-body case are now suppressed, this indicating that the presence of the third NP breaks the previously described mechanism of association, giving rise to a PMF without intermediate minima that monotonically goes to zero for large interparticle distances. The increase of the attraction can be understood by looking at the cartoon reported in Fig. 8d: in comparison with the two-body case, a chain confined between three NPs is now even more compressed, and the accessible space just outside the confinement zone is further reduced. Hence, chains have less conformational freedom between the NPs, this generating a strong attraction between them.
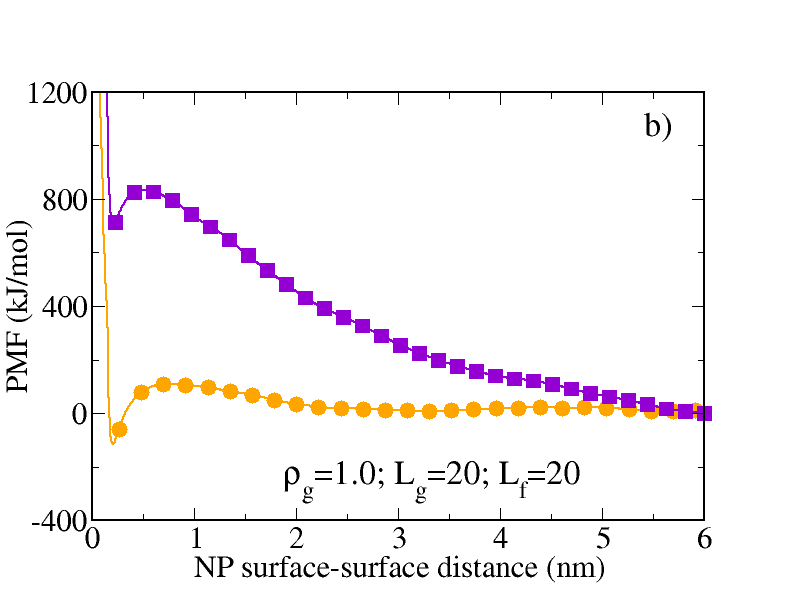
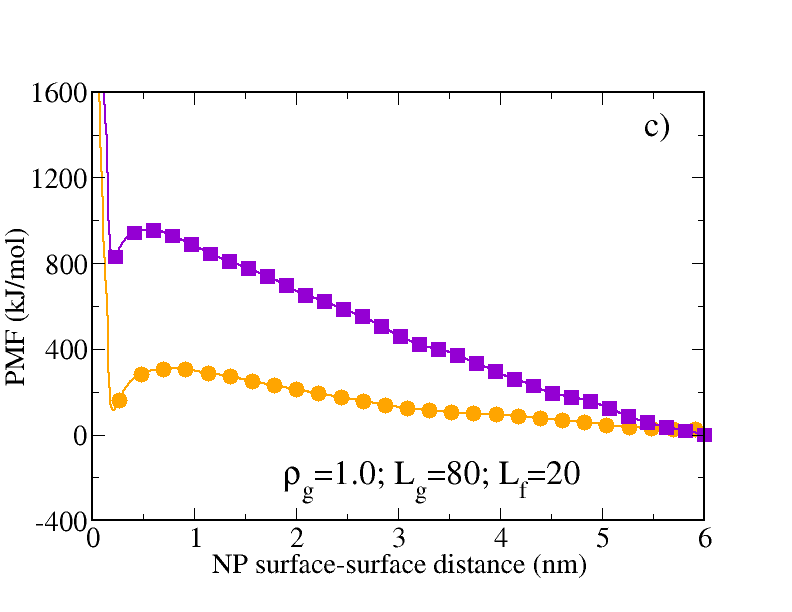
The calculation of the three-body contribution among grafted NPs follows the same lines considered for the ungrafted cases. Two and three-body PMF between grafted NPs are compared in Fig. 9: in particular, in the top panels cases corresponding to high grafting density, low free chain lengths and nm are considered. In these conditions, the three-body PMF is systematically more repulsive than the two-body counterpart, a behavior opposite to that observed for ungrafted NPs. This is due to the increase of the steric repulsion between grafted chains, which becomes bigger and bigger the closer the NPs are. The emerging picture is compatible with a system where NPs are in a well dispersed condition. The same scenario holds if the free chain lengths increases till to 1000 beads in a single chain (see the Supporting Information). From a physical point of view, for high grafting densities, the addition of a third particle in the calculation of effective interactions does not change the scenario observed in the simpler two-body case, but strengthens the repulsive behavior of the resulting PMF, in particular for small interparticle distances. A similar effect has been noticed also in a previous DFT study of the three-body interactions in polymer nanocomposites Frischknecht and Yethiraj (2011) and it has been related to the existence of a small region of polymer confined between the three NPs, which gives rise to large contribution to the PMF. The authors hence concluded that three-body interactions cannot be neglected in a proper description of the PMF between NPs in polymer melts, since they bring a significant contribution to the total interaction.
|
|
Small Clusters Connected Sheets Strings
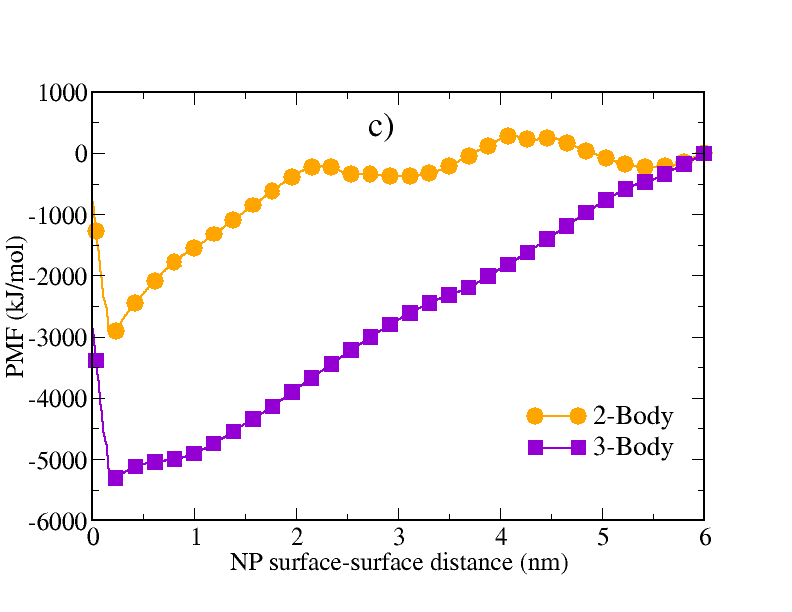
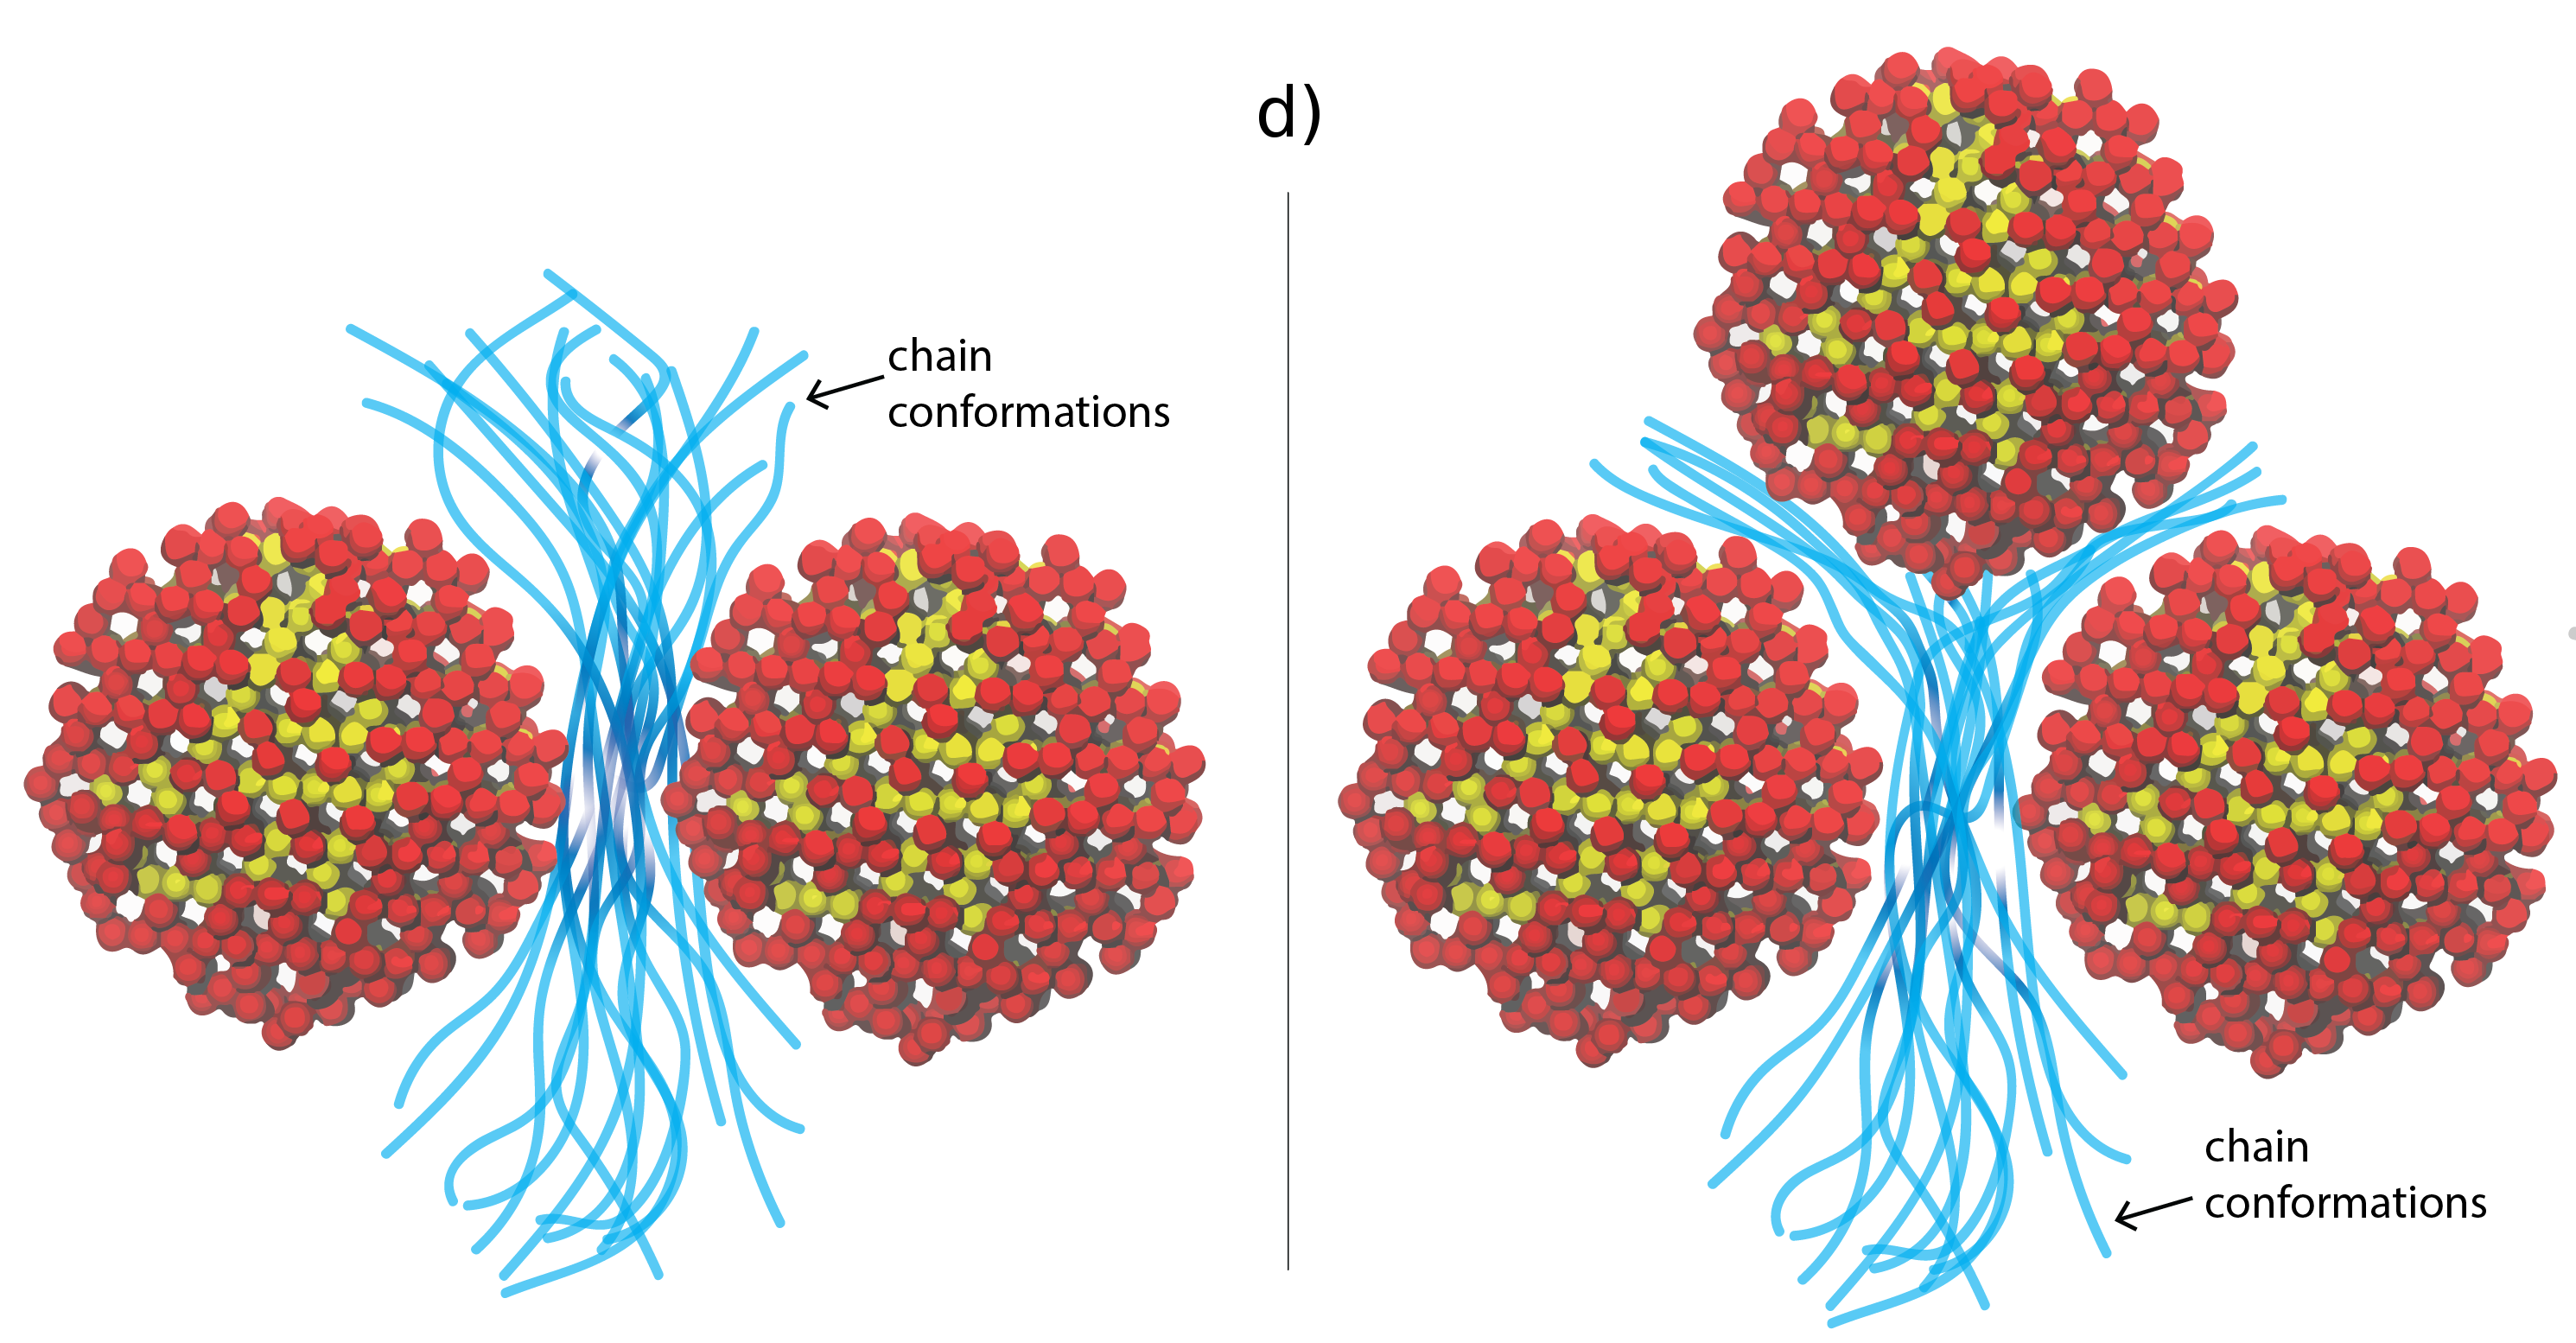
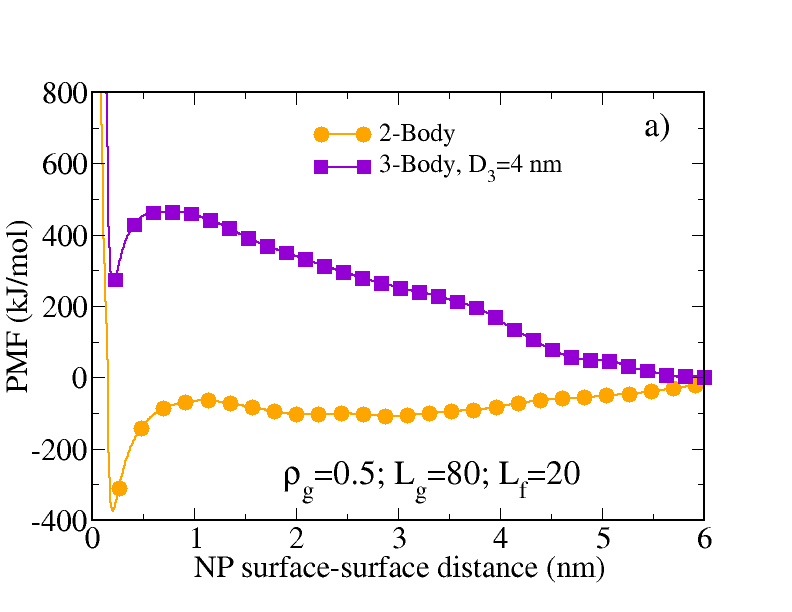
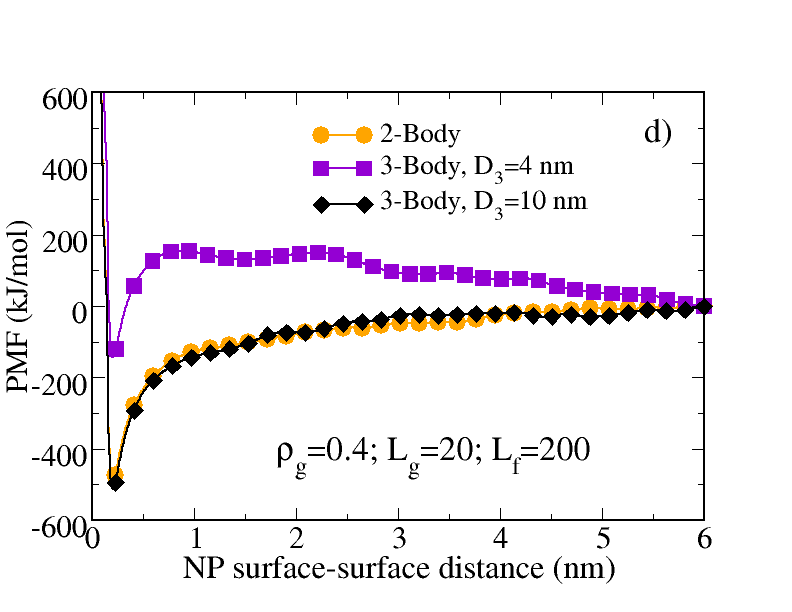
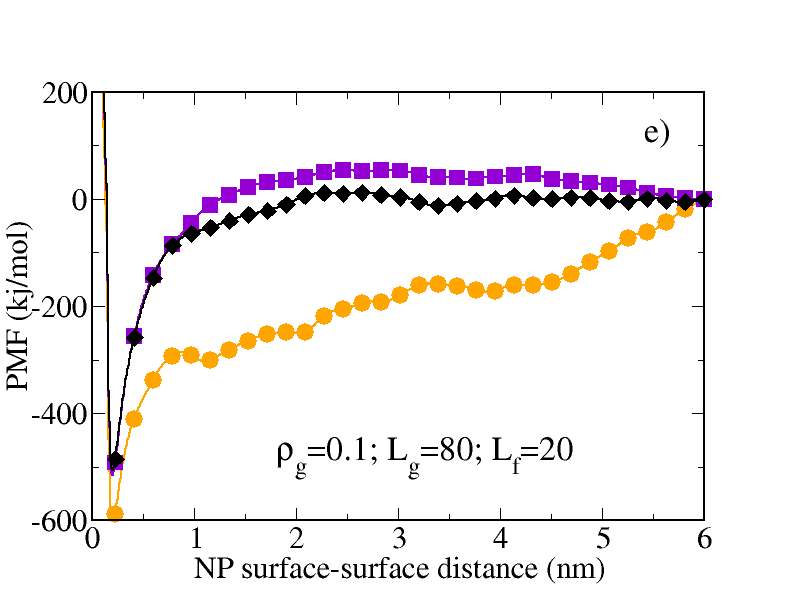
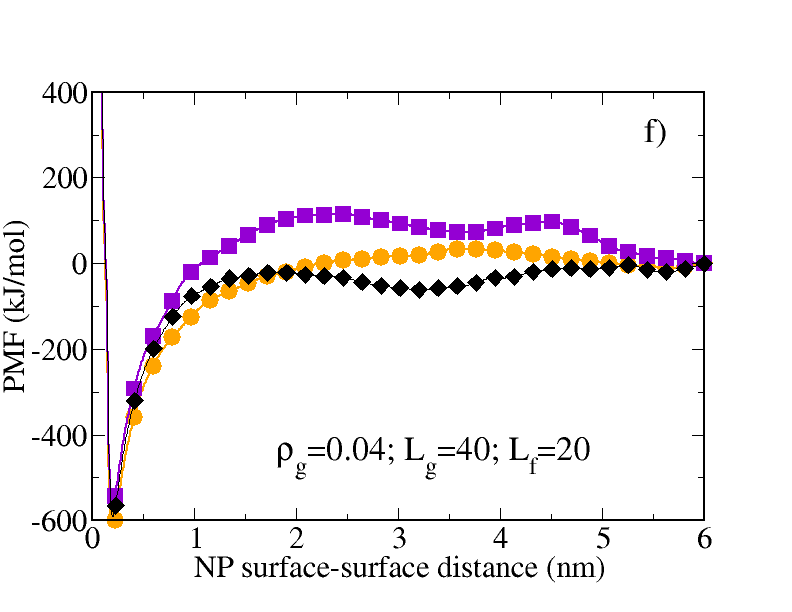
The most interesting situation is that corresponding to low grafting densities (bottom panels of Fig. 9), where the two-body PMF is attractive, thus suggesting aggregation between NPs. The comparison between two and three-body PMF under these conditions is done for and nm, in order to take into account also the effects due to the range of the three-body potential. For nm all three-body PMF show the existence of a short-range attraction followed by a repulsion, the strength of the two interactions being strictly dependent on the specific cases considered. The contemporary presence of attractive and repulsive contributions in the total interactions is usually related to the onset of self-assembled complex structures Stradner et al. (2004). More specifically, for chains/nm2 and nm (panel d) the three-body PMF has now a shallow attractive minimum followed by a slightly repulsive flat region before going to zero. A comparison with a simulation morphology diagram reported in Ref. Akcora et al. (2009) suggests that strings should appear under these conditions. For chains/nm2 and nm (panel e) the three-body PMF shows a quite deep minimum (similarly to the two-body case), before attaining a plateau around zero already for short-range distances. It has been shown that very short-range attractive potential can give rise to planar structures Preisler et al. (2014) resembling the connected sheets reported in Refs. Akcora et al. (2009); Kumar et al. (2013). However this behavior was found for anisotropic potentials: whether this can happen also for the PMF shown in Fig. 9e, is not straigthforward to infer. Finally, for chains/nm2 and nm (panel f) the three-body PMF still shows a deep sharp minimum, followed by a repulsive tail persisting even to intermediate NP-NP separation and becoming zero only for distances close to 6 nm. The simultaneous presence of a short-range attraction and a long-range repulsion is usually related to the appearance of clusters Sciortino et al. (2004), as expected also from previous simulation and experimental morphology diagrams Akcora et al. (2009); Kumar et al. (2013). The picture is completed by analyzing the range dependence of the three-body PMF: for chains/nm2 (panel d) the three-body PMF strongly depends on the distance , since for nm we already recover the behavior of the two-body PMF. Hence, under these conditions the three-body effects are significant only for short interparticle distances, as can be expected if strings effectively appear in the system. Conversely, for chains/nm2 (panel e) the three-body effects are long-ranged, since for nm the PMF still shows the same behavior observed for nm: this can be compatible with the presence of sheets, since in order to bond many NPs in a planar configuration, the three-body contribution must persist even for large interparticle distances. Finally, for chains/nm2 (panel f) the PMF for nm is again similar to the two-body case, hence suggesting that the three-body effects are short-ranged under these conditions, in agreement with the possible presence of clusters. It may be worth noting that the short-range or long-range nature of the three-body effects does not monotonically depend on the grafting density, but only on the specific system considered.
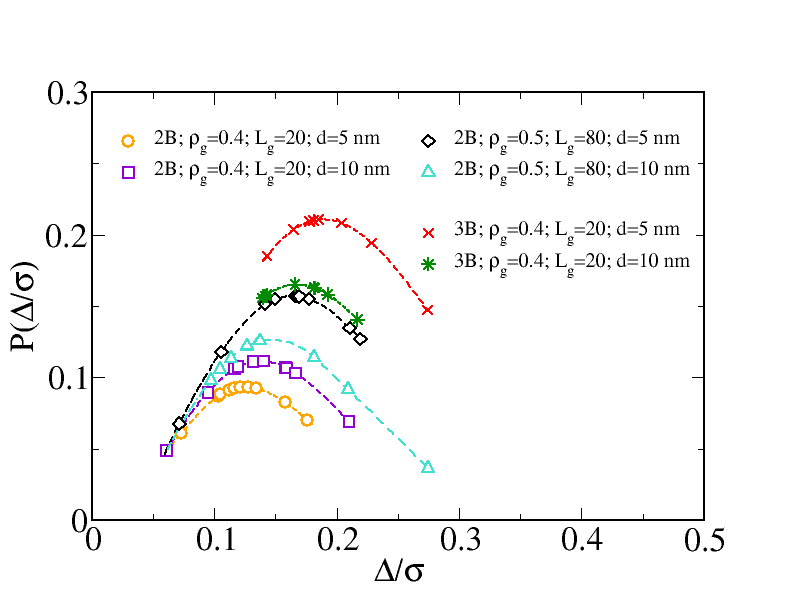
The dependence of self-assembled structures on multi-body interactions has been highlighted also in previous numerical studies of solutions containing grafted NPs Lane and Grest (2010); on the other hand, it also has been shown Bozorgui et al. (2013) that these complex structures can arise due to the anisotropy in the grafted coronas surrounding the NP cores. Such anisotropy can be investigated by calculating the asymmetry in the polymer grafting; following the prescription reported in Ref. Bozorgui et al. (2013) we have calculated the center of mass of the grafted chains respect to the center of mass of the NP to whom they are linked. In Fig. 10 we report the probability of finding different values upon varying the grafting density, the grafted chain length and the interparticle distance. In addition, two and three-body cases (for chains/nm2 and ) are assessed against each other. The distributions follow a Gaussian form that reads as:
| (6) |
where is the mean squared value of . As visible, no peak for is found, this indicating the existence of an asymmetry in the chain distribution for all cases, as documented also in Ref. Bozorgui et al. (2013). It is worth noting that for the three-body case and for the position of the peak of shifts towards low values of upon increasing the interparticle distances; at the same time, also the heigth of the peak decreases. Hence, for low interparticle distances, the grafted coronas are more warped, which is consistent with the previous description of chain arrangements (see Fig. 6 and Fig. 8). The trend is reversed for the two-body case and , this indicating the interpenetration between grafted coronas belonging to the two NPs. Overall, the behavior of indicates that the asymmetry increases if multi-body interactions are taken into account, as expected is nano-structured aggregates onset in the system.
Summarizing the main outcomes of the three-body PMF it is possible to redraw the schematic phase behavior reported in Fig. 7 by calculating the second virial coefficient for the three-body PMF through the Eq. 5. However, it is worth noting that the knowledge of provides information only on the repulsive or attractive nature of the PMF and hence can not identify the specific self-assembled structures. As a consequence, the latter can be inferred only by the specific behaviors of the PMF reported in Fig. 9 and discussed above. The resulting scheme is shown in Fig. 11, along with experimentally obtained images of small clusters, strings and connected sheets redrawn from Akcora et al. Akcora et al. (2009). In order to highlight the relation between the PMF and the different phases, we also report in the same figure the behavior of two and three-body PMF (for nm) at high and low grafting densities. As visible, the well dispersed condition, observed in the upper part of the diagram and characterized by high values of and , can be generally well described by the behavior of the two-body PMF; conversely, for a proper understanding of the nanostructures observed in the lower part of the diagram we need to consider the subtle interplay between two-body and three (or multi) body interactions. In this perspective, further refinements of our approach, including four-body (or higher) contributions to the total PMF are possible, even if it is reasonable to assume that higher order corrections become progressively less significant. We deserve explicit calculations of four-body contribution to the total interaction to future studies.
V Conclusions
We have performed a molecular dynamics study of a coarse-grained model of Silica-Polystyrene nanocomposites by means of a hybrid particle-field approach. In this method, the non-bonded interactions among particles are decoupled and replaced by a field representation. In this way, it is possible to drastically reduce the simulation time typically required for properly relaxing the nanocomposites, opening the way to investigations of their local structure and interfacial properties in detail. Specifically, spherical Silica nanoparticles (NPs) grafted with Polystyrene chains have been studied, aiming to show how the presence of grafted chains influences the global properties of the nanocomposite.
The proposed approach has been first validated against standard models previously reported in literature (based on traditional molecular dynamics simulations) and finding an overall good agreement with them. In particular, we have verified that the molecular structure of polymer chains is well reproduced by the hybrid particle-field approach, by documenting the existence of a “wet-brush-to-dry-brush” transition, as already observed in previous experimental Chevigny et al. (2010) and simulation Ghanbari et al. (2012) works. In addition, we have checked that even polymer chains with high molecular weight can be fully relaxed within the proposed approach.
Then, the potential of mean force (PMF) between a pair of ungrafted or grafted NPs embedded in the polymer matrix has been calculated. In order to gain new insight in the knowledge of the effective interactions between the NPs, we have calculated, beside the usual two-body PMF, also the three-body contribution to the total potential. To the best of our knowledge, this is the first time such a term is explicitly taken into account in molecular simulations of polymer nanocomposites.
Upon comparing the PMF between ungrafted and grafted NPs, significant differences emerge: while in the first case the PMF is strongly attractive, for grafted NPs it becomes progressively more repulsive upon increasing the grafting density. The calculation of three-body PMF between grafted NPs allowed us to make a qualitative comparison with simulation Akcora et al. (2009) and experimental Kumar et al. (2013) diagrams where different morphologies (obtained through the self-assembly of many grafted Silica NPs in PS matrices) are reported. In particular, we have ascertained how the existence of nanostructures, like strings, connected sheets and small clusters, can be understood only by taking into account the subtle interplay between two-body and three (or, more in general, multi) body interactions in the behavior of PMF. In this perspective, we have proposed our approach and models for a proper molecular understanding of specific systems, along with the impact of the chemical nature of such systems on the composite final properties.
VI Acknowledgements
The computing resources and the related technical support used for this work have been provided by CRESCO/ENEAGRID High Performance Computing infrastructure and its staff Ponti and et al (2014). CRESCO/ENEAGRID High Performance Computing infrastructure is funded by ENEA, the Italian National Agency for New Technologies, Energy and Sustainable Economic Development and by Italian and European research programs, see http://www.cresco.enea.it/english for information. G. Munaò and G. Milano acknowledge financial support from the Project PRIN-MIUR 2015-2016 and from the European Project Intelligent bulk MAterials for Smart TRanspOrt industries (MASTRO) 2018.
References
- Glotzer et al. (2017) S. C. Glotzer, P. Nordlander and L. E. Fernandez, ACS Nano, 2017, 11, 6505.
- Kumar et al. (2017) S. K. Kumar, V. Ganesan and R. A. Riggleman, J. Chem. Phys., 2017, 147, 020901.
- Koo (2016) J. H. Koo, Polymer Nanocomposites: Processing, Characterization, and Application, McGraw-Hill, 2016.
- Balazs et al. (2006) A. C. Balazs, T. Emrick and T. P. Russell, Science, 2006, 314, 1107.
- Brown et al. (2008) D. Brown, V. Marcadon, P. Mèlè and N. D. Albèrola, Macromolecules, 2008, 41, 1499.
- Hooper et al. (2004) J. B. Hooper, K. S. Schweizer, T. G. Desai, R. Koshy and P. Keblinski, J. Chem. Phys., 2004, 121, 6986.
- Ndoro et al. (2011) T. V. M. Ndoro, E. Voyiatzis, A. Ghanbari, D. N. Theodorou, M. C. Böhm and F. Müller-Plathe, Macromolecules, 2011, 44, 2316.
- Liu et al. (2011) J. Liu, Y. Wu, J. Shen, Y. Gao, L. Zhang and D. Cao, Phys. Chem. Chem. Phys., 2011, 13, 13058.
- Meng et al. (2013) D. Meng, S. K. Kumar, S. Cheng and G. S. Grest, Soft Matter, 2013, 9, 5417.
- Martin et al. (2015) T. B. Martin, K. I. S. Mongcopa, R. Ashkar, P. Butler, R. Krishnamoorti and A. Jayaraman, J. Am. Chem. Soc., 2015, 137, 10624.
- Dukes et al. (2010) D. Dukes, Y. Li, S. Lewis, B. Benicewicz, L. Schadler and S. K. Kumar, Macromolecules, 2010, 43, 1564.
- Xie et al. (2013) L. Y. Xie, X. Y. Huang, Y. H. Huang, K. Yang and P. K. Jiang, J. Phys. Chem. C, 2013, 117, 22525.
- Tang et al. (2014) C. Y. Tang, G. C. Long, X. Hu, K. W. Wong, W. M. Lau, M. K. Fan, J. Mei, T. Xu, B. Wang and D. Hui, Nanoscale, 2014, 6, 7877.
- Patel and Egorov (2004) N. Patel and S. A. Egorov, J. Chem. Phys., 2004, 121, 4987.
- Schweizer and Curro (1987) K. S. Schweizer and J. G. Curro, Phys. Rev. Lett., 1987, 58, 246.
- Curro and Schweizer (1987) J. G. Curro and K. S. Schweizer, Macromolecules, 1987, 20, 1928.
- Striolo and Egorov (2007) A. Striolo and S. A. Egorov, J. Chem. Phys., 2007, 126, 014902.
- Egorov (2008) S. A. Egorov, J. Chem. Phys., 2008, 129, 064901.
- Allegra et al. (2008) G. Allegra, G. Raos and M. Vacatello, Prog. Polym. Sci., 2008, 33, 683.
- Jancar et al. (2010) J. Jancar, J. F. Douglas, F. W. Starr, S. K. Kumar, P. Cassagnau, A. J. Lesser, S. S. Sternstein and M. J. Buehler, Polymer, 2010, 51, 3321.
- Ganesan and Jayaraman (2014) V. Ganesan and A. Jayaraman, Soft Matter, 2014, 10, 13.
- Barbier et al. (2004) D. Barbier, D. Brown, A. C. Grillet and S. Neyertz, Macromolecules, 2004, 37, 4695.
- Eslami et al. (2013) H. Eslami, M. Rahimi and F. Müller-Plathe, Macromolecules, 2013, 46, 8680.
- De Nicola et al. (2015) A. De Nicola, R. Avolio, F. Della Monica, G. Gentile, M. Cocca, C. Capacchione, M. E. Errico and G. Milano, RSC Advances, 2015, 5, 71336.
- Karatrantos et al. (2015) A. Karatrantos, N. Clarke, R. J. Composto and K. I. Winey, Soft Matter, 2015, 11, 382.
- Reith et al. (2003) D. Reith, M. Pütz and F. Müller-Plathe, J. Comput. Chem., 2003, 24, 1624.
- Huang et al. (2010) D. M. Huang, R. Faller, K. Do and A. J. Moulè, J. Chem. Theory Comput., 2010, 6, 526.
- Ghanbari et al. (2012) A. Ghanbari, T. V. M. Ndoro, F. Leroy, M. Rahimi, M. C. Böhm and F. Müller-Plathe, Macromolecules, 2012, 45, 572.
- Shen et al. (2015) J. Shen, J. Liu, H. Li, Y. Gao, X. Li, Y. Wu and L. Zhang, Phys. Chem. Chem. Phys., 2015, 17, 7196.
- Shi et al. (2017) R. Shi, H.-J. Qian and Z.-Y. Lu, Phys. Chem. Chem. Phys., 2017, 19, 16524.
- Kawakatsu (2004) T. Kawakatsu, Statistical Physics of Polymers, Springer, Berlin, 2004.
- Milano and Kawakatsu (2009) G. Milano and T. Kawakatsu, J. Chem. Phys., 2009, 130, 214106.
- Milano and Kawakatsu (2010) G. Milano and T. Kawakatsu, J. Chem. Phys., 2010, 133, 214102.
- Zhu et al. (2016) Y.-L. Zhu, Z.-Y. Lu, G. Milano, A.-C. Chang and Z.-Y. Sun, Phys. Chem. Chem. Phys., 2016, 18, 9799.
- Zhao et al. (2016) Y. Zhao, M. Byshkin, Y. Cong, T. Kawakatsu, L. Guadagno, A. De Nicola, N. S. Yu, G. Milano and B. Dong, Nanoscale, 2016, 8, 15538.
- De Nicola et al. (2014) A. De Nicola, T. Kawakatsu and G. Milano, J. Chem. Theory Comput., 2014, 10, 5651.
- De Nicola et al. (2016) A. De Nicola, T. Kawakatsu, F. Müller-Plathe and G. Milano, Eur. Phys. J. Special Topics, 2016, 225, 1817.
- Soares et al. (2017) T. A. Soares, S. Vanni, G. Milano and M. Cascella, J. Phys. Chem. Lett., 2017, 8, 3586.
- Lan et al. (2007) Q. Lan, L. F. Francis and F. S. Bates, J. Polym. Sci., Polym. Phys., 2007, 45, 2284.
- Akcora et al. (2009) P. Akcora, H. Liu, S. K. Kumar, J. Moll, Y. Li, B. C. Benicewicz, L. S. Schadler, D. Acechin, A. Z. Panagiotopoulos, V. Pyramitsyn, V. Ganesan, J. Ilavsky, P. Thiyagarajan, R. H. Colby and J. F. Douglas, Nat. Mater., 2009, 8, 354.
- Chevigny et al. (2010) C. Chevigny, J. Jestin, D. Gigmes, R. Schweins, E. Di Cola, F. Dalmas, D. Bertin and F. Bouè, Macromolecules, 2010, 43, 4833.
- Chevigny et al. (2011) C. Chevigny, F. Dalmas, E. Di Cola, D. Gigmes, D. Bertin, F. Boue and J. Jestin, Macromolecules, 2011, 44, 122.
- Sunday et al. (2012) D. Sunday, J. Ilavsky and D. L. Green, Macromolecules, 2012, 45, 4007.
- Ghanbari et al. (2013) A. Ghanbari, M. Rahimi and J. Dehghany, J. Phys. Chem. C, 2013, 117, 25069.
- Voyiatzis et al. (2016) E. Voyiatzis, F. Müller-Plathe and M. C. Böhm, Polymer, 2016, 101, 107.
- Pfaller et al. (2016) S. Pfaller, G. Possart, P. Steinmann, M. Rahimi, F. Müller-Plathe and M. C. Böhm, Phys. Rev. E, 2016, 93, 052505.
- Rahimi et al. (2012) M. Rahimi, I. Iriarte-Carretero, A. Ghanbari, M. C. Böhm and F. Müller-Plathe, Nanotechnology, 2012, 23, 305702.
- Ndoro et al. (2012) T. V. M. Ndoro, M. C. Böhm and F. Müller-Plathe, Macromolecules, 2012, 45, 171.
- Frischknecht and Yethiraj (2011) A. L. Frischknecht and A. Yethiraj, J. Chem. Phys., 2011, 134, 174901.
- Martin et al. (2013) T. B. Martin, P. M. Dodd and A. Jayaraman, Phys. Rev. Lett., 2013, 110, 018301.
- Cerdà et al. (2003) J. J. Cerdà, T. Sintes and R. Toral, Macromolecules, 2003, 36, 1407.
- Smith et al. (2003) J. S. Smith, D. Bedrov and G. D. Smith, Compos. Sci. Technol., 2003, 63, 1599.
- Marla and Meredith (2006) K. T. Marla and J. C. Meredith, J. Chem. Theory Comput., 2006, 2, 1624.
- Smith and Bedrov (2009) G. D. Smith and D. Bedrov, Langmuir, 2009, 25, 11239.
- Lo Verso et al. (2011) F. Lo Verso, L. Yelash, S. A. Egorov and K. Binder, J. Chem. Phys., 2011, 135, 214902.
- Meng et al. (2012) D. Meng, S. K. Kumar, J. M. D. Lane and G. S. Grest, Soft Matter, 2012, 8, 5002.
- Baran and Sokolowski (2017) L. Baran and S. Sokolowski, J. Chem. Phys., 2017, 147, 044903.
- Rank and Baker (1997) J. A. Rank and D. Baker, Protein Sci., 1997, 6, 347.
- Czaplewski et al. (2000) C. Czaplewski, S. Rodziewicz-Motowidlo, A. Liwo, D. R. Ripoll, R. J. Wawak and H. A. Scheraga, Protein Sci., 2000, 9, 1235.
- Czaplewski et al. (2003) C. Czaplewski, S. Rodziewicz-Motowidlo, M. Dabal, A. Liwo, D. R. Ripoll and H. A. Scheraga, Biophys. Chem., 2003, 105, 339.
- Qian et al. (2008) H.-J. Qian, P. Carbone, X. Chen, H. A. Karimi-Varzaneh, C. C. Liew and F. Müller-Plathe, Macromolecules, 2008, 41, 9919.
- Sides et al. (2006) S. W. Sides, B. J. Kim, E. J. Kramer and G. H. Fredrickson, Phys. Rev. Lett., 2006, 96, 250601.
- Zhao et al. (2012) Y. Zhao, A. De Nicola, T. Kawakatsu and G. Milano, J. Comput. Chem., 2012, 33, 868.
- Martinez et al. (2009) L. Martinez, R. Andrade, E. G. Birgin and J. M. Martinez, J. Comput. Chem., 2009, 30, 2157.
- Hamaker (1937) H. C. Hamaker, Physica, 1937, 4, 1058.
- Munaò et al. (2018) G. Munaò, A. Correa, A. Pizzirusso and G. Milano, EPJ E, 2018, 41, 38.
- Hooper and Schweizer (2005) J. B. Hooper and K. S. Schweizer, Macromolecules, 2005, 38, 8858.
- Bedrov et al. (2003) D. Bedrov, G. D. Smith and J. S. Smith, J. Chem. Phys., 2003, 119, 10438.
- McQuarrie (1976) D. A. McQuarrie, Statistical Mechanics, Harper Collins, New York, 1976.
- Kumar et al. (2013) S. K. Kumar, N. Jouault, B. Benicewicz and T. Neely, Macromolecules, 2013, 46, 3199.
- Srivastava et al. (2012) S. Srivastava, P. Agarwal and L. A. Archer, Langmuir, 2012, 28, 6276.
- Hall et al. (2010) L. M. Hall, A. Jayaraman and K. S. Schweizer, Curr. Opin. Solid State Mater. Sci., 2010, 14, 38.
- Schmidle et al. (2012) H. Schmidle, C. K. Hall, O. D. Velev and S. H. L. Klapp, Soft Matter, 2012, 8, 1521.
- Bachhar et al. (2017) N. Bachhar, Y. Jiao, M. Asai, P. Akcora, R. Bandyopadhyaya and S. K. Kumar, Macromolecules, 2017, 50, 7730.
- Stradner et al. (2004) A. Stradner, H. Sedgwick, F. Cardinaux, W. C. Poon, S. U. Egelhaaf and P. Schurtenberger, Nature, 2004, 432, 492.
- Preisler et al. (2014) Z. Preisler, T. Vissers, G. Munaò, F. Smallenburg and F. Sciortino, Soft Matter, 2014, 10, 5121.
- Sciortino et al. (2004) F. Sciortino, S. Mossa, E. Zaccarelli and P. Tartaglia, Phys. Rev. Lett., 2004, 93, 055701.
- Lane and Grest (2010) J. M. D. Lane and G. S. Grest, Phys. Rev. Lett., 2010, 104, 235501.
- Bozorgui et al. (2013) B. Bozorgui, D. Meng, S. K. Kumar, C. Chakravarty and A. Cacciuto, Nano Lett., 2013, 13, 2732.
- Ponti and et al (2014) G. Ponti and et al, Proceedings of the 2014 International Conference on High Performance Computing and Simulation, 2014, 6903807, 1030.