Dielectric Modulation of Ion Transport near Interfaces
Abstract
Ion mobility and ionic conductance in nanodevices are known to deviate from bulk behavior, a phenomenon often attributed to surface effects. We demonstrate that dielectric mismatch between the electrolyte and the surface can qualitatively alter ionic transport in a counterintuitive manner. Instead of following the polarization-induced modulation of the concentration profile, mobility is enhanced or reduced by changes in the ionic atmosphere near the interface and affected by a polarization force parallel to the surface. In addition to revealing this mechanism, we explore the effect of salt concentration and electrostatic coupling.
Understanding ion mobility and ionic conductance is of fundamental importance in fields ranging from biology to energy conversion, describing phenomena as diverse as ion channels Gouaux and MacKinnon (2005) and fuel cells Kreuer (2014). The foundation for this understanding was laid more than a century ago by Kohlrausch Kohlrausch (1879, 1907); Atkins and de Paula (2006), who observed that the molar conductivity of electrolytes decreases with increasing salt concentration , . Debye and Hückel Debye and Hückel (1923); Debye (1927), and Onsager Onsager (1927); Onsager and Fuoss (1931) connected this concentration dependence to the counterion atmosphere surrounding moving ions. This atmosphere, which has a size related to the concentration via the Debye length , exerts two types of forces on the central ion, the electrophoretic force and the relaxation force. The electrophoretic force arises from the modification of the viscous drag on the central ion by solvent molecules that are pulled in the opposite direction by the counterions. The relaxation force is a consequence of the asymmetry of the ionic atmosphere under a driving field. The atmosphere around a moving ion is continuously being rebuilt—a process that takes finite time and causes the center of mass of the atmosphere to lag behind the central ion. Due to this asymmetry, the ion cloud exerts a Coulombic force on the central ion, slowing down its motion.
The original derivation of Debye, Hückel, and Onsager relies on various simplifications. Subsequent conductance theories Fuoss and Onsager (1957); Fuoss (1978) more accurately take into account non-idealities, such as ion association, as well as the coupling between relaxation and electrophoretic effects, notably the modification of the latter by the asymmetry of the ionic atmosphere. These corrections result in higher-order terms in the concentration and extend the validity of the theory to a wider concentration range. Nevertheless, the effect of concentration on molar conductivity remains qualitatively unchanged, namely that ion mobility decreases as concentration increases.
Under nanoscale confinement, ion mobilities Duan and Majumdar (2010) and conductances Stein et al. (2004) are known to deviate from bulk-like behavior. Moreover, such devices also exhibit other special transport properties, e.g., ion selectivity Nishizawa et al. (1995); Cervera et al. (2006) and rectification Cervera et al. (2006). These deviations from bulk behavior are often attributed to surface effects and to the high surface-to-volume ratio characteristic of nanodevices. For example, net positive surface charge will attract excess negative ions into a nanopore. At low concentrations, this will enhance the conductance compared to the bulk Stein et al. (2004). Conversely, surface charge has been predicted to increase water viscosity and thereby decrease ion mobility near the surface Qiao and Aluru (2005a), where the specific ion mobility depends on the sign of the surface charge Qiao and Aluru (2005b) and on ionic characteristics.
Yet another effect concerns the permittivity. Materials used in synthetic nanoscale devices range from dielectric to metallic, so that the surface polarization induced at the fluid–solid interface may influence ion transport. In addition to dielectric exclusion Buyukdagli et al. (2011) of ions from nanopores, the dielectric properties of a pore have been predicted to enhance ion selectivity Boda et al. (2006). Intriguingly, recent calculations Zhang et al. (2011) have raised the possibility that the permittivity of the pore surface can be used to tune ionic rectification in conical nanopores. Thus, along with surface charge and pore size, permittivity potentially provides an additional parameter for achieving a high degree of control over ion movement. Nevertheless, to the best of our knowledge, hitherto all studies of the effect of surface polarization on ionic conductivity have concentrated on the distribution, number, or type of ions in the pore Mamonov et al. (2003); Zhang et al. (2011); Tagliazucchi et al. (2013); Balme et al. (2015), whereas their mobility, an essential factor in the overall ionic conductivity, has been assumed to be independent of the dielectric properties of the nanodevice surface.
Here, we address this knowledge gap and demonstrate that the mobility of ions near a surface indeed can be controlled by tuning the dielectric mismatch between the wall and the solvent. We relate the origins of this effect to modifications the surface polarization induces in the counterion atmosphere, and in the related relaxation force. Molecular dynamics (MD) simulations permit a microscopic view of ion mobility and counterion clouds as a function of ion distance to the interface. To include fluctuation and correlation effects all ions are treated explicitly, whereas both the solvent and the surface are modeled as dielectric continua. The use of a coarse-grained model allows us to incorporate dielectric effects into the simulations, and to track the movement of ions for long enough times ( simulation steps, corresponding to more than 5 ms) to allow reliable extraction of the mobility and corresponding forces.
We adopt the restricted primitive model Luijten et al. (2002), modeling ions as monovalent (), purely repulsive shifted-truncated Lennard-Jones spheres of mass and diameter , which we choose as our unit of length. For hydrated ions, is approximately 0.7 nm. We employ a parallel-plate geometry of width and length , periodically replicated in both dimensions. The top and bottom surfaces are separated by . The upper surface has the same dielectric constant as the solvent, , whereas the lower surface has dielectric permittivity . This geometry makes it possible to account for the effects of the complex surface polarization patterns via image charges Neumann (1883). To accommodate the image charges, the height of the actual simulation cell is doubled, and all electrostatic interactions are computed via 3D PPPM with accuracy , and a slab correction accompanied by -thick vacuum layer. We use the dielectric mismatch to describe the magnitude and sign of the image charge: for a low-permittivity surface that results in repulsive surface polarization, for an interface with no dielectric mismatch, and for a high-permittivity surface with attractive surface polarization. We use a timestep of 0.01, where , is the Lennard-Jones coupling constant, denotes the absolute temperature, and is Boltzmann’s constant. Following the convention in polyelectrolyte simulations Hsiao and Luijten (2006), we employ an enhanced Bjerrum length . Whereas this enhances the electrostatic effects, we will demonstrate that our findings hold at lower coupling strength as well. Unless stated otherwise, the ion concentration is (corresponding to M).
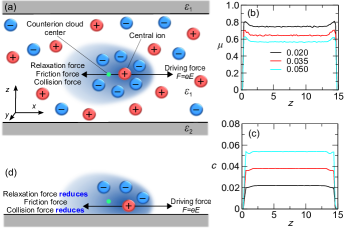
The simulation setup and the forces affecting the movement of ions are depicted in Fig. 1a. Ions are driven by an external field in the -direction. This field strength lies within the linear response regime, and is counteracted by the relaxation force, frictional forces, and the collision force. The friction force (viscous drag) exerted by the solvent on individual ions is captured by a Langevin thermostat, applied in the system with damping constant not . The short-range drag arising from interacting hydration shells of ions that pass each other is represented by Lennard-Jones collisions between ions. Since our simulations do not incorporate hydrodynamics, the ions do not experience a long-range electrophoretic force. However, as this force has the same functional dependence on salt concentration as the explicitly included relaxation force Onsager and Fuoss (1931), this does not qualitatively affect Kohlrausch’s law. Moreover, as we will discuss below, our findings regarding the role of surface permittivity are equally unaffected. The ion mobility [] is determined by the balance of these force components, and obtained by averaging the instantaneous velocity of ions.
To establish a reference system, we first explore ion mobilities (Fig. 1b) and the underlying ion concentration profiles (Fig. 1c) in a channel without dielectric mismatch. As expected, the ion mobility decreases as concentration increases, in qualitative agreement with Kohlrausch’s law. However, the profiles are not uniform, displaying an increase in the ion mobilities near the surfaces for all concentrations (we examined ). Indeed, this mobility increase reflects the important role of the counterion atmosphere in ion conductivity. The presence of the wall perturbs the ion cloud and leads to a decrease both in the electrostatic relaxation force and in ion–ion collisions (Fig. 1d), which in turn increases the mobility near the interface. Even though this can readily be produced in a simple MD simulation, we are unaware of prior previous reports on this effect.
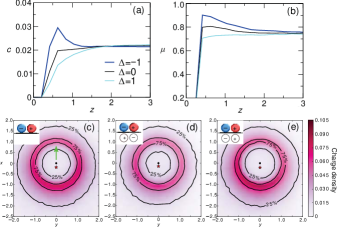
The situation becomes more complex when surface polarization is taken into account. Figure 2a shows the expected build-up of ions near an attractive, high-permittivity surface () and depletion near a low-permittivity material (, Fig. 2a). Based on Kohlrausch’s law, and our observations in Fig. 1b,c, the mobilities should consequently decrease near a surface with and increase near a surface with . Surprisingly, we observe the opposite. Figure 2b shows that near a high-permittivity surface the interfacial mobility is enhanced compared to a system without dielectric mismatch (), whereas a surface with low dielectric constant decreases the mobility.
We hypothesize that this remarkable behavior results from changes in the ionic atmosphere. Indeed, in bulk electrolytes such changes are known to affect ion mobilities. For example, in the Wien effect Wien (1928); Onsager and Kim (1957); Luijten (2013) electrolyte mobility increases in high fields because the fast movement of the ions prevents the formation of the counterion cloud. Similarly, the Debye–Falkenhagen effect Debye and Falkenhagen (1928); Falkenhagen (1934) describes how in high-frequency AC fields the fast, continuous switching of the direction of the ion movement suppresses the asymmetry of the ionic atmosphere, so that the relaxation force vanishes.
Accordingly, we examine the effect of surface polarization on counterion atmospheres surrounding ions in the interfacial region. Figure 2c depicts the shape and net charge density of the ionic cloud in the absence of surface polarization. It confirms the distortion of the cloud in the direction of motion, with its center of mass located behind the central ion. Attractive polarization (, Fig. 2) weakens the overall counterion cloud and simultaneously suppresses its asymmetry. This in turn diminishes the relaxation force, resulting in the speed-up observed in Fig. 2b. The inset illustrates the underlying mechanism, which is phrased most concisely in term of the image charges that represent the induced surface polarization patterns. Counterions in the cloud are repelled by the image of the central ion. This weakens the ion–ion interactions and thereby not only diminishes the net charge of the ionic cloud, but also makes it more symmetric, since the range of the ionic atmosphere is connected to the relaxation time needed to rebuild it.
Conversely, repulsive surface polarization (, Fig. 2e) enhances both the intensity and asymmetry of the ionic atmosphere. This leads to an increase in the relaxation force, and to a slow-down of ions close to the interface, supporting the mobility profile observed in Fig. 2b. The interaction between ions and their own images is now repulsive, whereas the secondary interaction between an ion and the image of its countercharge is attractive. This leads to enhanced ion–ion attraction and to the elevated net charge density around an ion residing near a low-dielectric surface.
The modulation of ion–ion interactions by polarizable surfaces Nadler et al. (2003) and the consequent changes in ionic atmosphere Buyukdagli et al. (2011); Zwanikken and Olvera de la Cruz (2013) near interfaces have been predicted before. Experimental support for the weakening of ion–ion interactions near a high-permittivity material is provided by the observation of enhanced dissociation of a weak electrolyte, leading to more free charge carriers and an increase in conductivity Korobeynikov et al. (2005). However, to the best of our knowledge, the modulation of ion mobilities by polarizable interfaces through changes in the ionic atmosphere has not been reported before.
An important advantage offered by particle-based modeling is that it permits examination of the individual contributions to the forces exerted on ions near the interface. Figure 3a presents the total (i.e., arising from ionic as well as induced charges) Coulombic force on ions as a function of distance to the channel wall. As predicted, for attractive polarization the magnitude of the relaxation force decreases near the wall, whereas for repulsive polarization the magnitude of this force increases compared to the case without dielectric mismatch.
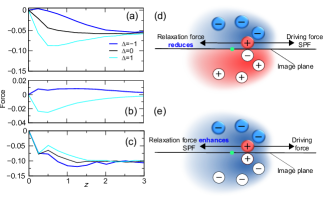
Any asymmetry in the ionic atmosphere will be reflected in the surface polarization charge. Thus, an interesting secondary effect arises, as this surface polarization will also contribute to the relaxation force. This contribution, which we denote the surface polarization force (SPF), acts on ions near the wall and can be isolated in the simulations. Due to the asymmetry of the ion cloud, the SPF has a nonzero component parallel to the surface. Figure 3b shows that for the SPF diminishes the total relaxation force, whereas for it provides an enhancement. The reason for this is clarified by the schematics in Fig. 3d,e. For (Fig. 3d) the image cloud carries a charge opposite to that of the ionic atmosphere, thus causing a SPF in the direction of ion movement. For (Fig. 3e) the ion cloud and its image carry the same charge, so that the SPF opposes the ionic motion. We observe that the SPF contribution to the total relaxation force is considerably smaller for attractive surface polarization than for the repulsive case, reflecting the weaker and less asymmetric cloud in the first system. Thus, the effect of surface polarization on the relaxation force, and consequently on the ion mobility, is twofold. First, it modifies the ion atmosphere and secondly, it exerts a surface polarization force. Both of these effect diminish the relaxation force when and enhance it when .
Lastly, the distance dependence of the collision force opposing the ion movement (Fig. 3c) reflects the concentration profile, increasing as more particles reside near the wall. However, as this force has a weaker dependence on dielectric mismatch, the response of the relaxation force dominates, giving rise to the counterintuitive behavior of the mobility in Fig. 2a,b.
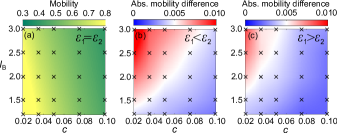
The observations presented here depend on the global electrolyte concentration and on the strength of the electrostatic coupling (expressed in terms of the Bjerrum length ), as those parameters affect both bulk ion mobility and the screening of the surface polarization. In Fig. 4 we explore these dependencies. As a baseline we employ the system without dielectric mismatch (Fig. 4a), which confirms that the mobility decreases with increasing concentration and increases with decreasing , as expected Onsager and Fuoss (1931); Fuoss and Onsager (1957); Fuoss (1978). Figures 4b,c show the absolute deviations compared to this reference system for attractive and repulsive surface polarization. We note that the effects of positive and negative dielectric mismatch on ion mobility differ in magnitude. To emulate an experimental set-up, the mobility in Fig. 4 is determined as an average across the entire channel. Thus, the suppressed electrolyte concentration near low-permittivity surfaces (Fig. 4c) diminishes the influence of reduced ion mobility on the observed average mobility.
As the Bjerrum length is lowered, the region of significant mobility change is reduced to lower concentrations. The lowest concentration studied here is , corresponding to M, i.e., comparable to physiological salt concentrations. If concentrations are reduced further, the effect of surface polarization is enhanced.
Our simulations lack a description of hydrodynamics beyond the Langevin thermostat, and the long-range electrophoretic force is therefore absent in our simulations Jardat et al. (1999). However, this force is affected by changes in the ionic atmosphere in the same manner as the relaxation force, since the magnitude of both forces is directly related to the amount and distribution of charge within the ion cloud Onsager and Fuoss (1931). Thus, inclusion of this force should only enhance the phenomena reported here. The use of an implicit solvent prevents us from observing effects related to the molecular nature of the solvent. The hydration characteristics of ions can affect their mobility by modulating the ion distribution near an interface Qiao and Aluru (2005b). We also do not capture the effects of confinement on the solvent structure, such as the formation of oriented hydration layers at the channel edges and consequent slow-down of ions Qiao and Aluru (2005b) due to hindered water motion in these layers. Moreover, such a layer would modify the dielectric jump at the interface Bonthuis et al. (2011). Yet, the presence of a hydration layer should not qualitatively affect the observed differences between attractive and repulsive surface polarization.
Ion mobility and conductance in nanodevices are a delicate balance of several contributions Balme et al. (2015), which along with the magnitude of the effect and the nanometer scale of the devices may complicate experimental verification of the dielectric modulation of ion mobilities. This, however, does not mean that this effect is of limited practical importance: it is amplified at low concentration, permittivity, and temperature, and by high surface-to-volume ratio.
In conclusion, we have demonstrated that the mobility of ions near interfaces can be regulated via the dielectric mismatch between the solution and the wall material. Surface polarization affects the mobility through two mechanisms, both working in the same direction, that increase the mobility near a high-permittivity surface and decrease it near a surface with low dielectric constant. First, surface polarization affects ion–ion interactions and consequently the shape and intensity of the ionic atmosphere responsible for the relaxation force. Secondly, due to the asymmetry of the counterion atmosphere, a surface polarization force parallel to the interface emerges. We anticipate that these findings can be exploited to understand and control ionic flux on the nanoscale.
I Acknowledgements
Acknowledgements.
We thank Jiaxing Yuan for the PPPM implementation of image charges. This work was supported by the National Institutes of Health through Grant No. 1R01 EB018358-01A1. We acknowledge computational resources from the Quest high-performance computing facility at Northwestern University.References
- Gouaux and MacKinnon (2005) E. Gouaux and R. MacKinnon, “Principles of selective ion transport in channels and pumps,” Science 310, 1461–1465 (2005).
- Kreuer (2014) K.-D. Kreuer, “Ion conducting membranes for fuel cells and other electrochemical devices,” Chem. Mater. 26, 361–380 (2014).
- Kohlrausch (1879) F. Kohlrausch, “Das electrische Leitungsvermögen der wässerigen Lösungen von den Hydraten und Salzen der leichten Metalle, sowie von Kupfervitriol, Zinkvitriol und Silbersalpeter,” Ann. Phys. (Leipzig) 242, 1–210 (1879).
- Kohlrausch (1907) F. Kohlrausch, “Über Ionenbeweglichkeiten im Wasser,” Z. Elektrochem. 13, 333–344 (1907).
- Atkins and de Paula (2006) P. Atkins and J. de Paula, Physical Chemistry, 7th ed. (Oxford University Press, Oxford, U.K., 2006).
- Debye and Hückel (1923) P. Debye and E. Hückel, “Zur Theorie der Elektrolyte. II. Das Grenzgesetz für die elektrische Leitfähigkeit,” Phys. Z. 24, 305–325 (1923).
- Debye (1927) P. Debye, “Report on conductivity of strong electrolytes in dilute solutions,” Trans. Faraday Soc. 23, 334–340 (1927).
- Onsager (1927) L. Onsager, “Zur Theorie der Electrolyte. II,” Phys. Z. 28, 277–298 (1927).
- Onsager and Fuoss (1931) L. Onsager and R. M. Fuoss, “Irreversible processes in electrolytes. Diffusion, conductance, and viscous flow in arbitrary mixtures of strong electrolytes,” J. Phys. Chem. 36, 2689–2778 (1931).
- Fuoss and Onsager (1957) R. M. Fuoss and L. Onsager, “Conductance of unassociated electrolytes,” J. Phys. Chem. 61, 668–682 (1957).
- Fuoss (1978) R. M. Fuoss, “Conductance-concentration function for the paired ion model,” J. Phys. Chem. 82, 2427–2440 (1978).
- Duan and Majumdar (2010) C. Duan and A. Majumdar, “Anomalous ion transport in 2-nm hydrophilic nanochannels,” Nature Nanotech. 5, 848–852 (2010).
- Stein et al. (2004) D. Stein, M. Kruithof, and C. Dekker, “Surface-charge-governed ion transport in nanofluidic channels,” Phys. Rev. Lett. 93, 035901 (2004).
- Nishizawa et al. (1995) M. Nishizawa, V. P. Menon, and C. R. Martin, “Metal nanotubule membranes with electrochemically switchable ion-transport selectivity,” Science 268, 700–702 (1995).
- Cervera et al. (2006) J. Cervera, B. Schiedt, R. Neumann, S. Mafé, and P. Ramírez, “Ionic conduction, rectification, and selectivity in single conical nanopores,” J. Chem. Phys. 124, 104706 (2006).
- Qiao and Aluru (2005a) R. Qiao and N. R. Aluru, “Scaling of electrokinetic transport in nanometer channels,” Langmuir 21, 8972–8977 (2005a).
- Qiao and Aluru (2005b) R. Qiao and N. R. Aluru, “Atomistic simulation of KCl transport in charged silicon nanochannels: Interfacial effects,” Colloids Surf. A 267, 103–109 (2005b).
- Buyukdagli et al. (2011) S. Buyukdagli, M. Manghi, and J. Palmeri, “Ionic exclusion phase transition in neutral and weakly charged cylindrical nanopores,” J. Chem. Phys. 134, 074706 (2011).
- Boda et al. (2006) D. Boda, M. Valiskó, B. Eisenberg, W. Nonner, D. Henderson, and D. Gillespie, “The effect of protein dielectric coefficient on the selectivity of a calcium channel,” J. Chem. Phys. 125, 034901 (2006).
- Zhang et al. (2011) B. Zhang, Y. Ai, J. Liu, S. W. Joo, and S. Qian, “Polarization effect of a dielectric membrane on the ionic current rectification in a conical nanopore,” J. Phys. Chem. C 115, 24951–24959 (2011).
- Mamonov et al. (2003) A. B. Mamonov, R. D. Coalson, A. Nitzan, and M. G. Kurnikova, “The role of the dielectric barrier in narrow biological channels: A novel composite approach to modeling single-channel currents,” Biophys. J. 84, 3646–3661 (2003).
- Tagliazucchi et al. (2013) M. Tagliazucchi, Y. Rabin, and I. Szleifer, “Transport rectification in nanopores with outer membranes modified with surface charges and polyelectrolytes,” ACS Nano 7, 9085–9097 (2013).
- Balme et al. (2015) S. Balme, F. Picaud, M. Manghi, J. Palmeri, M. Bechelany, S. Cabello-Aguilar, A. Abou-Chaaya, P. Miele, E. Balanzat, and J. M. Janot, “Ionic transport through sub-10 nm diameter hydrophobic high-aspect ratio nanopores: experiment, theory and simulation,” Sci. Rep. 5, 10135 (2015).
- Luijten et al. (2002) E. Luijten, M. E. Fisher, and A. Z. Panagiotopoulos, “Universality class of criticality in the restricted primitive model electrolyte,” Phys. Rev. Lett. 88, 185701 (2002).
- Neumann (1883) C. Neumann, Hydrodynamische Untersuchungen, nebst einem Anhange über die Probleme der Elektrostatik und der magnetischen Induction (B.G. Teubner, Leipzig, 1883).
- Hsiao and Luijten (2006) P.-Y. Hsiao and E. Luijten, “Salt-induced collapse and reexpansion of highly charged flexible polyelectrolytes,” Phys. Rev. Lett. 97, 148301 (2006).
- (27) Using nm one obtains V/m, whereas equating the ion mass to the mass of hydrated sodium (131.4 g/mol) yields ps. The damping constant in our simulations is about 2 orders of magnitude smaller than would be representative for the viscosity of water. This allows a faster exploration of the system configurations.
- Wien (1928) M. Wien, “Über den Spannungseffekt der Leitfähigkeit von Elektrolyten in niedrigeren Feldern,” Ann. Phys. (Leipzig) 390, 795–811 (1928).
- Onsager and Kim (1957) L. Onsager and S. K. Kim, “Wien effect in simple strong electrolytes,” J. Phys. Chem. 61, 198–215 (1957).
- Luijten (2013) E. Luijten, “Electrochemistry: Discrete answer,” Nature Phys. 9, 606–607 (2013).
- Debye and Falkenhagen (1928) P. Debye and H. Falkenhagen, “Dispersion der Leitfähigkeit und der Dielektrizitätskonstante starker Elektrolyte,” Phys. Z. 29, 401–426 (1928).
- Falkenhagen (1934) H. Falkenhagen, Electrolytes (Clarendon Press, Oxford, 1934).
- Nadler et al. (2003) B. Nadler, U. Hollerbach, and R. S. Eisenberg, “Dielectric boundary force and its crucial role in gramicidin,” Phys. Rev. E 68, 021905 (2003).
- Zwanikken and Olvera de la Cruz (2013) J. W. Zwanikken and M. Olvera de la Cruz, “Tunable soft structure in charged fluids confined by dielectric interfaces,” Proc. Natl. Acad. Sci. U.S.A. 110, 5301–5308 (2013).
- Korobeynikov et al. (2005) S. M. Korobeynikov, A. V. Melekhov, Y. G. Soloveitchik, M. E. Royak, D. P. Agoris, and E. Pyrgioti, “Surface conductivity at the interface between ceramics and transformer oil,” J. Phys. D: Appl. Phys. 38, 915–921 (2005).
- Jardat et al. (1999) M. Jardat, O. Bernard, P. Turq, and G. R. Kneller, “Transport coefficients of electrolyte solutions from Smart Brownian dynamics simulations,” J. Chem. Phys. 110, 7993–7999 (1999).
- Bonthuis et al. (2011) D. J. Bonthuis, S. Gekle, and R. R. Netz, “Dielectric profile of interfacial water and its effect on double-layer capacitance,” Phys. Rev. Lett. 107, 166102 (2011).