DESY 18-154 ISSN 0418–9833
MITP/18–085
September 2018
-Hadron production in the
general-mass variable-flavour-number scheme
and LHC data
Abstract
We study inclusive -hadron production in collisions
at the LHC at different center-of-mass energies and compare
with experimental data from the LHCb and CMS collaborations.
Our predictions for cross sections differential in the
transverse momentum and (pseudo-)rapidity agree with data
within uncertainties due to renormalization scale variations.
A small tension is found if data and theory predictions
are compared for cross section ratios at different
center-of-mass energies.
PACS: 12.38.Bx, 12.39.St, 13.85.Ni, 14.40.Nd
1 Introduction
The investigation of inclusive production of hadrons containing quarks is particularly important to test quantum chromodynamics (QCD). The predictions in the framework of perturbative QCD are based on the factorization approach. Cross sections are calculated as a convolution of three basic parts: the parton distribution functions (PDF) describing the parton content of the initial hadronic state, the partonic hard scattering cross sections computed as a perturbative series in powers of the strong coupling constant, and the fragmentation functions (FF), which describe the production yield and the momentum distribution for a specified hadron in a parton. Since the -quark mass is large and can often not be neglected compared with the transverse momentum, the cross section for -hadron production depends on several large scales, which makes predictions very challenging.
In the past, measurements of inclusive -hadron production and the corresponding QCD calculations were done first of all for the -mesons, i.e. , , , , , but also and other -baryons have been considered. Data for collisions at TeV have been obtained at the FNAL Tevatron Collider [1, 2] and for collisions at , , and TeV at the CERN Large Hadron Collider (LHC) by the ATLAS, CMS and LHCb collaborations [3, 4, 5, 6, 7, 8]. First measurements of the production cross sections of baryons have been performed by the CMS collaboration at the LHC [9] at TeV and by the LHCb collaboration for and TeV [10].
Almost all of these data have been compared with next-to-leading order (NLO) QCD predictions based on the so-called FONLL approach [11]. Data of the CMS, LHCb and ATLAS collaborations have also been compared with predictions obtained in the general-mass variable-flavour-number scheme (GM-VFNS) [12, 13]. The GM-VFNS [14, 15] (see also [16] for a more recent implementation of the GM-VFNS) is similar to the FONLL scheme but contains different assumptions concerning fragmentation functions, and the transition to the fixed-flavor-number-scheme (FFNS) in the low transverse momentum, , region is treated in a different way. All comparisons between experimental data and theoretical predictions, whether based on the FONLL approach or on the GM-VFNS, show reasonable agreement within experimental uncertainties and taking into account the so-called theoretical error which is estimated by a variation of the factorization and renormalization scale parameters or the heavy quark masses.
An exception from agreement between experimental data and theoretical predictions had originally been reported by the LHCb collaboration [17, 18]. Their primary finding that the ratio of cross sections as a function of the pseudorapidity in the region for and TeV did not agree with corresponding FONLL predictions [20] was corrected later [19] after a mistake in their detector simulation was found which changed the data for the 13 TeV -quark production cross section. In the LHCb analysis, the observed semileptonic decays of hadrons was corrected in such a way that the extracted cross section can be interpreted as a measurement of the inclusive -quark production, not just for one specific -meson species.
Other measurements of -quark production show some discrepancy between data and theoretical predictions, although with smaller significance than what was reported for the now corrected LHCb data. Among them we count the data from the CMS collaboration for inclusive production [8]. Here, mesons were identified by their decay into final states at the energies = 7 and 13 TeV. Differential cross sections were determined both as a function of (integrated over rapidity ranges and ), as well as a function of (integrated over in the ranges GeV and GeV). A discrepancy was observed in a comparison with predictions obtained in the FONLL approach.
The purpose of our present work is to present results for -hadron production cross sections and the cross section ratios in collisions at the LHC in the framework of the GM-VFNS. This framework is essentially the conventional NLO QCD parton-model approach supplemented with heavy-quark finite mass effects intended to improve the description at small and medium transverse momenta. First, we shall apply the GM-VFNS approach for the calculation of the NLO single-inclusive cross sections. Second, we shall investigate the dependence of the cross section ratio on the assumed input PDF. We will show that the cross section ratios have much smaller theoretical uncertainties than the differential cross sections themselves.
The outline of the paper is as follows. In the next section we introduce some details of the calculation, describe our choice of the proton PDFs and the fragmentation functions, and discuss how rapidity and pseudorapidity distributions are related. In Sect. 3 we collect our results for inclusive -hadron cross sections at 7 and 13 TeV and compare with the LHCb data. A similar comparison with CMS data, including also the distribution, is performed in Sect. 4 at 7 and 13 TeV in the central rapidity region. In addition, we discuss theory predictions and experimental results for production in Sect. 5. Our conclusions with some outlook are presented in Sect.6.
2 Setup, input PDFs and FFs
The theoretical description of the GM-VFNS approach as well as the technical details of its implementation have been presented previously in Refs. [14, 15]. Here we describe only the input required for the numerical evaluations discussed below.
As a default we use the proton PDF set CT14 [21] at NLO as implemented in the LHAPDF library [22]. To study the sensitivity on the PDF input we shall use two approaches. First we will use three alternative PDF sets: (i) HERA2.0 [23], (ii) MMHT [24] and (iii) NNPDF3.0 [25]. All these PDF sets are NLO parametrizations, the last two of them are obtained from global fits to essentially the same experimental data as CT14, while the set HERA2.0 is based mainly on cross section data for deep inelastic scattering at HERA. Secondly, for the CT14 parametrization we will also study uncertainties obtained from variations of parameter eigenvalues. There are 56 members of the CT14 set corresponding to 28 pairs of eigenvalue variations. One pair is particularly interesting since it describes an enhanced/suppressed gluon distribution at very low . The PDF uncertainty band is evaluated following the prescription given in Eq. (5) of [26] and corresponds to CL.
To describe the transition of quarks to hadrons we need non-perturbative FFs. We employ the -meson FFs constructed in [27]. They are evolved at NLO and components for the transition from gluons and light quarks (including charm) to a meson are generated through DGLAP evolution. They were obtained by fitting experimental data for inclusive production in annihilation taken by the ALEPH [28] and OPAL [29] collaborations at CERN LEP1 and by the SLD collaboration [30, 31] at SLAC SLC. These data were all taken on the -boson resonance. Therefore was evaluated with and the renormalization and factorization scales were fixed at . The starting scale was chosen to be GeV. Below the light-quark and gluon FFs were assumed to vanish. A simple power ansatz gave the best fit to the experimental data.
One should notice that the -meson FFs of Ref. [27] do not distinguish between different -hadron final states. Both the OPAL [29] and the SLD [30, 31] data include all hadrons, i.e. the mesons , , , and as well as baryons, while in the ALEPH analysis [28] only final states with identified , and mesons were taken into account. Despite of these differences in the experimental analyses it was assumed in [27] that all data can be described by one common FF. The resulting FF fit did indeed not show any significant difference with either of the two data sets, of OPAL and SLD including all -hadrons on the one side, or of ALEPH including only identified -mesons on the other side. The FF was normalized to describe cross section data for and -meson production. They can also be used to calculate the sum of all -hadron states by removing the fragmentation fraction for the transition, which was assumed as in [27].
For simplicity we shall take the initial- and final-state factorization scales entering the PDFs and FFs, respectively, to have the same value, denoted by . The majority of data to which we are going to compare our theory predictions is dominated by low transverse momenta. For example, the LHCb data for the pseudorapidity distribution, , is integrated over all , down to . In a previous work [13] we have shown that the choice with for the factorization scale is appropriate in this case. This choice allows a transition to the fixed-flavour number scheme at finite values of the transverse momentum. The FFNS is the appropriate prescription for heavy-quark production in the range . In the FFNS, sub-processes with heavy quarks in the initial state do not contribute. With our choice of , the scale reaches the heavy-quark threshold already at GeV below which both the -PDF and the FFs are zero. In Ref. [13] we could show that with the cross sections as a function of as measured by LHCb at TeV [32] and by CDF at the Tevatron [1] can be described satisfactorily well down to . The factor is not unique, but small variations like and lead only to small changes, as shown in Ref. [13].
We evaluate the strong coupling as a function of the renormalization scale at NLO with MeV for flavours. This corresponds to MeV above the 5 flavour threshold at . For the -quark pole mass we use GeV in accordance with the value chosen for the FF fit in Ref. [27]. This value is also compatible, though not identical, with the -quark thresholds in the PDF parametrizations which we are going to use.
We have updated the implementation of our program for the calculation of GM-VFNS predictions to allow integration with fixed pseudorapidity. Results in our previous publications have always been given for rapidity intervals. We note that the difference between rapidity and pseudorapidity cross sections is quite substantial for the LHCb data. In Fig. 1 we show contours of constant pseudorapidity in the plane of transverse momentum and rapidity . The calculation is made for the kinematic range relevant for the LHCb experiment to be discussed in the next section and using GeV. One can see that at low , where the dominating contribution to the cross section is found, the average rapidity is shifted to much smaller values compared with the pseudorapidity. It turns out that is increased, compared with , by 50 to 100 % in the high -bins of the LHCb measurements while it is almost the same at smaller values of the (pseudo-)rapidity. The effect on the cross section is not as strong as could be expected from Fig. 1 since the -dependence of the differential cross section is not very strong, but the difference is still relevant. We also note that the results depend little on the exact choice of the particle mass in the relation between rapidity and pseudorapidity and our conclusions would not change if we had used a value corresponding to the lightest meson ( GeV) or even the heavier hadron ( GeV).
3 Comparison with LHCb data
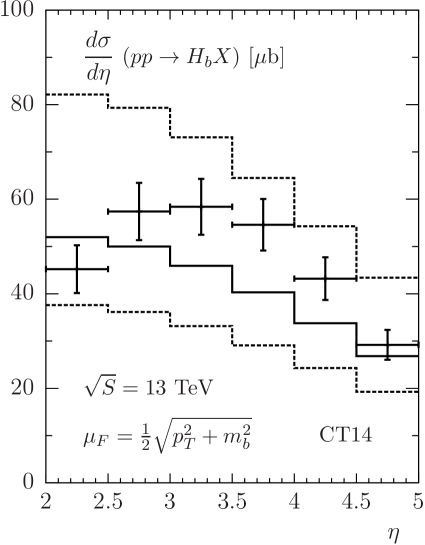
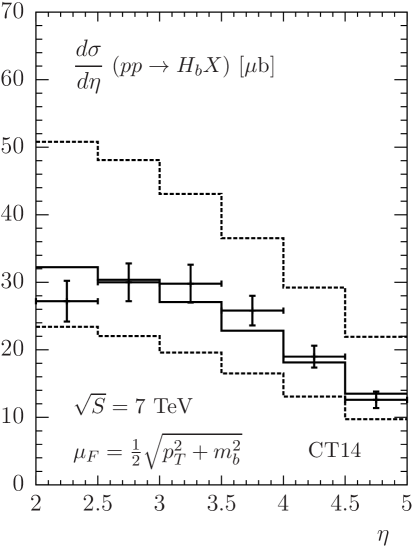
The LHCb collaboration has reported cross section measurements for -hadron production in collisions at and 13 TeV [17, 19]. Results are given for the pseudorapidity dependence, , in 6 equal-sized bins in the range . hadrons are identified by their semileptonic decays into a ground-state charmed hadron in association with a muon. We show these data together with our results (full line histograms) for the proton PDFs of CT14 [21] in Fig. 2. We have used the factorization scale with GeV as in [13]. The renormalization scale was fixed as and varied by a factor of two up and down to obtain an estimate of the theoretical uncertainty. This results in the dashed-line histograms in Fig. 2. The upper limit of the uncertainty band is found for and the lower limit for . We do not observe a discrepancy between data and theoretical results: all data points lie inside the theoretical band for both values of and in all bins. However, the shape of the -dependence at values , where the cross section data decrease with decreasing , is not visible in the theory prediction.

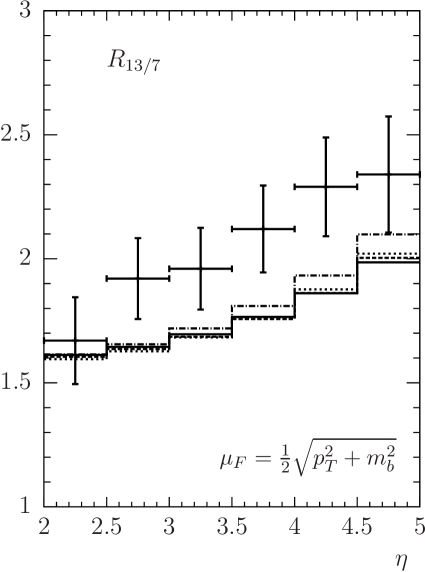
In Fig. 3 we show the ratio of the cross sections for and 7 TeV and compare our results with the experimental values in the six -bins. The figure shows predictions for the CT14 PDFs (full-line histogram). The theoretical result varies between 1.6 and 2.0. The uncertainty due to the variation of the renormalization scale is almost completely cancelled in the ratio. In fact, our numerical calculation is dominated by the statistical uncertainty of the Monte Carlo integration – the error band shown in Fig. 3 (dashed-line histograms) is representing this numerical uncertainty.
The cross section ratio is not affected by the large uncertainties from scale variations since one should use the same prescription for fixing the scales in the numerator and in the denominator. The theory uncertainties of the cross sections at the different center-of-mass energies can not be treated like experimental errors, which have to be added in quadrature. We note that the agreement between data and theory could be improved if we used different scale choices for the different energies. As an example, we show in Fig. 3 how the ratio is changed if the cross section for TeV is calculated with instead of ; the latter choice of scale is kept for the calculation at TeV. This prescription moves the ratio up in such a way that the data are perfectly well described in the upper five bins. Only the first bin shows a slight discrepancy. Of course, such a prescription to fix the factorization scale would be rather ad-hoc and we have no theoretical justification for it, however, it is also not forbidden by theory. We do not attempt to introduce an additional dependence of scales, because such an approach would be even less well motivated.
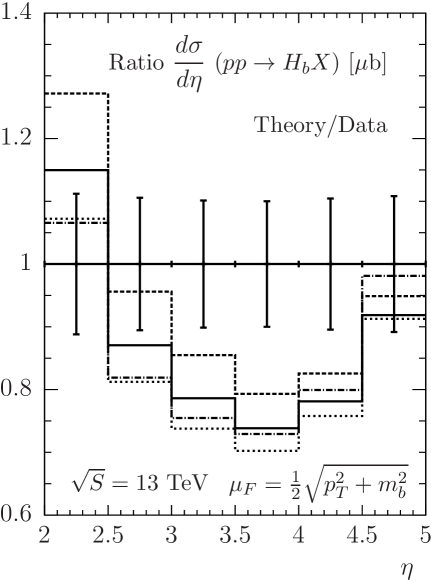
It is well-known that the theory uncertainty for the cross sections is dominated by far by scale variations. These errors cancel, however, in the ratio . We therefore shall have a closer look at uncertainties due to the PDF input. First, in Fig. 4 we show results where we have used also the PDF parametrizations HERAPDF2.0 [23], MMHT [24] and NNPDF3.0 [25]. Here, the theory results for are all normalized to the data and for better visibility we do not include the uncertainties due to scale variations. The corresponding error band would partly lie outside the range of values shown in this figure and the data points are all found inside the theory error band (see Fig. 2). We can see in Fig. 4 that the calculated cross sections do not depend strongly on the PDF input. This is, of course, not surprising since all PDF sets are based on fits to (almost) the same data.
Figure 5 shows the cross section ratio for the four different PDF sets. In the first few bins, the predictions are remarkably stable with respect to PDF variations. Only in the bin for the largest value, one can observe that the PDF set MMHT leads to a roughly 5 % increase of which brings the prediction closer to the measured value, but this shift is smaller than the experimental uncertainty.
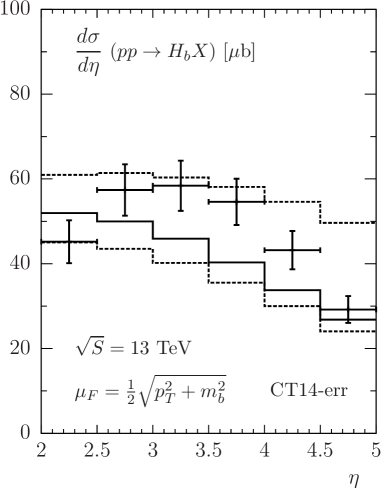
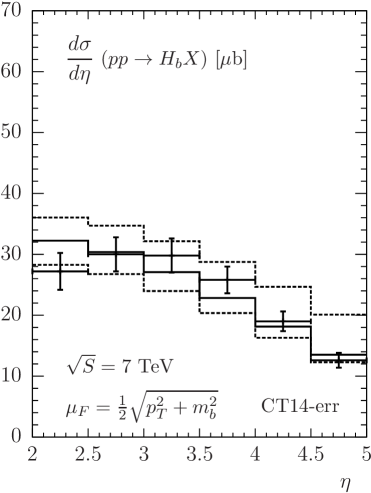
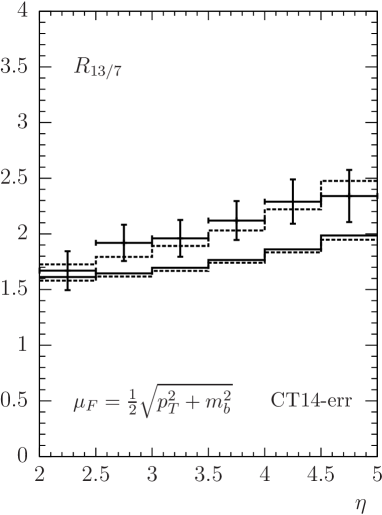
Assuming only ad-hoc changes of the proton PDF can not be expected to take full account of PDF uncertainties propagated from the data input on which the PDF fits are based. We therefore add results obtained by using uncertainty estimates which are now often also provided in a parametrized form by the PDF fitter collaborations. To be specific, we use the CT14 PDF set members with 28 pairs of parameter eigenvalue variations. One pair is particularly interesting since it describes an enhanced or suppressed gluon distribution at very low . Our results are shown in Fig. 6 for at TeV (upper left panel), TeV (upper right panel), and for the ratio (lower panel). The dashed histograms represent the 90 % confidence level111To obtain a 68% CL error band, one has to rescale the results by the factor 1/1.645. maximal and minimal variations obtained from the CT14 eigenvalue variations, evaluated following the prescription described in Ref. [26]. We find that indeed the PDF member pair 53 and 54 with an extreme choice of the gluon PDF has the strongest impact; the upward variation is dominated by one single eigenvector (member 53). The corresponding choice of the gluon distribution at low is possible since data still do not provide sufficient information. A similar observation has been made in a study of prompt neutrino fluxes from atmospheric charm production [33]. depends strongly on the gluon PDF since -hadron production is dominated by the sub-process at small and at small scales. This agrees with results of Ref. [34]. As can be seen in Fig. 6, the cross sections for and 7 TeV lie well inside the uncertainty band, while the ratio favors the upper limit of the CT14 error band. From our comparison we conclude that future PDF fits, in particular concerning the gluon PDF, could profit strongly from data for the -quark production cross section ratio.
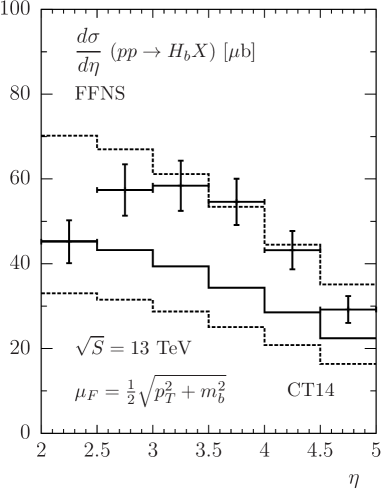
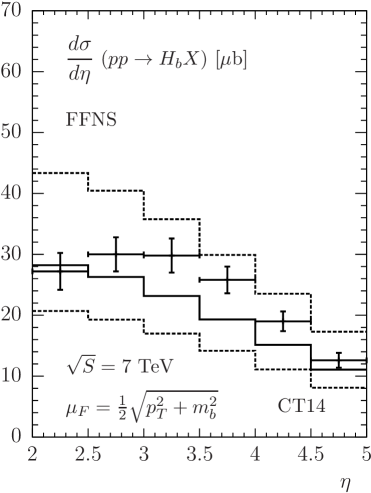
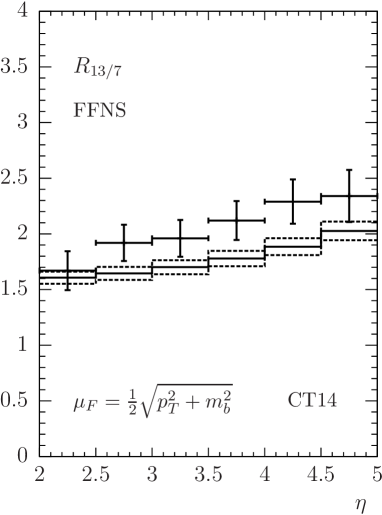
We finish this section with a comparison of the data with predictions obtained in the FFNS. In this approach, heavy quarks are produced at leading order only in the channel and potentially large logarithms proportional to are not factorized into the PDFs and FFs. Consequently, there is no scale-dependent FF for the transition from quarks to hadrons. Since the LHCb data include all hadrons, we simply assume that the final state is given by a quark, i.e. we use a function as FF for the transition of a -quark to a hadron. We use the CT14 PDFs including gluons and the light quarks , , and in the initial state, but no contribution from incoming quarks. The charm quark is treated as massless in this approach as before. In principle one should use a PDF set which is determined in the same framework of the FFNS with , also including effects due to the non-zero charm mass [35], but from previous experience we do not expect large differences for such a more consistent approach. Results are shown in Fig. 7. The general picture looks quite similar to the GM-VFNS. The FFNS predictions are reduced by 15 to 20 percent, but the data are still within the theory uncertainty band. A comparison of the measured ratio with theory predictions in the FONNL framework [20] and using the NNPDF3.0 PDFs has also been presented in Ref. [19]. The results look very similar to ours as shown in Figs. 2 and 3.
4 Comparison with CMS data


There are also data from the CMS collaboration for the ratio of cross sections for -hadron production, however obtained from a measurement which includes only -meson final states, . Cross section data are available for TeV [8] and TeV [5]. mesons were identified using the decay . The main difference to the LHCb analysis for is the kinematic range covered. CMS have used the rapidity of the reconstructed meson instead of the pseudorapidity as in the LHCb analysis. The ratio was obtained in the range and , depending on different lower limits of the range: GeV for and GeV for , respectively [8].
We have calculated the cross section at TeV for the nine bins in the region GeV as in the data analysis: two bins with GeV and GeV for and seven bins for GeV for . For consistency with the discussion in the previous section, we use also here the factorization scale and the renormalization scale and vary up and down by a factor of 2. The result is shown in the left panel of Fig. 8. The agreement between our calculation and the measured cross section is satisfactory. The measured values for lie mostly close to the results for the scale choice which leads to the maximal cross section, i.e. . This relation between data and theory is similar to the comparison with FONLL predictions shown in Ref. [8]. Only the data point for the smallest bin lies well above the prediction and outside the theory error estimate.


In the right panel of Fig. 8 we show the cross section for eight bins integrated over the respective regions: GeV (first six lowest bins) and GeV (two highest bins). The data are compared to our predictions. The shape as a function of is very well reproduced, but the normalization of the cross section data is higher than the calculated values. This is due to the fact that we have used the modified factorization scale . With the original choice , which is more appropriate for the cross section at larger , we have found perfect agreement between data and theoretical predictions.
The ratios as a function of and are also reported in Ref. [8]. The data and the results of our calculation are shown in Fig. 9 (left frame for the -, right frame for the -dependence). The four points for between and GeV are larger than our predictions, approximately by a factor of 1.6. Due to the rather large experimental errors, however, the disagreement in the CMS data is not very significant. The ratio as a function of is shown in Fig. 9 (right frame). The measured ratio for eight bins, also taken from Ref. [8], is again larger than the calculated ratio. Again, due to the large experimental uncertainties it is difficult to draw a definite conclusion from this comparison, similar to the case for the -dependence of this ratio.
In the large- region covered by the CMS measurements we do not expect any significant dependence of the theoretical cross sections on different choices of input for the proton PDFs. Here we decided to test PDF uncertainties using the 26 pairs of eigenvalue variations of the CT14NLO PDFs [21]. We present the results in Fig. 10 for the cross section for (left part) and for the ratio (right part). We find rather small uncertainties from this calculation, definitely much smaller than the uncertainties from scale variations for the theory prediction or from experimental sources for the data points.
5 Comparison with LHCb data for inclusive production from mesons
Another possibility to compare theoretical predictions with data for -quark production with other final states is provided by a measurement of the LHCb collaboration of inclusive production from -meson decays. Data are available for the ratio as a function of and rapidity at TeV [36] and TeV [37]. Some years ago, one of us together with P. Bolzoni and B. A. Kniehl has considered this particular decay channel in the framework of the GM-VFNS incorporating theoretical input about the inclusive decay of hadrons into mesons [38]. Predictions have been compared with experimental data for from the CDF, ALICE, ATLAS, CMS and LHCb collaborations existing at that time. In [38] it was found that the data collected by these collaborations agreed reasonably well with the theoretical predictions.


Based on that earlier work we now calculate the transverse momentum and rapidity-dependent cross sections and for TeV and TeV and study the ratio as a function of and and compare with the experimental data presented in [37]. In contrast to the earlier work on production from -hadron decay we now use the modified scale as described in Sec. 2. We expect that the scale choice is required to achieve a reasonable description of data also at low . Our results for as a function of for TeV and TeV are shown in Fig. 11 in the left and right upper panels, resp. The theory results are compared with data taken from Refs. [37] (for TeV) and [36] (for TeV). The experimental data points lie well inside the theoretical range which is determined from scale variations as usual. On average, the range between the default scale and the scale choice which leads to the maximal cross section is preferred by the data. The ratio for as a function of is shown in the lower panel of Fig. 11. The theoretical prediction for increases from 1.5 to about 2.2 and lies systematically below all data points, even when taking into account experimental uncertainties. The theoretical prediction for the ratio has essentially no scale dependence since we take the ratio of cross sections with identical scale parameters in the numerator and denominator. Numerical uncertainties are small and not shown in the figure.


The rapidity dependence of the cross section, , in the range integrated over the transverse momentum in the range GeV is presented in Fig. 12. The upper left panel shows the cross section as a function of for TeV, the upper right panel for TeV. Corresponding experimental data were given in Refs. [37, 36] in five bins of size . While the TeV data agree perfectly well with predictions for the default scale, the data at TeV lie somewhat below the prediction for the default scale, but still inside the theory uncertainty band whose lower limit is obtained with the choice . The theoretical result for the ratio as a function of is shown in the lower panel of Fig. 12. Here, the agreement between theory and data is rather marginal. A better agreement could be found if the prediction for at TeV was slightly lower. In the present case, the strongest deviation between data and theory is in the last bins at the high values.
6 Conclusions
As a conclusion from our analysis of predictions for inclusive -hadron production in collisions at the LHC we can state that the majority of experimental data for the cross sections, differential in transverse momentum or in (pseudo-)rapidity, are reasonably well described by theory. This is mainly due to the large theory uncertainty due to variations of the renormalization scale. An exception is maybe seen in the comparison with -meson production data from the CMS collaboration at TeV where the cross section data are somewhat higher than theory.
In all the cases we found some tension between data and theory if the comparison is based on the cross section ratio for different center-of-mass energies. The data prefer slightly higher values of for -hadron production measured by the LHCb collaboration and for -meson production measured by the CMS collaboration. Also the LHCb data for the ratio of production through decays from mesons is higher than our predictions.
We found that the cross section ratios are remarkably stable with respect to variations of the renormalization scale if one follows the wide-spread assumption that the renormalization and factorization scales should depend only on the transverse momentum of the observed hadron. Our calculations show that a weakly -dependent choice of scales would further reduce the significance of the slight disagreement. Such a scale choice is theoretically neither well-motivated, nor completely unreasonable.
As a consequence of the stability of theoretical predictions with respect to scale variations, one can also conclude that the cross section ratios will serve as important input for improved determinations of PDF parametrizations. This was exemplified in particular in a comparison with members of the CT14 PDF parametrizations. Future fits could result in an improved knowledge of the gluon PDF at low and, correlated with the low of the data, at low scale. In order to test such a possibility further it will be important to include also data at larger . It would also be helpful if the LHCb collaboration could provide their data for -hadron production with a higher value of the minimum transverse momentum. An extension of the kinematic range, both in transverse momentum and in (pseudo-)rapidity, is also important to test whether data from different experiments and with different -hadron final states are compatible with each other.
References
- [1] D. Acosta et al. [CDF Collaboration], Phys. Rev. D 71 (2005) 032001 [hep-ex/0412071].
- [2] A. Abulencia et al. [CDF Collaboration], Phys. Rev. D 75 (2007) 012010 [hep-ex/0612015].
- [3] G. Aad et al. [ATLAS Collaboration], JHEP 1310 (2013) 042 [arXiv:1307.0126 [hep-ex]].
- [4] V. Khachatryan et al. [CMS Collaboration], Phys. Rev. Lett. 106 (2011) 112001 [arXiv:1101.0131 [hep-ex]].
- [5] S. Chatrchyan et al. [CMS Collaboration], Phys. Rev. Lett. 106 (2011) 252001 [arXiv:1104.2892 [hep-ex]].
- [6] S. Chatrchyan et al. [CMS Collaboration], Phys. Rev. D 84 (2011) 052008 [arXiv:1106.4048 [hep-ex]].
- [7] R. Aaij et al. [LHCb Collaboration], JHEP 1204 (2012) 093 [arXiv:1202.4812 [hep-ex]].
- [8] V. Khachatryan et al. [CMS Collaboration], Phys. Lett. B 771 (2017) 435 [arXiv:1609.00873 [hep-ex]].
- [9] S. Chatrchyan et al. [CMS Collaboration], Phys. Lett. B 714 (2012) 136 [arXiv:1205.0594 [hep-ex]].
- [10] R. Aaij et al. [LHCb Collaboration], Chin. Phys. C 40 (2016) 011001 [arXiv:1509.00292 [hep-ex]].
- [11] M. Cacciari, S. Frixione, N. Houdeau, M. L. Mangano, P. Nason and G. Ridolfi, JHEP 1210 (2012) 137 [arXiv:1205.6344 [hep-ph]].
- [12] B. A. Kniehl, G. Kramer, I. Schienbein and H. Spiesberger, Phys. Rev. D 84 (2011) 094026 [arXiv:1109.2472 [hep-ph]].
- [13] B. A. Kniehl, G. Kramer, I. Schienbein and H. Spiesberger, Eur. Phys. J. C 75 (2015) 140 [arXiv:1502.01001 [hep-ph]].
- [14] B. A. Kniehl, G. Kramer, I. Schienbein and H. Spiesberger, Phys. Rev. D 71 (2005) 014018 [hep-ph/0410289].
- [15] B. A. Kniehl, G. Kramer, I. Schienbein and H. Spiesberger, Eur. Phys. J. C 41 (2005) 199 [hep-ph/0502194].
- [16] I. Helenius and H. Paukkunen, JHEP 1805 (2018) 196 [arXiv:1804.03557 [hep-ph]].
- [17] R. Aaij et al. [LHCb Collaboration], Phys. Rev. Lett. 118 (2017) 052002 [arXiv:1612.05140v4 [hep-ex]].
- [18] CERN Courier 56, Number 8, October 2016, p. 12.
- [19] R. Aaij et al. [LHCb Collaboration], Erratum: Phys. Rev. Lett. 119 (2017) 169901 [arXiv:1612.05140v9 [hep-ex]].
- [20] M. Cacciari, M. L. Mangano and P. Nason, Eur. Phys. J. C 75 (2015) 610 [arXiv:1507.06197 [hep-ph]].
- [21] S. Dulat et al., Phys. Rev. D 93 (2016) 033006 [arXiv:1506.07443 [hep-ph]].
-
[22]
A. Buckley, J. Ferrando, S. Lloyd, K. Nordström, B. Page,
M. Rüfenacht, M. Schönherr and G. Watt,
Eur. Phys. J. C 75 (2015) 132
[arXiv:1412.7420 [hep-ph]].
http://projects.hepforge.org/lhapdf/pdfsets - [23] H. Abramowicz et al. [H1 and ZEUS Collaborations], Eur. Phys. J. C 75 (2015) 580 [arXiv:1506.06042 [hep-ex]].
- [24] L. A. Harland-Lang, A. D. Martin, P. Motylinski and R. S. Thorne, Eur. Phys. J. C 75 (2015) 204 [arXiv:1412.3989 [hep-ph]].
- [25] R. D. Ball et al. [NNPDF Collaboration], JHEP 1504 (2015) 040 [arXiv:1410.8849 [hep-ph]].
- [26] H. L. Lai, M. Guzzi, J. Huston, Z. Li, P. M. Nadolsky, J. Pumplin and C.-P. Yuan, Phys. Rev. D 82 (2010) 074024 [arXiv:1007.2241 [hep-ph]].
- [27] B. A. Kniehl, G. Kramer, I. Schienbein and H. Spiesberger, Phys. Rev. D 77 (2008) 014011 [arXiv:0705.4392 [hep-ph]].
- [28] A. Heister et al. [ALEPH Collaboration], Phys. Lett. B 512 (2001) 30 [hep-ex/0106051].
- [29] G. Abbiendi et al. [OPAL Collaboration], Eur. Phys. J. C 29 (2003) 463 [hep-ex/0210031].
- [30] K. Abe et al. [SLD Collaboration], Phys. Rev. Lett. 84 (2000) 4300 [hep-ex/9912058].
- [31] K. Abe et al. [SLD Collaboration], Phys. Rev. D 65 (2002) 092006 Erratum: [Phys. Rev. D 66 (2002) 079905] [hep-ex/0202031].
- [32] R. Aaij et al. [LHCb Collaboration], JHEP 1308 (2013) 117 [arXiv:1306.3663 [hep-ex]].
- [33] M. Benzke, M. V. Garzelli, B. Kniehl, G. Kramer, S. Moch and G. Sigl, JHEP 1712 (2017) 021 [arXiv:1705.10386 [hep-ph]].
- [34] R. Gauld, JHEP 1705 (2017) 084 [arXiv:1703.03636 [hep-ph]].
- [35] J. Blümlein, A. De Freitas, C. Schneider and K. Schönwald, Phys. Lett. B 782 (2018) 362 [arXiv:1804.03129 [hep-ph]].
- [36] R. Aaij et al. [LHCb Collaboration], JHEP 1306 (2013) 064 [arXiv:1304.6977 [hep-ex]].
- [37] R. Aaij et al. [LHCb Collaboration], JHEP 1510 (2015) 172 Erratum: [JHEP 1705 (2017) 063] [arXiv:1509.00771 [hep-ex]].
- [38] P. Bolzoni, B. A. Kniehl and G. Kramer, Phys. Rev. D 88 (2013) 074035 [arXiv:1309.3389 [hep-ph]].