11email: [padovani,galli]@arcetri.astro.it 22institutetext: Max-Planck-Institut für Extraterrestrische Physik, Giessenbachstr. 1, 85741 Garching, Germany
22email: [ivlev,caselli]@mpe.mpg.de 33institutetext: Scuola Normale Superiore, Piazza dei Cavalieri 7, 56126 Pisa, Italy
33email: andrea.ferrara@sns.it
Production of atomic hydrogen by cosmic rays in dark clouds
Abstract
Context. The presence of small amounts of atomic hydrogen, detected as absorption dips in the 21 cm line spectrum, is a well-known characteristic of dark clouds. The abundance of hydrogen atoms measured in the densest regions of molecular clouds can be only explained by the dissociation of due to cosmic rays.
Aims. We want to assess the role of Galactic cosmic rays in the formation of atomic hydrogen, by using recent developments in the characterisation of the low-energy spectra of cosmic rays and advances in the modelling of their propagation in molecular clouds.
Methods. We model the attenuation of the interstellar cosmic rays entering a cloud and compute the dissociation rate of molecular hydrogen due to collisions with cosmic-ray protons and electrons as well as fast hydrogen atoms. We compare our results with the available observations.
Results. The cosmic-ray dissociation rate is entirely determined by secondary electrons produced in primary ionisation collisions. These secondary particles constitute the only source of atomic hydrogen at column densities above cm-2. We also find that the dissociation rate decreases with column density, while the ratio between the dissociation and ionisation rates varies between about 0.6 and 0.7. From comparison with observations we conclude that a relatively flat spectrum of interstellar cosmic-ray protons, as the one suggested by the most recent Voyager 1 data, can only provide a lower bound for the observed atomic hydrogen fraction. An enhanced spectrum of low-energy protons is needed to explain most of the observations.
Conclusions. Our findings show that a careful description of molecular hydrogen dissociation by cosmic rays can explain the abundance of atomic hydrogen in dark clouds. An accurate characterisation of this process at high densities is crucial for understanding the chemical evolution of star-forming regions.
Key Words.:
ISM: cosmic rays – ISM: clouds – atomic processes – molecular processes1 Introduction
The formation of molecular hydrogen occurs on dust grains in molecular clouds through the reaction between two hydrogen atoms. Being an exothermic process, is then released into the gas phase. Depending on position in the cloud (or the amount of visual extinction measured inward from the cloud’s edge), two processes determine the destruction of and the restoration of the atomic form: photodissociation due to interstellar (hereafter IS) UV photons and dissociation due to cosmic rays (hereafter CRs). In the diffuse part of molecular clouds, UV photons regulate the abundance of atomic hydrogen by dissociating , while in the densest parts IS UV photons are blocked by dust absorption as well as by line absorption (Hollenbach et al. 1971). In the deepest parts of the cloud, CRs dominate the destruction of molecular hydrogen.
A wealth of studies have been carried out to characterise the origin of the atomic hydrogen component in dense environments (e.g. McCutcheon et al. 1978; van der Werf et al. 1988; Montgomery et al. 1995; Li & Goldsmith 2003; Goldsmith & Li 2005), but the rate of CR dissociation was always assumed to be constant (i.e., independent of the position in the cloud) or simply neglected. In this paper we want to explore in more detail the role of CRs – especially after the latest data release of the Voyager 1 spacecraft (Cummings et al. 2016), showing that the measured proton and electron fluxes are not able to explain the values of the CR ionisation rate estimated in diffuse clouds (e.g. Indriolo et al. 2015; Phan et al. 2018). In our previous work (e.g. Padovani et al. 2009; Padovani & Galli 2013; Padovani et al. 2013; Ivlev et al. 2015; Padovani et al. 2018) we postulated the presence of a low-energy component in the IS CR proton spectrum, with which it is possible to recover the high ionisation rates observed in diffuse clouds.
We treat a cloud as a semi-infinite slab. Such a simplification is completely justified for our purposes, for the following reasons. First, attenuation of IS UV photons occurs in a thin gas layer near the cloud’s surface (with a visual extinction of mag), i.e., at column densities much smaller than those characterising the line-of-sight thickness of a cloud. Second, CRs propagate through a cloud along the local magnetic field. The latter assumption is always valid since the Larmor radius of sub-relativistic CRs is much smaller than any characteristic spatial scale of the cloud (Padovani & Galli 2011) and the correlation length of the magnetic field (Houde et al. 2009). Therefore, irrespective of the field geometry, we can measure the coordinate along the local field line and treat the problem as one-dimensional (Padovani et al. 2018)111The CR ionisation rate is then a function of the effective column density, measured along the field line. To facilitate the presentation of our results, in this paper we assume the line-of-sight and the effective column densities to be the same.. One can straightforwardly generalise these considerations to a slab of a finite thickness by adding IS particles entering the cloud from the opposite side; however, given a strong attenuation, this addition is only important for clouds with column densities of cm-2 or less (increasing the ionisation and dissociation rates in the cloud’s centre by up to a factor of 2).
The paper is organised as follows: in Sect. 2 we discuss the main processes of dissociation by CR protons, electrons, and fast hydrogen atoms, and carefully compute the resulting dissociation rate as a function of the column density; in Sect. 3 we present equations to compute the fractions of atomic and molecular hydrogen; in Sect. 4 we compare our theoretical findings with available observations; in Sect. 5 we discuss implications for our outcomes and summarise the most important results.
2 CR dissociation reactions with H2
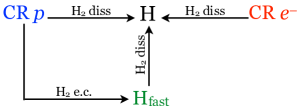
We consider dissociation processes induced by CR primary and secondary electrons, CR protons, and fast hydrogen atoms colliding with molecular hydrogen. A schematic diagram of different dissociation paths is depicted in Fig. 1.
2.1 Electron impact
Electrons can produce atomic hydrogen through excitation of five electronic states of the triplet (, , , , and ) followed by dissociation. While the radiative decay from the state is fully dissociative, the decay from contributes to dissociation at 20%, and dissociation from the other states is negligible222There is also a contribution from the singlet state, but the respective cross section peaks at about eV with a maximum value of cm2, which is a factor lower than the peak value of the triplet-state cross section.. Thus, the dissociation cross section by electron impact is given by
| (1) |
2.2 Proton impact
Atomic hydrogen can also be produced by protons, by direct dissociation of H2 from the vibrational state . The excitation cross sections by electrons, , and the dissociation cross section by protons, , have been parameterised by Janev et al. (2003) as
| (2) |
with the energy in eV. In Table 1 we list the values of factor , exponents , and the energy threshold for the respective cross sections.
| Reaction | [eV] | ||||
|---|---|---|---|---|---|
| 4.64 | 5.37 | 2.18 | 6.72 | ||
| 3.00 | 2.33 | 3.78 | 7.93 | ||
| 3.00 | 4.50 | 1.60 | 13.0 |
2.3 Fast hydrogen atom impact
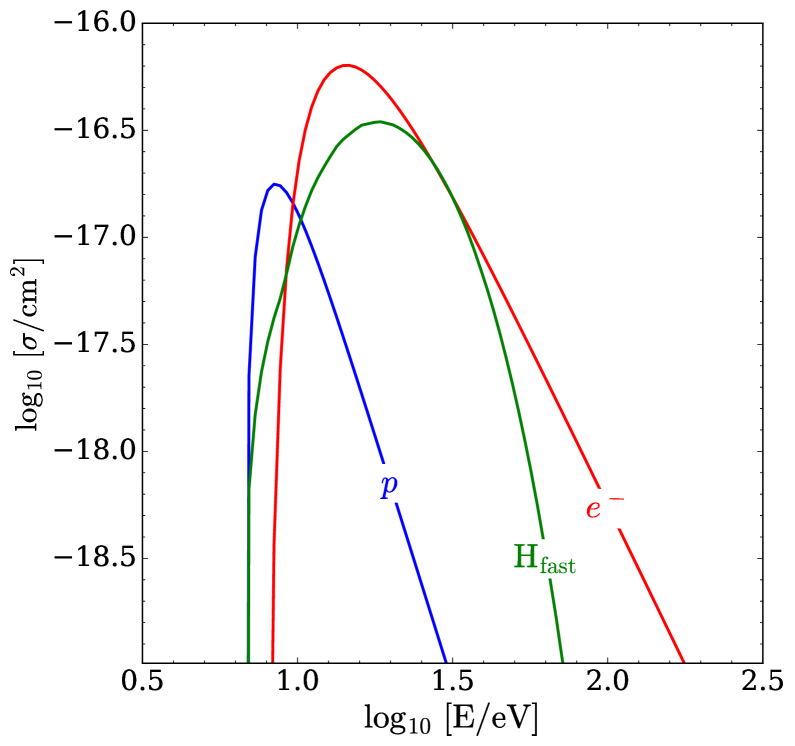
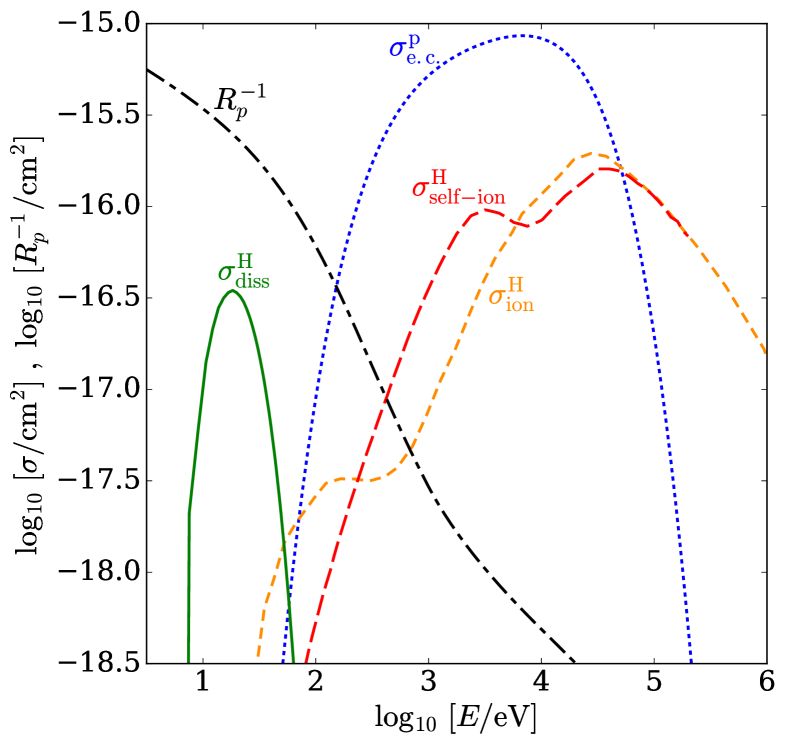
Figure 2 shows that dissociation cross sections peak at very low energy, about 8 and 15 eV for protons and electrons, respectively, so one has to carefully look into the processes that regulate the distributions of different species in this energy range. In Appendix A we demonstrate that CR protons are efficiently neutralised at low energies because of electron capture (see also Chabot 2016). This generates a flux of fast H atoms (hereafter Hfast) that, in turn, creates fast ions (“secondary” CR protons) through the reaction (14). We compute the equilibrium distributions of protons and atoms, finding that below eV less than 10% of (non-molecular) hydrogen is in the form of (see Fig. 7 in Appendix A), so that the dissociation by Hfast (reaction 14) must be taken into account. The corresponding cross section, (Dove & Mandy 1986; Esposito & Capitelli 2009) is also plotted in Fig. 2.
2.4 CR dissociation rate
The rate of dissociation due to primary and secondary CRs and Hfast atoms, occurring at the total column density , is given by
| (3) |
where is the differential flux of CR particles , is the dissociation cross section, and . In the semi-infinite slab geometry, the factor is equal to 1 for primary CRs and Hfast, and to 2 for secondary electrons (because the latter are produced isotropically). The final expression for the dissociation rate is obtained by averaging over the pitch-angle distribution of the incident CRs (see Eq. 45 in Padovani et al. 2018).
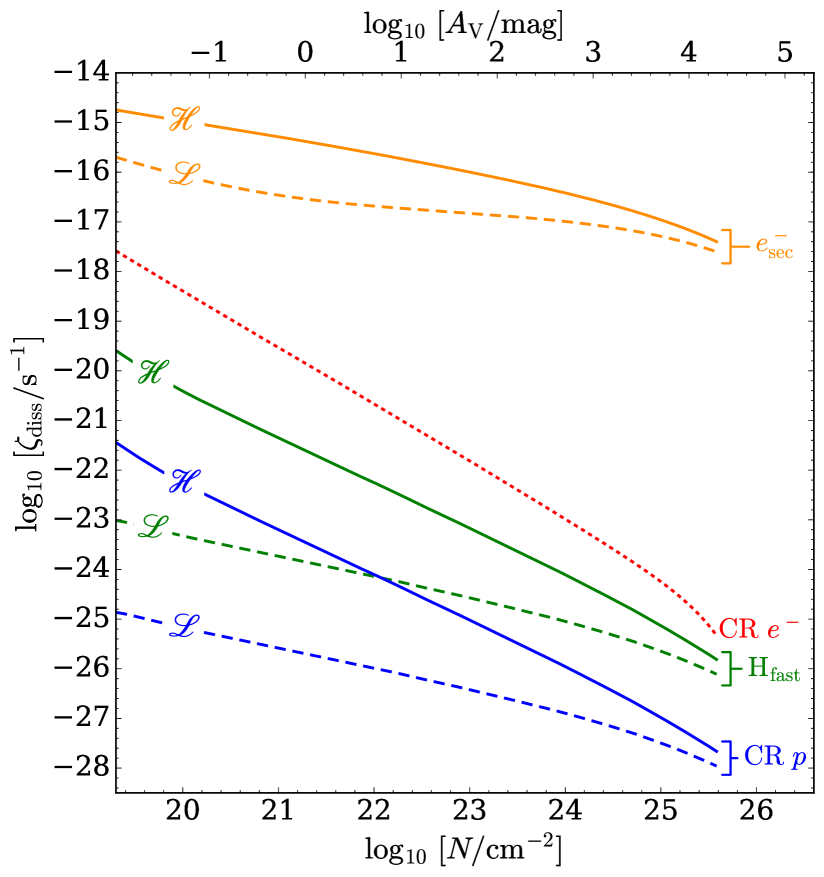
In the following we assume the same IS CR proton and electron spectra as in Ivlev et al. (2015) and Padovani et al. (2018). For CR protons we adopt two different models: the first one, model , is an extrapolation of the Voyager 1 observations to lower energies; the second one, model , is characterised by an enhanced flux of low-energy protons with respect to Voyager 1 data. Models and can be regarded as the lower and the upper bound, respectively, of the average Galactic CR proton spectrum, since the corresponding CR ionisation rates encompass the values estimated from observations in diffuse clouds (e.g. Indriolo et al. 2015; Neufeld & Wolfire 2017). For CR electrons, we use a single model based on the latest Voyager results, which show that the electron flux varies at MeV as (Cummings et al. 2016). Figure 3 shows the partial contributions to the dissociation rate of primary CR protons and electrons, Hfast atoms, and secondary electrons. The latter is computed following Eq. (16) in Ivlev et al. (2015). In Fig. 3 we also show the corresponding visual extinction, . One can see that is entirely dominated by low-energy secondary electrons, produced during the propagation of primary CRs.
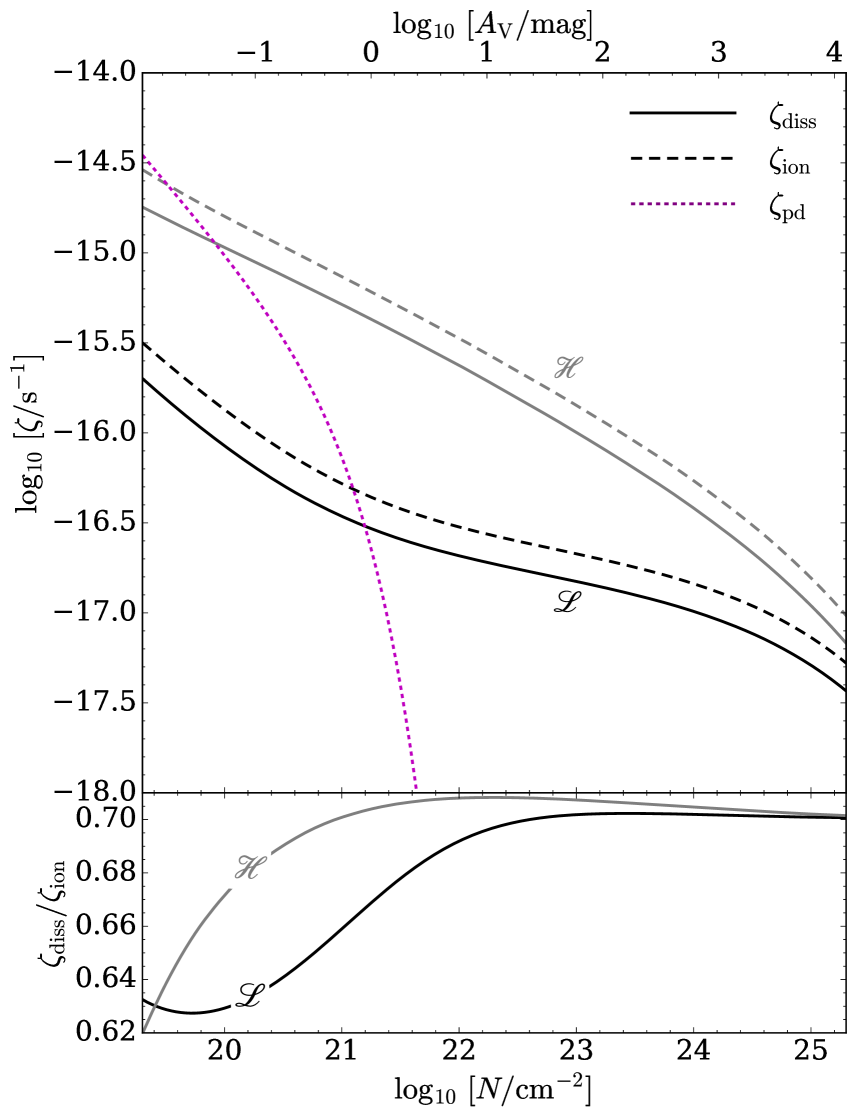
In previous work (e.g., Li & Goldsmith 2003; Goldsmith & Li 2005), has usually been assumed to be equal to the CR ionisation rate, (which, in turn, did not depend on ). In Fig. 4 we show that and exhibit very similar behaviour, decreasing monotonically with ; the ratio can be as small as at low column densities ( cm-2), depending on the assumed spectrum of IS CR protons. This ratio rapidly approaches the constant value of , and at cm-2 becomes independent of the column density and the IS proton spectrum. The values of and are comparable because secondary electrons provide the major contribution to both processes. We note that the ionisation rate has been computed by taking into account the presence of atoms (see Eq. B in Appendix B), contributing to the production of ions through the reaction (14) at energies below eV. However this process is only marginally important for model below cm-2, and is always negligible for model (see Appendix B). Figure 4 also shows the photodissociation rate, , computed following Draine (2011).
3 Balance equation
Goldsmith & Li (2005) and Goldsmith et al. (2007) presented a time-dependent modelling of the H abundance in molecular clouds and introduced the concept of atomic-to-molecular hydrogen ratio, , as a clock of the cloud’s evolutionary stage. In particular, Goldsmith & Li (2005) modelled observations of in five dark clouds, concluding that the characteristic time required to reach a steady-state ratio is close to the cloud ages. In the following, we consider the steady-state solution, keeping in mind that time dependence may still affect the interpretation of the observational data (see Sect. 4.1).
In steady-state, the balance between formation and destruction processes gives
| (4) |
Here, is the total volume density of hydrogen, is the formation rate coefficient, is the unattenuated photodissociation rate, is the attenuation factor for dust absorption and -self shielding, and is the CR dissociation rate. In the following we assume cm3 s-1 (Jura 1975) and s-1 (Draine 2011, taking into account a semi-infinite slab geometry), where is the FUV radiation field in Habing units (Habing 1968). Unless specified otherwise, we adopt . The attenuation factor is usually written in the form
| (5) |
where is the self-shielding factor (Tielens 2010, valid for ) and is the dust attenuation. Here, is the total column density of hydrogen and cm2 is the average value of the FUV dust grain absorption cross section for solar metallicity (Draine 2011).
Assuming and , Eq. (4) becomes
| (6) |
The fractions of atomic and molecular hydrogen can be expressed as
| (7) |
and
| (8) |
respectively. In the next section we describe in detail all the processes that contribute to the dissociation of molecular hydrogen.
4 Comparison with observations
Li & Goldsmith (2003) performed a survey of dark clouds in the Taurus-Perseus region, and reported the detection of H I narrow self-absorption features. This allowed them to compute the atomic and molecular hydrogen fraction (Eqs. 7 and 8). They concluded that a relevant fraction of atomic hydrogen is mixed with in the densest part of a cloud, shielded from the IS UV flux.
At high column densities typical of dark clouds, the attenuation factor in Eq. (4) is so large that the UV photodissociation is inefficient, and the observed ratios can only be explained by CR dissociation. In Sect. 2.4, we showed that at typical column densities of dark clouds ( cm-2); more importantly, is not constant, but decreases with (e.g., Padovani et al. 2009, 2018).
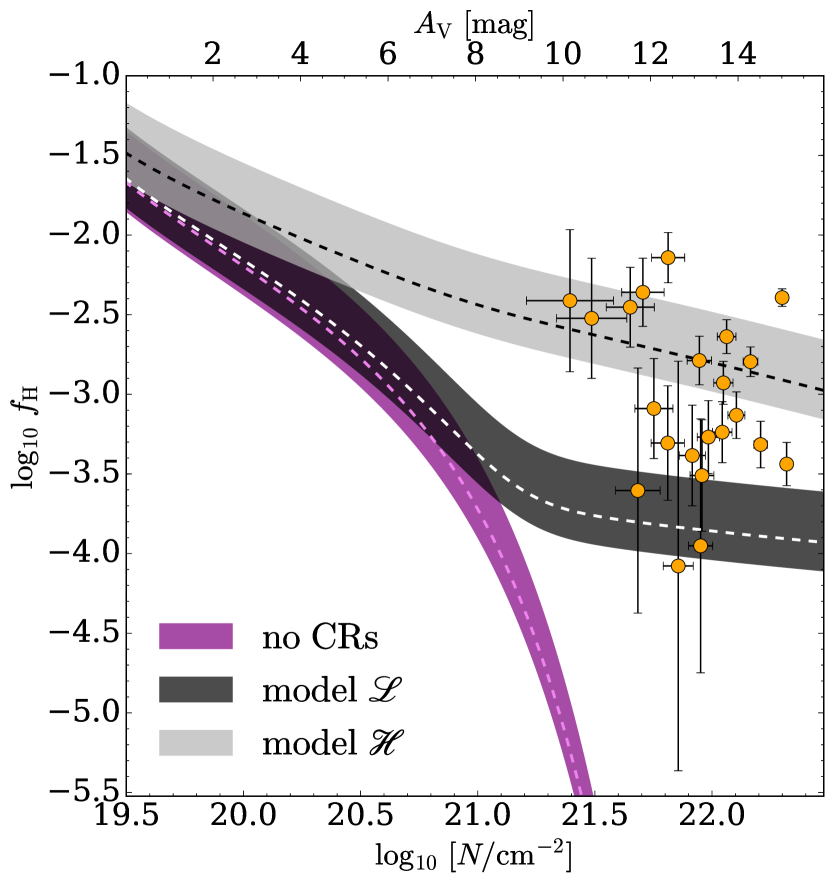
We compute the fraction of atomic and molecular hydrogen expected at different column densities (Eqs. 7 and 8), to evaluate the effect of CR dissociation on the abundance of atomic hydrogen in dark clouds. For the total volume density in Eq. (4), we use the average value of cm-3 computed by Li & Goldsmith (2003), to which we add an error of cm-3 (the standard deviation for the observed values).
Figure 5 shows the comparison between our models and the observations by Li & Goldsmith (2003). As expected, UV photodissociation alone cannot explain the observed ratios because of the attenuation at large column densities. More notably, a CR spectrum based on the extrapolation of the Voyager data (model ) fails to reproduce the majority of the observations, and only a spectrum enhanced at low energies (such as model ) can explain this. The latter fact corroborates the need of a low-energy tail in the IS CR flux of protons, also required to explain the high CR ionisation rates in diffuse clouds (e.g. Padovani et al. 2009; Indriolo et al. 2015).
4.1 Uncertainties of the formation rate
The large spread in the observed values of probably reflects a broad variety of environments in dark clouds, including, e.g., variations in the density and IS UV radiation field (see e.g. Bialy & Sternberg 2016). In this work we assume a formation rate of cm3 s-1 (see Sect. 3)333We note that Li & Goldsmith (2003) used cm3 s-1, which is a factor of 5 smaller than our value. A lower implies a lower ionisation rate needed to reproduce the observations. This explains why, using a constant dissociation rate equal to the ionisation rate of s-1, they found .. However, is strongly dependent on the condition of each cloud; for example, in photodissociation regions, where the large abundance of polycyclic aromatic hydrocarbons favours the formation of , can increase by one order of magnitude (Habart et al. 2004). Variations in the grain size distribution may also change the value of by a factor of (Goldsmith & Li 2005). Draine (2011) suggests cm3 s-1, but even assuming as low as 10 K, we find at cm-2 for a Voyager-like spectrum (model ). As a consequence, a larger flux of low-energy CR protons (model ) is still needed to explain the higher ratios. This conclusion remains unchanged even if is increased by up to two orders of magnitude, since the UV field is exponentially attenuated in the range of column densities of the observed dark clouds ().
One should also keep in mind that, as mentioned in Sect. 3, some of the observed clouds may have not necessarily reached a steady-state ratio (Goldsmith & Li 2005; Goldsmith et al. 2007). In this case, model could not be completely ruled out as, if these clouds are younger, they will have higher ratio than predicted by our steady-state assumption.
5 Discussion and conclusions
Dissociation of H2 into atomic hydrogen by CRs in dark clouds can have important consequences for the chemical evolution of dense regions in the clouds. Atomic hydrogen is the most mobile reactive species on the surface of bare dust grains and icy mantles, and therefore it is crucial to accurately determine its abundance. The larger values predicted in this work imply a more efficient hydrogenation of molecular species on grain surfaces. In particular, hydrogenation of CO, which freezes out onto grains at densities above a few cm-3 (e.g., Caselli et al. 1999), follows the sequence (e.g. Tielens & Hagen 1982)
| (9) |
This leads to efficient production of formaldehyde (H2CO) and methanol (CH3OH; Vasyunin et al. 2017) on very short time scales. Hence, even if dissociation by energetic particles takes place, CO cannot be returned to the gas phase, because it is rapidly converted into methanol. If the products of dissociation do not move very far from their formation site (Shingledecker et al. 2018), methanol is ejected from the surface. This is because the exothermicity of chemical reactions (9) is partially channeled into kinetic energy through a process known as reactive desorption (Garrod et al. 2007). On the other hand, ammonia (NH3), which is synthesised onto grains through the hydrogenation sequence (e.g. Hiraoka et al. 1995; Fedoseev et al. 2015)
| (10) |
can, in principle, go back to the gas phase upon surface dissociation followed by reactive desorption. These considerations could help in explaining the observational evidence that NH3 (unlike CO) does not appear to deplete towards the central regions of dense cores, despite its large binding energy. To verify this hypothesis, one should carefully evaluate the consequences of an enhanced abundance of atomic hydrogen in chemical models.
We point out that CR dissociation is not only limited to , but could occur for other molecular species as well, both in the gas phase and on/in ices mantles, with potentially significant consequences in the chemical composition of dense cloud cores and dark clouds.
To summarise, in this paper we studied the role of CRs in determining the fractional abundance of atomic hydrogen in dark clouds. The main results are:
-
()
The CR dissociation rate, , is primarily determined by secondary electrons produced during the primary CR ionisation process. These secondary electrons can efficiently dissociate H2 and represent the only source of atomic hydrogen at column densities larger than cm-2, regulating the ratio in dark clouds;
-
()
entering the balance equation (4) is not equal to the ionisation rate , as assumed in some previous work. We find that the ratio varies between and , depending on the column density range, while is a decreasing function of the column density;
-
()
Even given the uncertainties in the values of formation rate, temperature, total hydrogen volume density, and IS UV radiation field for each cloud, only a CR proton spectrum enhanced at low energies (such as our model ) is capable to reproduce the upper values of measured , under the assumption of steady state. We note that neither model nor is able to reproduce the entire set of observational data: the spread in the values of at any given column density must be attributed to time dependence or to individual characteristics of each cloud. For example, tangled magnetic field lines and/or higher volume densities would result in a stronger CR attenuation and therefore in a lower ;
-
()
An accurate description of H2 dissociation in dense environments is essential, because many chemical processes (such as CO hydrogenation and its depletion degree onto dust grains, or formation of complex organic molecules) critically depend on the abundance of atomic hydrogen.
Acknowledgements.
The authors wish to thank the referee, Paul Goldsmith, for his careful reading of the manuscript and insightful comments that considerably helped to improve the paper. MP acknowledges funding from the European Union’s Horizon 2020 research and innovation programme under the Marie Skłodowska-Curie grant agreement No 664931. AF acknowledges support from the ERC Advanced Grant INTERSTELLAR H2020/740120. The authors thank Fabrizio Esposito for sending us his results for the dissociation cross section by atomic hydrogen impact.Appendix A Equilibrium distribution of protons and atoms at low energies
Because of the process of electron capture at low energies, CR protons interacting with are efficiently neutralised,
| (11) |
creating fast H atoms444In parentheses, we put the cross section of the respective process.. At the same time, Hfast atoms reacting with H2 yield
| (14) | |||||
The electron capture by protons, Eq. (11), and the reaction of self-ionisation, Eq. (14), are catastrophic processes, since the respective projectile particles disappear after such collisions. The reactions of ionisation and dissociation by atoms, Eqs. (14) and (14), respectively, are continuous loss processes, where the projectile kinetic energy decreases only slightly after each collision. The efficiency of continuous energy losses is generally characterised by the projectile’s stopping range (see, e.g. Padovani et al. 2009).
For our calculations, is taken from Rudd et al. (1983), is from Phelps (1990) and Kunc & Soon (1991), is computed by Stier & Barnett (1956), van Zyl et al. (1981), and Phelps (1990), and is from Dove & Mandy (1986) and Esposito & Capitelli (2009). In Fig. 6 we plot the cross sections and the inverse of the proton stopping range, , versus the respective projectile’s energy. We see that is much larger than for , which implies that continuous loss processes cannot significantly affect the balance between protons and atoms at these energies. The equilibrium ratio of the and proton fluxes is then given by
| (15) |
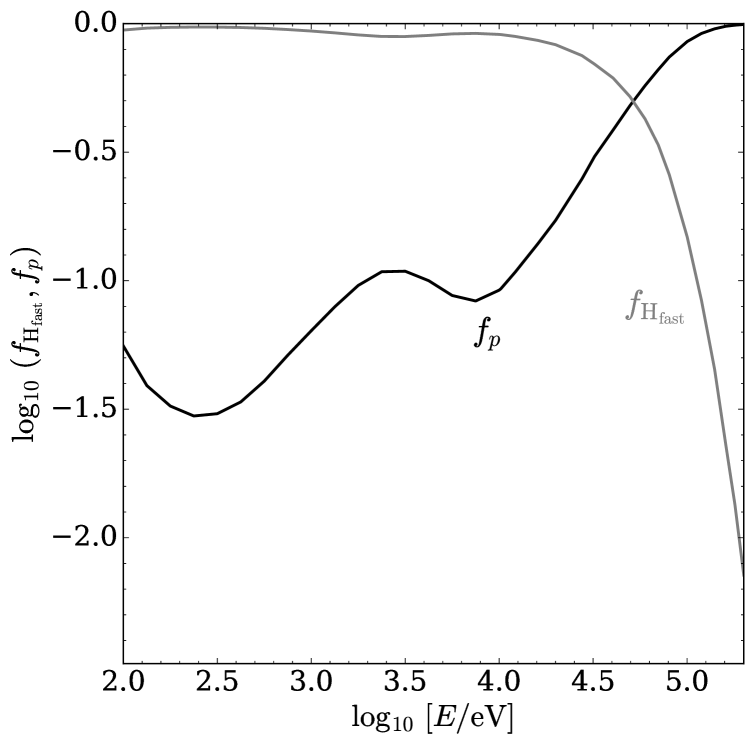
This allows us to calculate the fractions of Hfast atoms,
| (16) |
and protons, . Figure 7 shows that for energies below eV, only less than 10% of non-molecular hydrogen is in the form of protons. This means that ionisation at these energies is dominated by Hfast atoms, via reaction (14).
Appendix B Ionisation by atoms
As shown in Appendix A, the ionisation at energies below eV is mostly driven by atoms. To take this effect into account, we use the following expression for the ionisation rate by CR protons:
where is the ionisation cross section by proton impact (Rudd et al. 1985). It turns out, however, that the difference between the ionisation rates computed from Eq. (B) taking into account Eq. (15) and assuming is very small: for cm-2, the difference is and for models and , respectively, at higher column densities it rapidly decreases and becomes negligible for both models above cm-2. This result justifies the assumption made previously for calculating the ionisation.
References
- Bialy & Sternberg (2016) Bialy, S. & Sternberg, A. 2016, ApJ, 822, 83
- Caselli et al. (1999) Caselli, P., Walmsley, C. M., Tafalla, M., Dore, L., & Myers, P. C. 1999, ApJ, 523, L165
- Chabot (2016) Chabot, M. 2016, A&A, 585, A15
- Cummings et al. (2016) Cummings, A. C., Stone, E. C., Heikkila, B. C., et al. 2016, ApJ, 831, 18
- Dove & Mandy (1986) Dove, J. E. & Mandy, M. E. 1986, ApJ, 311, L93
- Draine (2011) Draine, B. T. 2011, Physics of the Interstellar and Intergalactic Medium
- Esposito & Capitelli (2009) Esposito, F. & Capitelli, M. 2009, Journal of Physical Chemistry A, 113, 15307
- Fedoseev et al. (2015) Fedoseev, G., Ioppolo, S., Zhao, D., Lamberts, T., & Linnartz, H. 2015, MNRAS, 446, 439
- Garrod et al. (2007) Garrod, R. T., Wakelam, V., & Herbst, E. 2007, A&A, 467, 1103
- Goldsmith & Li (2005) Goldsmith, P. F. & Li, D. 2005, ApJ, 622, 938
- Goldsmith et al. (2007) Goldsmith, P. F., Li, D., & Krčo, M. 2007, ApJ, 654, 273
- Habart et al. (2004) Habart, E., Boulanger, F., Verstraete, L., Walmsley, C. M., & Pineau des Forêts, G. 2004, A&A, 414, 531
- Habing (1968) Habing, H. J. 1968, Bull. Astron. Inst. Netherlands, 20, 120
- Hiraoka et al. (1995) Hiraoka, K., Yamashita, A., Yachi, Y., et al. 1995, ApJ, 443, 363
- Hollenbach et al. (1971) Hollenbach, D. J., Werner, M. W., & Salpeter, E. E. 1971, ApJ, 163, 165
- Houde et al. (2009) Houde, M., Vaillancourt, J. E., Hildebrand, R. H., Chitsazzadeh, S., & Kirby, L. 2009, ApJ, 706, 1504
- Indriolo et al. (2015) Indriolo, N., Neufeld, D. A., Gerin, M., et al. 2015, ApJ, 800, 40
- Ivlev et al. (2015) Ivlev, A. V., Padovani, M., Galli, D., & Caselli, P. 2015, ApJ, 812, 135
- Janev et al. (2003) Janev, R. K., Reiter, D., & Samm, U. 2003, Collision processes in low-temperature hydrogen plasmas, 188
- Jura (1975) Jura, M. 1975, ApJ, 197, 575
- Kunc & Soon (1991) Kunc, J. A. & Soon, W. H. 1991, J. Chem. Phys., 95, 5738
- Li & Goldsmith (2003) Li, D. & Goldsmith, P. F. 2003, ApJ, 585, 823
- McCutcheon et al. (1978) McCutcheon, W. H., Shuter, W. L. H., & Booth, R. S. 1978, MNRAS, 185, 755
- Montgomery et al. (1995) Montgomery, A. S., Bates, B., & Davies, R. D. 1995, MNRAS, 273, 449
- Neufeld & Wolfire (2017) Neufeld, D. A. & Wolfire, M. G. 2017, ApJ, 845, 163
- Padovani & Galli (2011) Padovani, M. & Galli, D. 2011, A&A, 530, A109
- Padovani & Galli (2013) Padovani, M. & Galli, D. 2013, in Astrophysics and Space Science Proceedings, Vol. 34, Cosmic Rays in Star-Forming Environments, ed. D. F. Torres & O. Reimer, 61
- Padovani et al. (2009) Padovani, M., Galli, D., & Glassgold, A. E. 2009, A&A, 501, 619
- Padovani et al. (2013) Padovani, M., Hennebelle, P., & Galli, D. 2013, A&A, 560, A114
- Padovani et al. (2018) Padovani, M., Ivlev, A. V., Galli, D., & Caselli, P. 2018, ArXiv e-prints [arXiv:1803.09348]
- Phan et al. (2018) Phan, V. H. M., Morlino, G., & Gabici, S. 2018, ArXiv e-prints [arXiv:1804.10106]
- Phelps (1990) Phelps, A. V. 1990, Journal of Physical and Chemical Reference Data, 19, 653
- Rudd et al. (1983) Rudd, M. E., Goffe, T. V., Dubois, R. D., Toburen, L. H., & Ratcliffe, C. A. 1983, Phys. Rev. A, 28, 3244
- Rudd et al. (1985) Rudd, M. E., Kim, Y.-K., Madison, D. H., & Gallagher, J. W. 1985, Reviews of Modern Physics, 57, 965
- Shingledecker et al. (2018) Shingledecker, C. N., Tennis, J., Le Gal, R., & Herbst, E. 2018, ApJ, 861, 20
- Stier & Barnett (1956) Stier, P. M. & Barnett, C. F. 1956, Physical Review, 103, 896
- Tielens (2010) Tielens, A. G. G. M. 2010, The Physics and Chemistry of the Interstellar Medium
- Tielens & Hagen (1982) Tielens, A. G. G. M. & Hagen, W. 1982, A&A, 114, 245
- van der Werf et al. (1988) van der Werf, P. P., Goss, W. M., & Vanden Bout, P. A. 1988, A&A, 201, 311
- van Zyl et al. (1981) van Zyl, B., Le, T. Q., & Amme, R. C. 1981, J. Chem. Phys., 74, 314
- Vasyunin et al. (2017) Vasyunin, A. I., Caselli, P., Dulieu, F., & Jiménez-Serra, I. 2017, ApJ, 842, 33