The MURALES survey. I.
We observed the FR II radio galaxy 3C 459 (z=0.22) with the MUSE spectrograph at the Very Large Telescope (VLT) as part of the MURALES project (a MUse RAdio Loud Emission line Snapshot survey). We detected diffuse nuclear emission and a filamentary ionized gas structure forming a one-sided, triangular-shaped region extending out to 80 kpc. The central emission line region is dominated by two compact knots of similar flux: the first (N1) cospatial with the radio core and the (N2) second located 12 (5.3 kpc) to the SE. The two regions differ dramatically from the point of view of velocity (with an offset of 400 km/s), line widths, and line ratios. This suggests that we are observing a dual AGN system formed by a radio loud AGN and type 2 QSO companion, which is the result of the recent merger that also produced its disturbed host morphology. The alternative possibility that N2 is just a bright emission line knot resulting from, for example, a jet-cloud interaction, is disfavored because of 1) the presence of a high ionization bicone whose apex is located at N2; 2) the observed narrow line widths; 3) its line luminosity (erg s-1) typical of luminous QSOs; and 4) its location, which is offset from the jet path. The putative secondary AGN must be highly obscured, since we do not detect any emission in the Chandra and infrared Hubble Space Telescope images.
Key Words.:
galaxies: active – galaxies: nuclei – galaxies: individual (3C459) – galaxies: star formation – galaxies: jets and outflows1 Introduction
Mergers play a fundamental role in the hierarchical models of galaxy formation and evolutions. Among other effects, mergers with a gas-rich galaxy funnel gas toward the central galactic regions (Mihos & Hernquist 1996), potentially enhancing star formation and triggering the Active Galactic Nuclei (AGN) activity (e.g., Treister et al. 2012; Hopkins et al. 2014).
Since most, if not all, galaxies contain a super massive black hole (SMBH) in their center, a merging of two galaxies might lead to the formation of a black hole binary. If both galaxies are accreting they could shine as a AGN pair that evolves on a 100 Myr timescale (Begelman et al. 1980) into a dual AGN before the final coalescence. In this intermediate evolutionary stage dual AGNs are separated by less than 10 kpc and, according to models, the AGN activity and star formation are the most vigorous (e.g., Van Wassenhove et al. 2012; Blecha et al. 2013). They can therefore be identified with X-ray (e.g., Koss et al. 2012) or optical spectroscopic observations (e.g., Müller-Sánchez et al. 2015; Smith et al. 2010; Wang et al. 2009). Hundreds of AGN pairs with 10 kpc separations have been discovered so far (Myers et al. 2008; Hennawi et al. 2010). However, due to various observational difficulties, there are only a few confirmed kiloparsec-scale dual AGNs. Therefore, despite the effort in recent decades, binary AGN turned out to be rather elusive objects (e.g., Koss et al. 2012; Rosario et al. 2011; Fu et al. 2011). This is likely, in part, because AGN in galaxy mergers are likely more obscured than those in isolated galaxies (Kocevski et al. 2015; Koss et al. 2016; Ricci et al. 2017; Satyapal et al. 2017). In the mid-infrared dust extinction is attenuated and the selection of candidates using mid-IR colors from the Wide Field Infrared Survey Explorer (WISE) improves the success rate for dual AGN confirmation (Satyapal et al. 2017; Ellison et al. 2017). In the radio band, it is possible to resolve binary AGN at an angular distance 0.1-1 milli-arcseconds. All the binary black holes separated by less than 10 parsec have been confirmed with this method, (e.g., Rodriguez et al. 2006; Gabányi et al. 2016; Kharb et al. 2017). Long-term monitoring programs of AGN with the VLBI, such as the MOJAVE project (Monitoring Of Jets in Active galactic nuclei with VLBA Experiments), are investigating the kinematics of the radio jets on parsec scale. Many AGN jets undergo significant changes in the jet projected direction (Lister et al. 2013) and in some cases they show evidence of long-term precession (Alexander 1985; Steenbrugge & Blundell 2008) possibly caused by a companion. However, a nondetection in the radio band does not exclude the presence of dual AGN, since only 10% of the nuclei are radio loud.
Radio galaxies are among the best sources for a search of a dual/binary AGN. In fact, a major merger between two galaxies of similar mass ( M⊙; e.g., Best et al. 2005) hosting high-mass SMBHs might result in a highly spinning black hole from which the energy to launch two relativistic radio jets can be extracted (Blandford & Znajek 1977; Chiaberge & Marconi 2011). At high redshift (z1) almost all radio galaxies are associated with recent or ongoing merger events (Chiaberge et al. 2015). The properties of one such object, 3C 186, are consistent with those expected if this is associated with a recoiling BH, resulting from the coalescence of black holes in the late phases of a merger (Chiaberge et al. 2017). Furthermore, there is some evidence that mergers also play a major role in radio loud objects at lower redshift (e.g., Capetti & Balmaverde 2006; Baldi & Capetti 2008; Ramos Almeida et al. 2011, 2012). Aside from the cases of 3C 75 and Abell 439, in which two pairs of elliptical galaxies separated by 10-20 kpc are both associated with an extended radio source (Owen et al. 1985; O’Dea & Owen 1985), there have been various claims of binary BHs in 3C sources. All of these assertions are based on the modeling of the parsec scale radio structure in these sources in which, however, only one black hole is active (De Paolis et al. 2004; Lobanov & Roland 2005; Roland et al. 2013; Romero et al. 2000). Two cases deserve particular mention: 0402+379, the first binary black hole resolved as a visual binary system at 7.3 pc (Bansal et al. 2017) and NGC7675, which is to date the tightest AGN couple ever imaged at a projected distance of 0.35 parsec (Kharb et al. 2017). Finally, no dual AGN are found in the Chandra observations of the low 3C sample (Massaro et al. 2010, 2012, 2015), but most of these observations were taken with a short exposure time (8 ks).
We observed a sample of 20 radio galaxies with MUSE as part of the MURALES survey (a MUse RAdio Loud Emission line Snapshot survey). The sample is formed by the 3C radio sources limited to and , visible during the April-September semester, i.e., R.A. 3h and R.A. 15h. The main aim of this survey is obtain deep line emission images and explore the gas kinematics and its relationship with the relativistic outflows. However, the sensitivity of MUSE combined with its the high spatial and spectral resolution makes this instrument a powerful tool to discover AGN pairs, as recently shown by Husemann et al. (2018).
In this first paper we report the serendipitous discovery of a candidate dual AGN in 3C 459, a radio galaxy at (where corresponds to 4.4 kpc). In radio, it is a luminous ( W Hz-1 sr-1; Ulvestad 1985) double-lobed source that is 37 kpc in size, is very asymmetric with its eastern radio lobe brighter and closer to the nucleus, and has an arm ratio of 5:1 (Thomasson et al. 2003). Both the lobes are edge-brightened. The radio galaxy has also been detected in HI absorption with the Westerbork Radio Telescope (WSRT) (Morganti et al. 2005). In optical, there is some controversy about the classification of 3C 459. While the spectrum of Tadhunter et al. (2002) does not show clear evidence for broad permitted lines, a broad H component is instead detected by Buttiglione et al. (2009). In X-ray, the hydrogen column density (N cm-2; Massaro et al. 2012) supports the identification of 3C 459 as a narrow-line galaxy. On the other hand, its radio core is relatively bright ( at 5 GHz), corresponding to a core dominance log typical of broad-lined radio galaxies (Baldi et al. 2013).
The host of 3C 459 shows several signatures of a recent, gas-rich merger. A large contribution of young stars emerges from the analysis of the optical spectrum (Wills et al. 2008; Tadhunter et al. 2011), in line with the high star formation rate (; Westhues et al. 2016) derived from modeling its broadband spectral energy distribution. In deep, optical broadband images, the stellar component appears as highly disturbed and have fans of diffuse emission that extend more than 30 kpc east and south of the nucleus (Ramos Almeida et al. 2011). In Sect. 2 we present the MUSE observations of 3C 459 and in Sect. 3 we present the main results, which are then discussed in Sect. 4.
2 Observation and data reduction
Two observations, with an exposure time of ten minutes each, were obtained with the VLT/MUSE spectrograph on July 22, 2017 with a seeing of 05. We used the ESO MUSE pipeline (version 1.6.2) to obtain a fully reduced and calibrated data cube.
We followed the same strategy for the data analysis described in Balmaverde et al. (2018). Summarizing, we subtracted the stellar continuum after resampling the data cube with the Voronoi adaptive spatial binning, requiring an average signal-to-noise ratio per wavelength channel of at least 50. We then used the penalized pixel-fitting code (pPXF; Cappellari & Copin 2003) to fit the absorption stellar features.
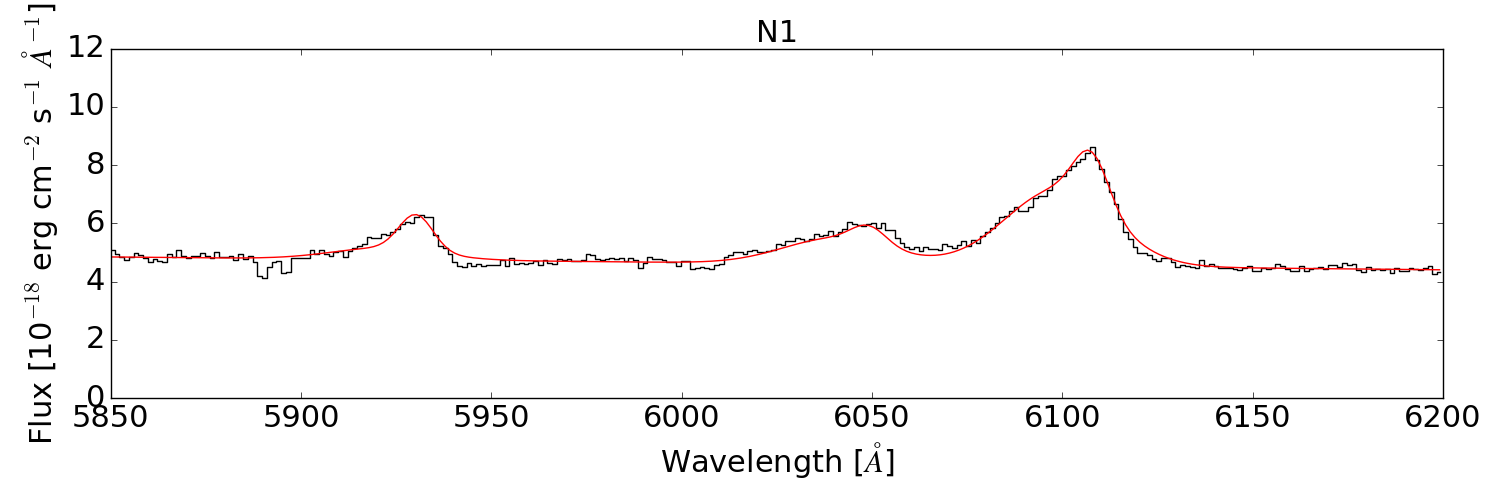
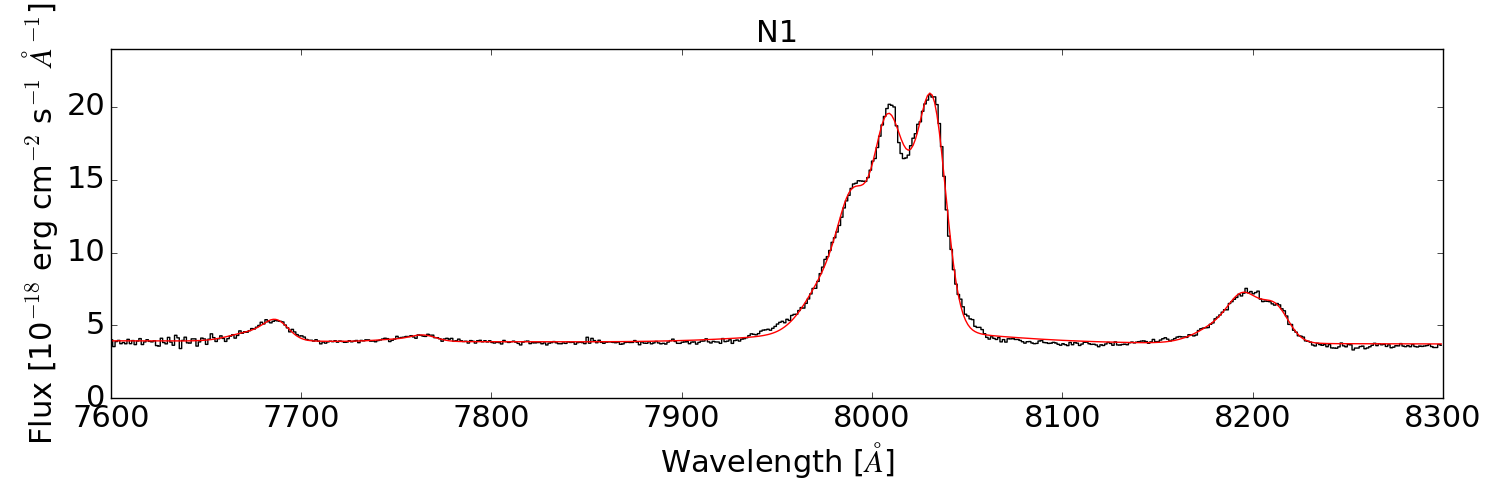
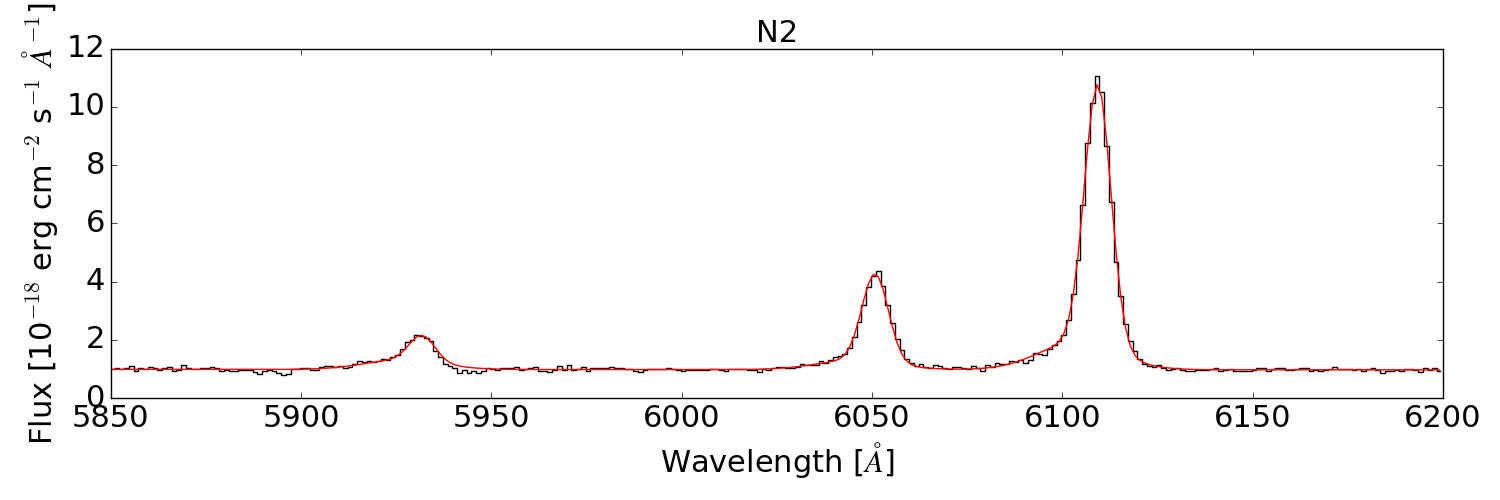
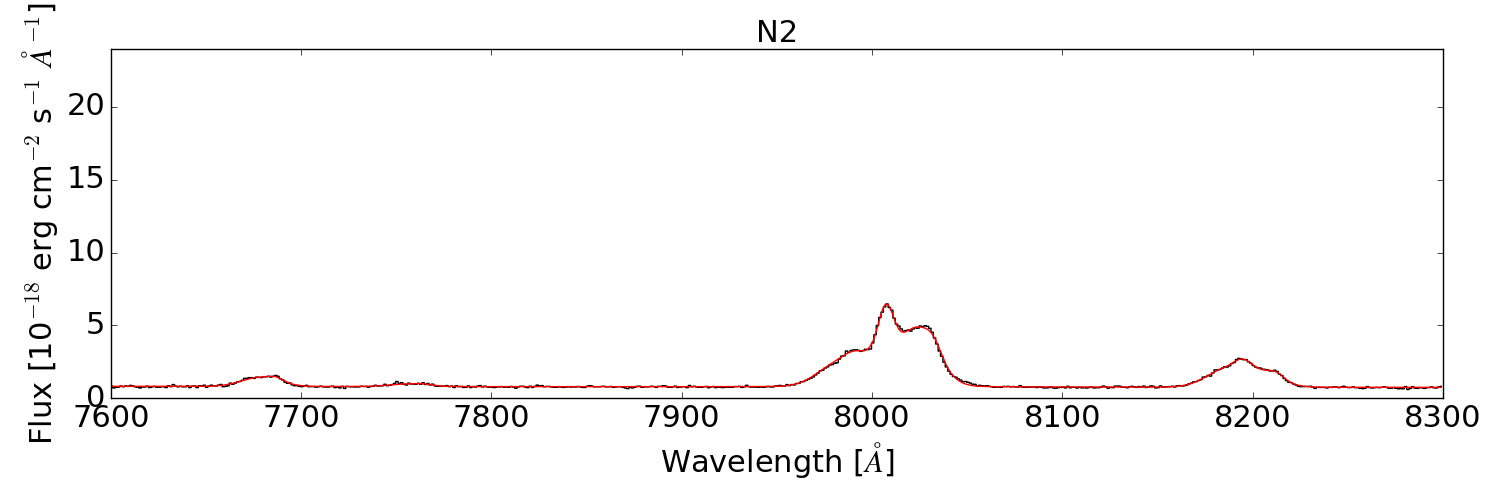
We simultaneously fit all emission lines in the continuum subtracted spectra. We assumed that all lines in the blue and red portion of the spectra have the same profile, except for the H in the nuclear regions for which we allowed for the presence of a broad component not required to fit the H line. In the nuclear regions we included multiple Gaussian components, while one component accurately reproduces the lines at larger radii.
| Line | Flux N1 | Flux N2 |
|---|---|---|
| [O III]5007 | 28.1 | 25.6 |
| H | 6.8 | 3.9 |
| [OI]6300 | 2.6 | 1.3 |
| H | 60.1 | 20.2 |
| [NII]6584 | 113.7 | 26.9 |
| [SII]6731 | 20.3 | 7.0 |
| [SII]6717 | 12.9 | 8.7 |
3 Results
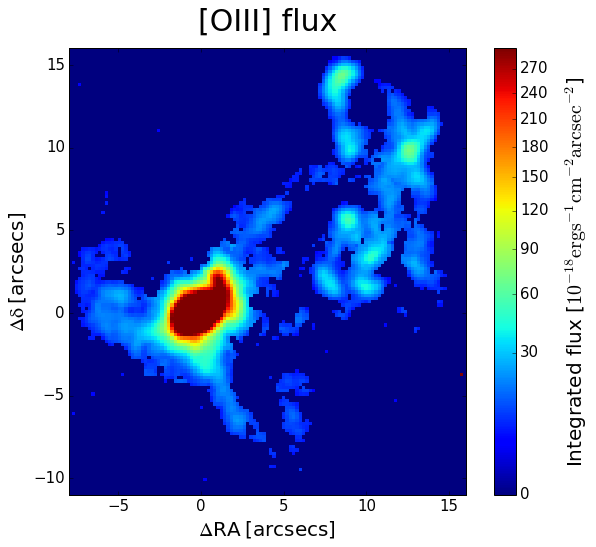
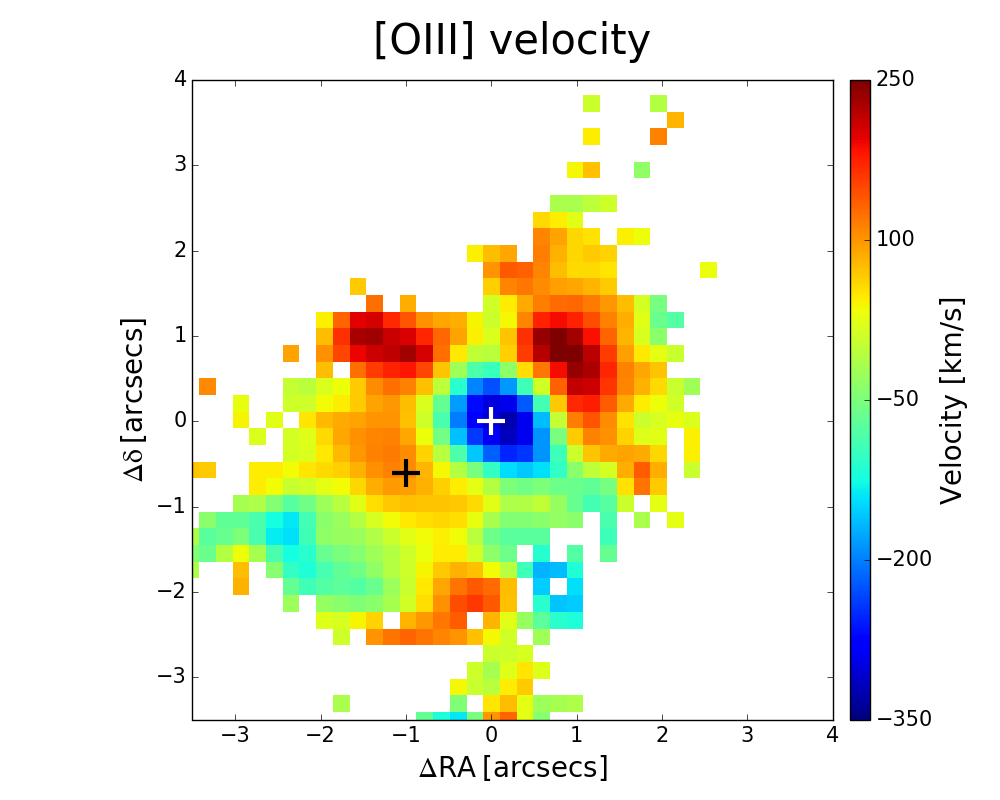
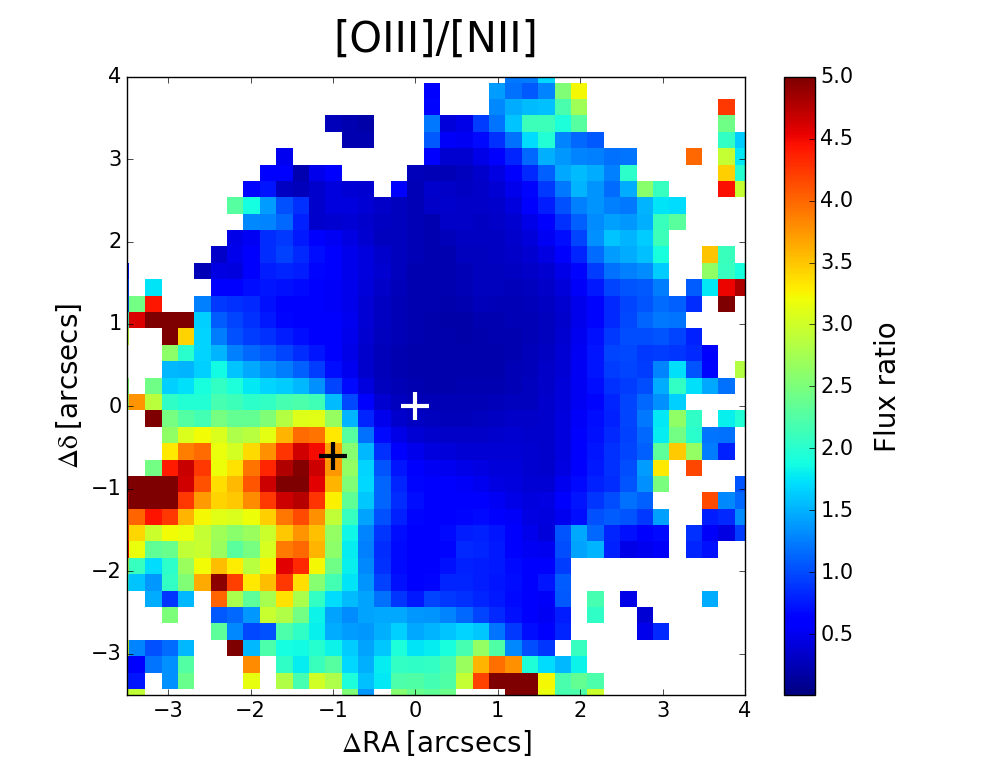
Line emission in 3C 459 is detected out to a distance of 18″ (80 kpc) from the nucleus (see Fig. 1). On the NW side it is dominated by several emitting filaments, confined within a triangular region with its apex toward the center of the galaxy.
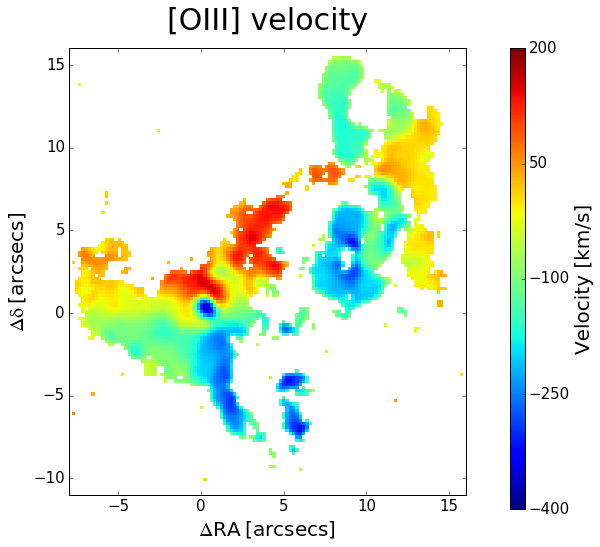
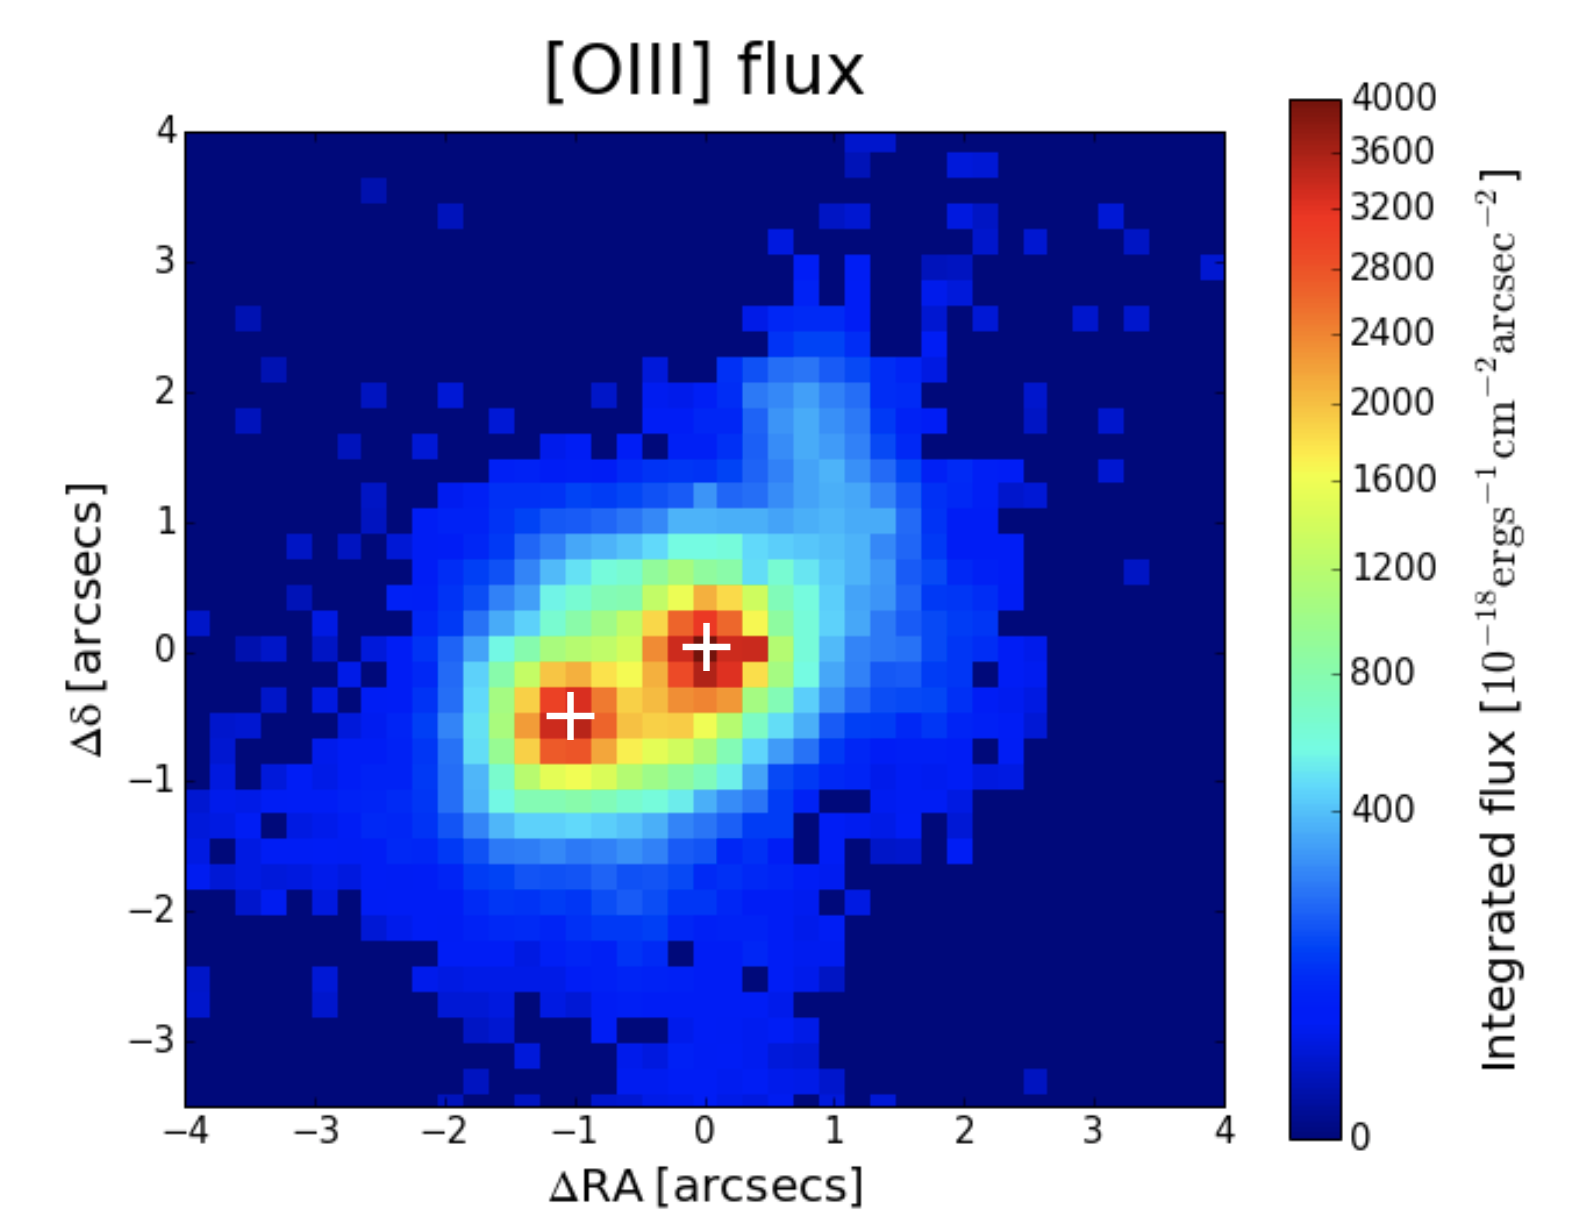
The central regions are dominated by two compact line emission peaks of similar brightness: one (hereafter, we refer to it as ) is located at the position of the continuum peak and coincident also with the radio core and the other () is offset by (5.3 kpc) to the SE. The gas velocity field (Fig. 1, central panels) is very complex; relative velocities range from -350 to 250 . Nonetheless, following in turn each of the various NW filaments, we find rather smooth velocity gradients, indicative of ordered motions. At the nucleus we also find a complex velocity structure. In particular, there is a difference of 400 between the baricenter of the line between and . The offset measured at the lines peak is instead km/s.
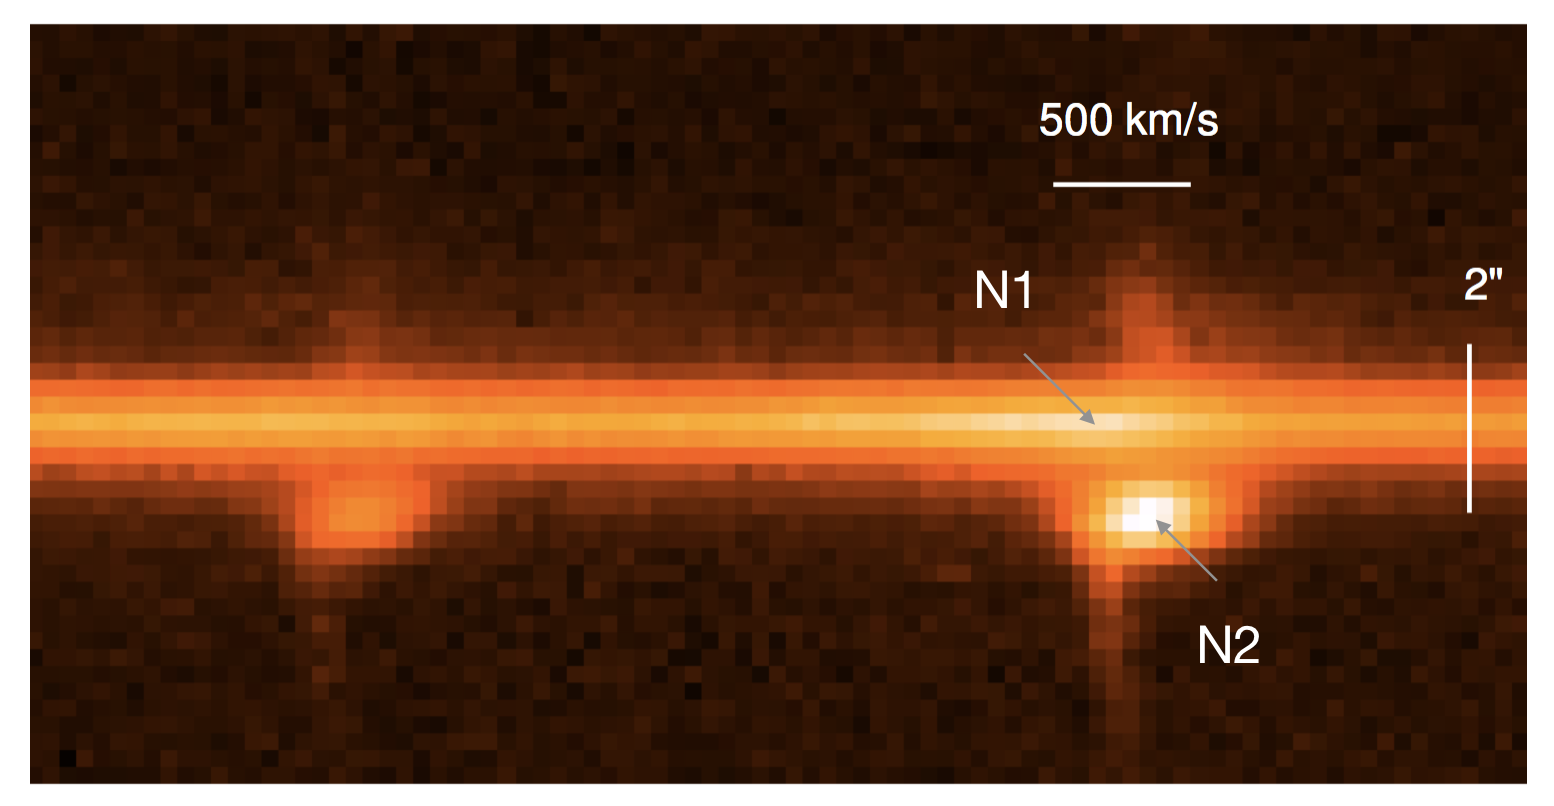
We extracted a position-velocity diagram for the line doublet along the direction of the two nuclei (see Fig. 2) with a synthetic aperture of 0.2. At large radii, we see gas extending over 6 (25 kpc) following a rotational pattern. The two nuclei are both offset with respect to the center of rotation.
The and regions also show dramatic differences in their spectra. In Fig. 4 and Table 1, we provide fluxes of the brightest emission lines extracted from a squared synthetic aperture of side 06. The lines are broader on , which has line widths of 500 , compared to 300 measured on . In the spectroscopic diagnostic diagrams both regions fall into the area populated by high excitation objects such as Seyferts, QSOs, and high excitation radio galaxies. (Kewley et al. 2006; Buttiglione et al. 2010), but the ratios of these objects are significantly different. In particular, the is relatively stronger on than on : the / ratio is 0.25 on and 0.58 on , indicating a higher gas ionization state.
These results suggest that is associated with a second active nucleus. The ratio H/H=5.10.1 (narrow components only) is indicative of substantial internal reddening, amounting to E(B-V)=0.47 having adopted the Cardelli et al. (1989) extinction law. The absorption corrected luminosity of is because the error is dominated by the uncertainty on the Balmer lines ratio. This luminosity value locates well within the range of luminous QSOs (Zakamska et al. 2003; Reyes et al. 2008).
Since no compact source is detected in the radio maps at the location of (a rough upper limit of 2 mJy can be derived from the inspection of Fig. 3 of Thomasson et al. 2003), we can identify this emitting region as a radio quiet type 2 QSO based on the emission line ratios, the lack of broad emission lines, and the luminosity.
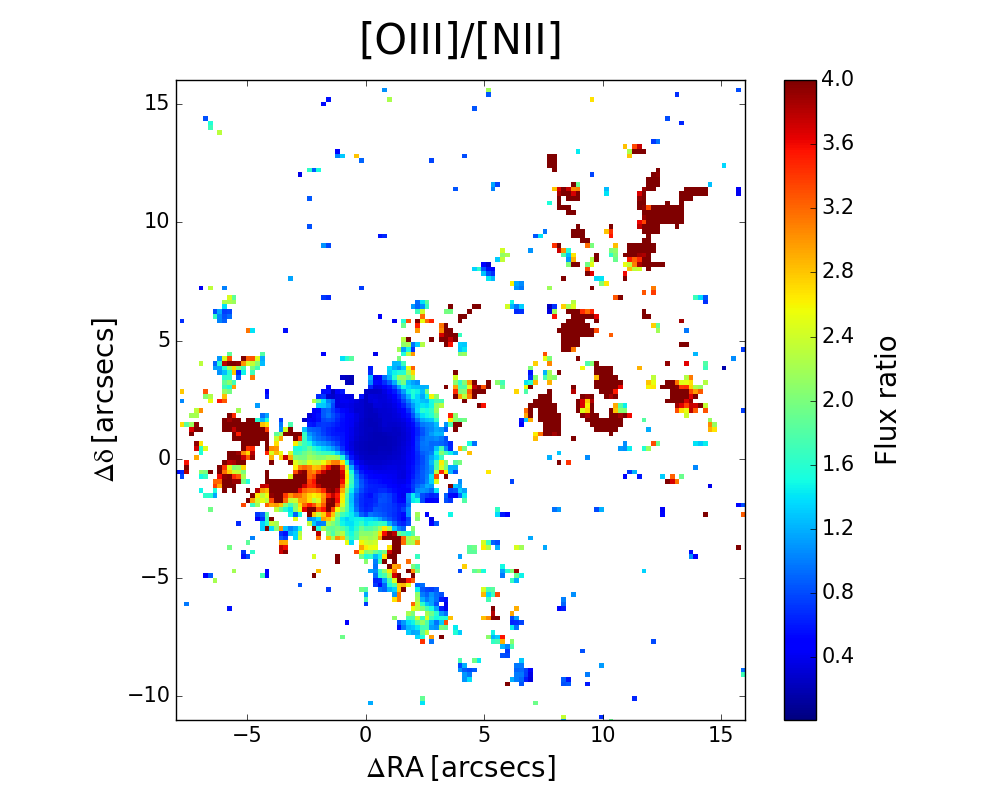
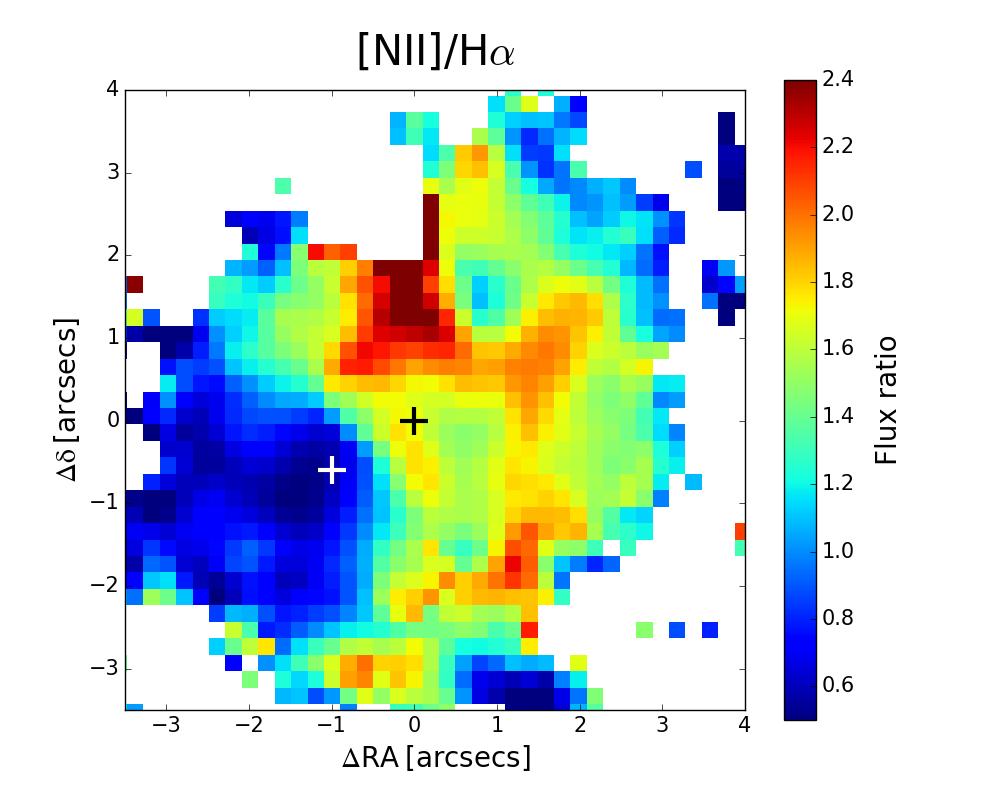
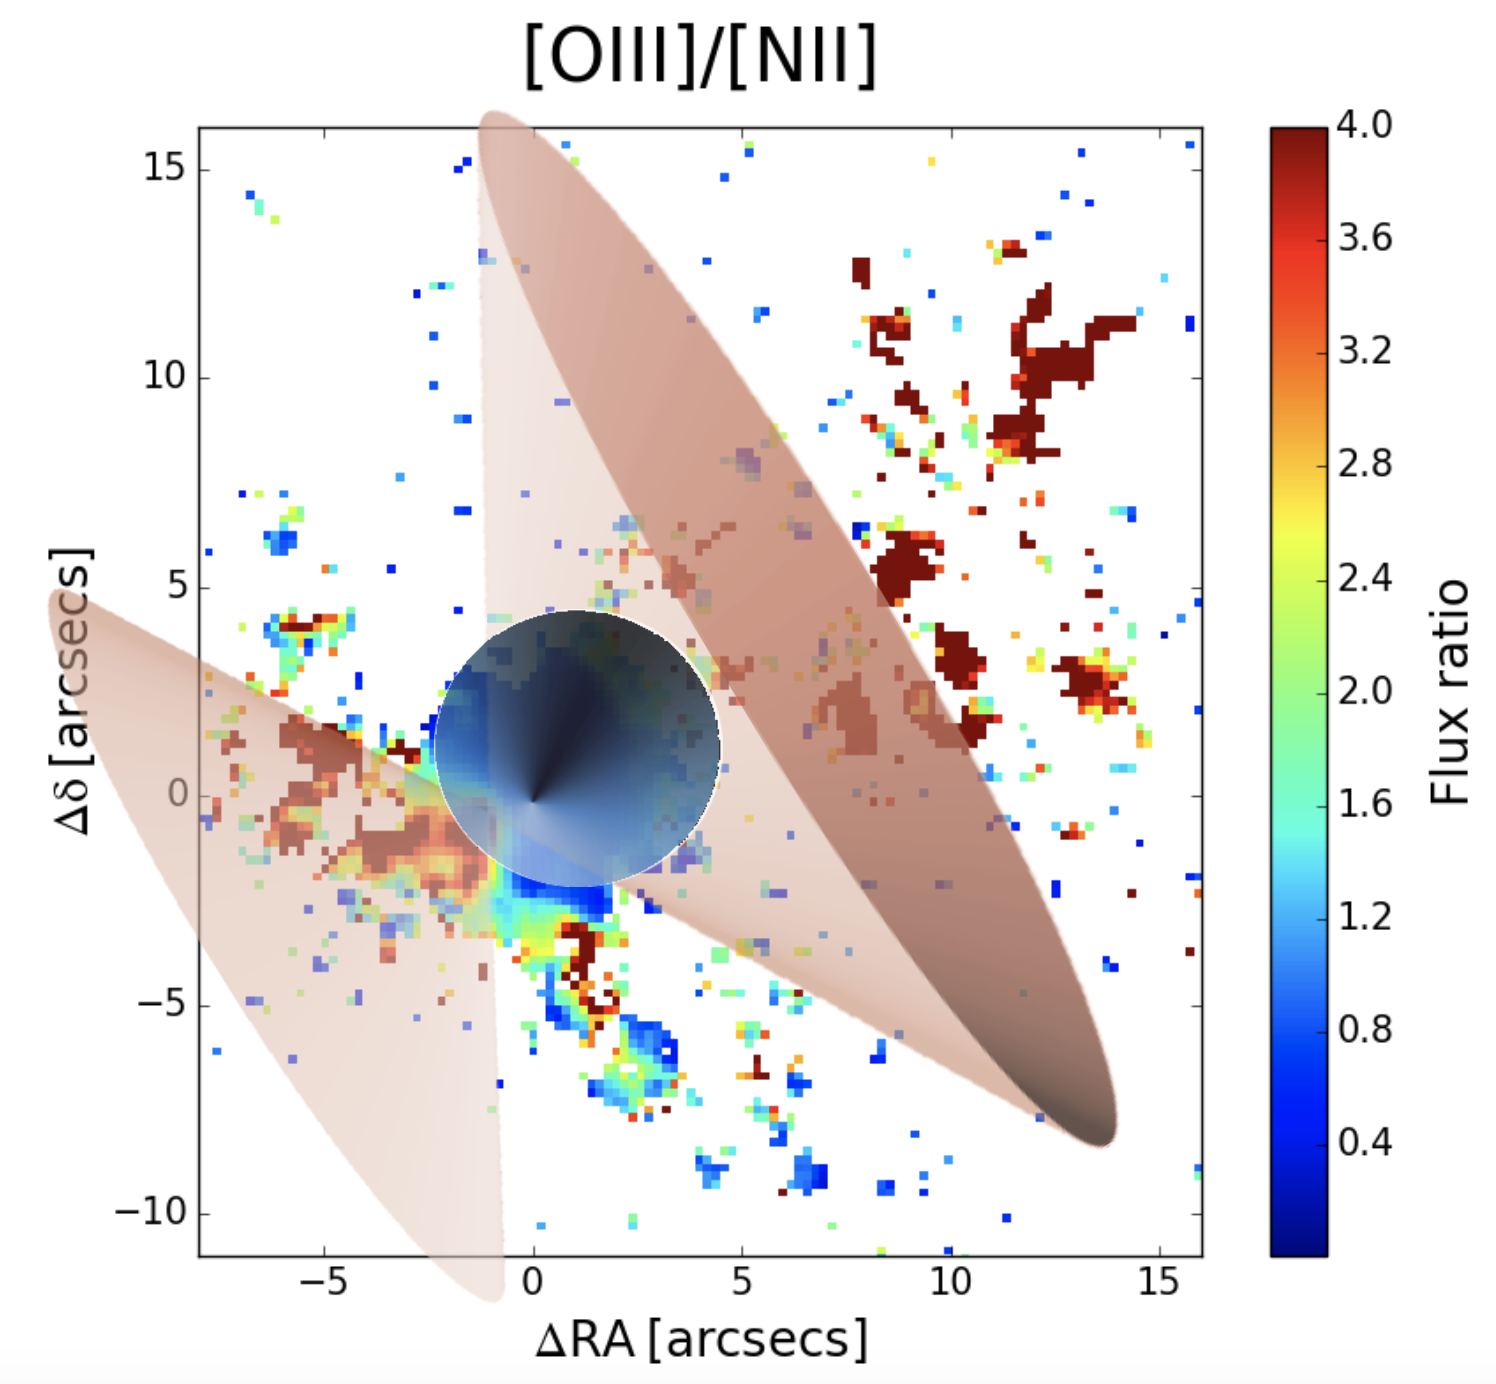
In Fig. 1, right panels, we also present an image obtained by dividing the and images, a ratio image sensitive to the ionization state of the emitting gas. In the central few arcseconds from the radio nucleus the ratio is , represented by the blue patch in this figure. On the SE side, however, this ratio map reveals the presence of a triangular region of highly ionized gas with the apex located at . By extending the boundaries of this region to the opposite side of the nucleus, they include the large scale system of filaments seen to the NW. These filaments are also characterized by a high / ratio, similar to what is seen on . The large spectral separation between the and lines opens the possibility that their ratio is due to changes in reddening across the source. The H image is not of sufficient quality to test directly this issue, but the /H ratio map (not sensitive to absorption) shows the same triangular structure seen in the / map (see Fig. 4).
This result strengthens the interpretation that is indeed a type 2 nucleus. In these sources, the AGN radiation field is highly asymmetric due to nuclear obscuration and, as a result, their narrow line region (NLR) often show a biconical morphology (see, e.g., Tadhunter & Tsvetanov 1989; Wilson et al. 1993; Williams et al. 2017). In the case of 3C 459 the bicone partly overlaps with the NLR of the radio loud AGN. The cartoon of Fig. 5 provides a schematic view of the geometry of the system.
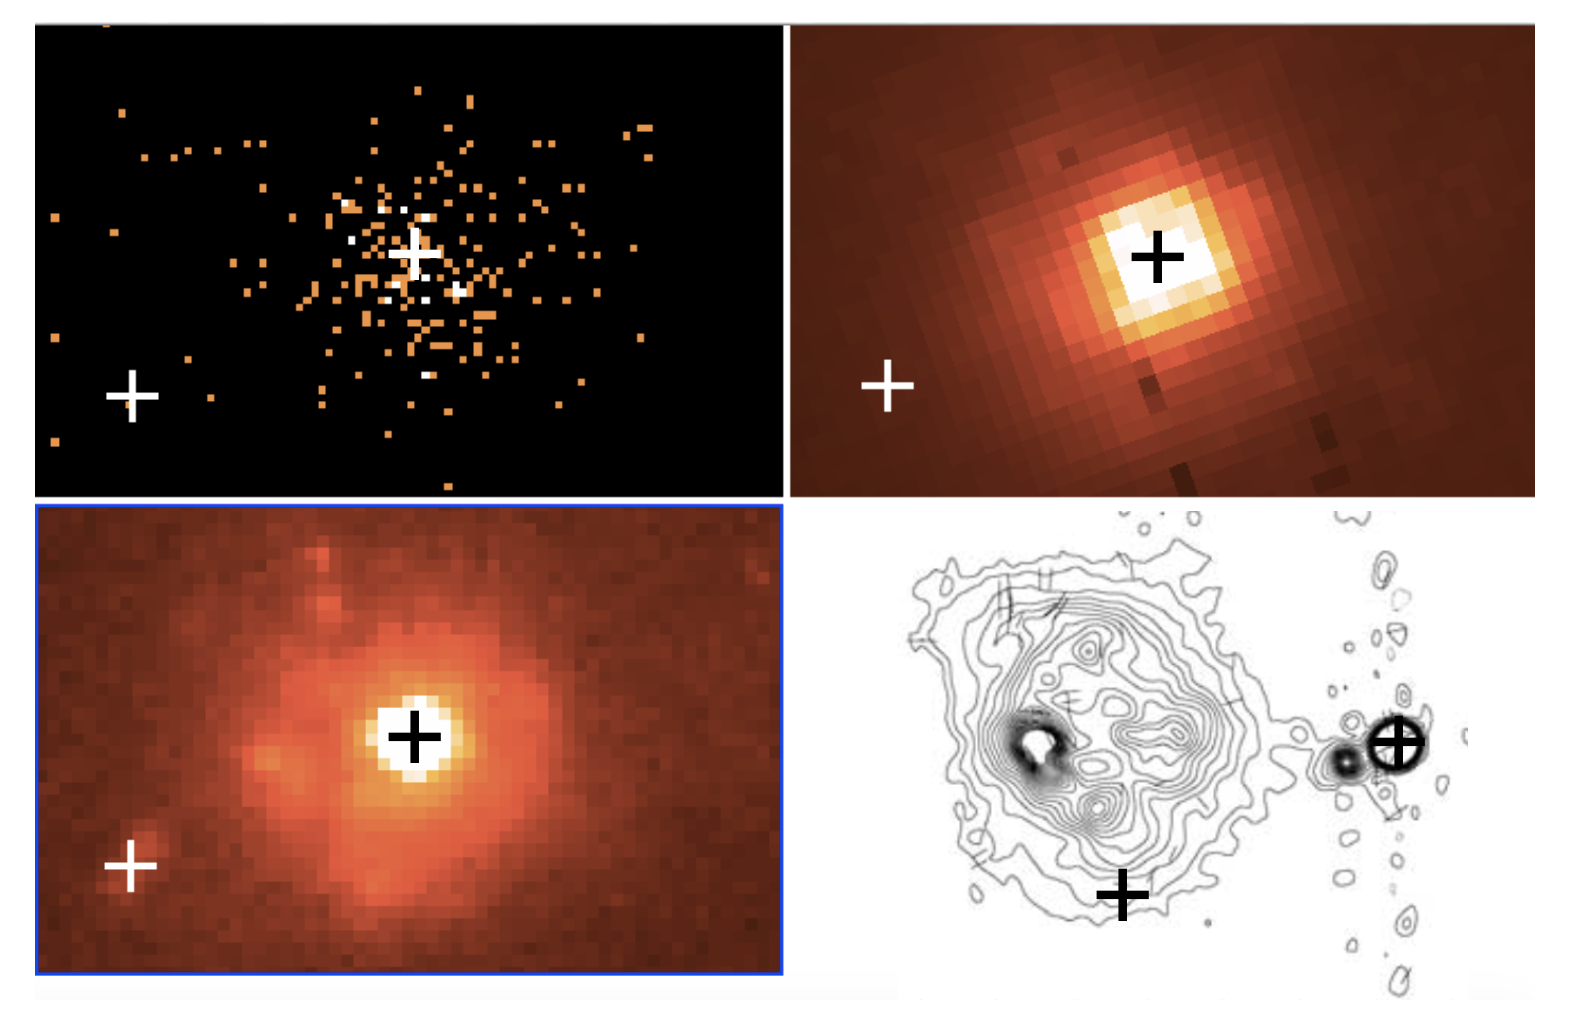
We looked for a signature of the presence of this secondary nucleus in other bands. In Fig. 6 we collected the images from Chandra in X-rays, MERLIN in radio waves, and HST in both the optical and near-IR bands. No emission is associated with in any of these images. The only exception is the F606W HST image, a broadband filter that includes the line, where at the location of there is an elongated feature, possibly due to line emission.
Based on the available information, we cannot rule out the possibility that N2 is just a bright emission line knot resulting from, e.g., a jet-cloud interaction, a process often observed in both Seyfert and radio galaxies (e.g., Winge et al. 1997; Villar-Martín et al. 1999). We do not favor this scenario based on a list of reasons: 1) A jet-cloud interaction usually produces very broad line profiles (e.g., Gelderman & Whittle 1994; Capetti et al. 1999); and conversely, even though the separation of 400 between and would require the acceleration of the ionized to high velocities, the lines on are narrower than on and symmetric; 2) Fig. 6 shows that is not located along the radio axis, but at the edges of the eastern radio lobe, away from the jet path; 3) the ionization structure centered on would be a fortuitous spatial coincidence; and 4) N2 has a very high line luminosity of erg s-1 that is typical of luminous QSOs.
4 Discussion and conclusions
The source is a very bright object and has a luminosity of erg s-1. The expected X-ray luminosity, adopting a standard ratio for Seyfert I galaxies and QSOs (Panessa et al. 2006), is . The detection of a single high energy photon (above 5 keV) in the 60 ks Chandra image (see Fig. 6) requires to be a heavily absorbed, Compton thick source. The expected radio emission is instead mJy (Ho & Peng 2001; Panessa et al. 2007). This low flux level makes a radio detection very challenging, also considering that it would be embedded in the western lobe of 3C 459. A similar flux density is predicted in the mid-infrared window (Horst et al. 2008; González-Martín et al. 2013). This is well below the sensitivity of current instruments (e.g., Asmus et al. 2014), but easily reached with the James Webb Space Telescope. An alternative approach to explore the nature of further is to employ ALMA for a high resolution search for the nuclear molecular gas expected to be associated with the secondary AGN (Villar-Martín et al. 2013).
3C 459 is the only dual AGN candidate emerging from a preliminary analysis of the MURALES data obtained so far, that includes 20 radio galaxies, 15 of which are FR II. However, it might not be an isolated case. Tremblay et al. (2009) presented the results of a project of emission line imaging of the 3C sample with HST, also limited to : data are available for 19 objects, only two in common with MURALES. Two galaxies, namely 3C 136.1 and 3C 196.1, show a morphology similar to 3C 459, which have two compact regions of line emission separated by , corresponding to 0.5 and 1.5 kpc, respectively (Tremblay et al. 2009). Although all these sources require further analysis, the fraction of dual AGN in the 3C sample could be significant, on the order of 10%. Improved insight into this phenomenon, and its connection with the dynamical stage of the mergers, would be of great importance to explore the role of mergers in the triggering and in evolution of powerful radio sources. Further MUSE and HST observations are needed to set these results on stronger statistical grounds.
Acknowledgements.
Based on observations made with ESO Telescopes at the La Silla Paranal Observatory under program ID 097.B-0766(A). This research has made use of data obtained from the Chandra Data Archive. The National Radio Astronomy Observatory is a facility of the National Science Foundation operated under cooperative agreement by Associated Universities, Inc. B.B. acknowledge financial contribution from the agreement ASI-INAF I/037/12/0. Some of the data presented are based on observations made with the NASA/ESA Hubble Space Telescope, obtained from the data archive at the Space Telescope Science Institute. STScI is operated by the Association of Universities for Research in Astronomy, Inc. under NASA contract NAS 5-26555. We thank the referee for her/his comments.References
- Alexander (1985) Alexander, P. 1985, MNRAS, 213, 743
- Asmus et al. (2014) Asmus, D., Hönig, S. F., Gandhi, P., Smette, A., & Duschl, W. J. 2014, MNRAS, 439, 1648
- Baldi & Capetti (2008) Baldi, R. D. & Capetti, A. 2008, A&A, 489, 989
- Baldi et al. (2013) Baldi, R. D., Capetti, A., Buttiglione, S., Chiaberge, M., & Celotti, A. 2013, A&A, 560, A81
- Balmaverde et al. (2018) Balmaverde, B., Capetti, A., Marconi, A., & Venturi, G. 2018, ArXiv e-prints [arXiv:1801.05435]
- Bansal et al. (2017) Bansal, K., Taylor, G. B., Peck, A. B., Zavala, R. T., & Romani, R. W. 2017, ApJ, 843, 14
- Begelman et al. (1980) Begelman, M. C., Blandford, R. D., & Rees, M. J. 1980, Nature, 287, 307
- Blandford & Znajek (1977) Blandford, R. D. & Znajek, R. L. 1977, MNRAS, 179, 433
- Blecha et al. (2013) Blecha, L., Loeb, A., & Narayan, R. 2013, MNRAS, 429, 2594
- Buttiglione et al. (2009) Buttiglione, S., Capetti, A., Celotti, A., et al. 2009, A&A, 495, 1033
- Buttiglione et al. (2010) Buttiglione, S., Capetti, A., Celotti, A., et al. 2010, A&A, 509, A6
- Capetti et al. (1999) Capetti, A., Axon, D. J., Macchetto, F. D., Marconi, A., & Winge, C. 1999, ApJ, 516, 187
- Capetti & Balmaverde (2006) Capetti, A. & Balmaverde, B. 2006, A&A, 453, 27
- Cappellari & Copin (2003) Cappellari, M. & Copin, Y. 2003, MNRAS, 342, 345
- Cardelli et al. (1989) Cardelli, J. A., Clayton, G. C., & Mathis, J. S. 1989, ApJ, 345, 245
- Chiaberge et al. (2017) Chiaberge, M., Ely, J. C., Meyer, E. T., et al. 2017, A&A, 600, A57
- Chiaberge et al. (2015) Chiaberge, M., Gilli, R., Lotz, J. M., & Norman, C. 2015, ApJ, 806, 147
- Chiaberge & Marconi (2011) Chiaberge, M. & Marconi, A. 2011, MNRAS, 416, 917
- De Paolis et al. (2004) De Paolis, F., Ingrosso, G., & Nucita, A. A. 2004, A&A, 426, 379
- Ellison et al. (2017) Ellison, S. L., Secrest, N. J., Mendel, J. T., Satyapal, S., & Simard, L. 2017, MNRAS, 470, L49
- Fu et al. (2011) Fu, H., Myers, A. D., Djorgovski, S. G., & Yan, L. 2011, ApJ, 733, 103
- Gabányi et al. (2016) Gabányi, K. É., An, T., Frey, S., et al. 2016, ApJ, 826, 106
- Gelderman & Whittle (1994) Gelderman, R. & Whittle, M. 1994, ApJS, 91, 491
- González-Martín et al. (2013) González-Martín, O., Rodríguez-Espinosa, J. M., Díaz-Santos, T., et al. 2013, A&A, 553, A35
- Hennawi et al. (2010) Hennawi, J. F., Myers, A. D., Shen, Y., et al. 2010, ApJ, 719, 1672
- Ho & Peng (2001) Ho, L. C. & Peng, C. Y. 2001, ApJ, 555, 650
- Hopkins et al. (2014) Hopkins, P. F., Kereš, D., Oñorbe, J., et al. 2014, MNRAS, 445, 581
- Horst et al. (2008) Horst, H., Gandhi, P., Smette, A., & Duschl, W. J. 2008, A&A, 479, 389
- Husemann et al. (2018) Husemann, B., Worseck, G., Arrigoni Battaia, F., & Shanks, T. 2018, ArXiv e-prints [arXiv:1801.05442]
- Kewley et al. (2006) Kewley, L. J., Groves, B., Kauffmann, G., & Heckman, T. 2006, MNRAS, 372, 961
- Kharb et al. (2017) Kharb, P., Lal, D. V., & Merritt, D. 2017, Nature Astronomy, 1, 727
- Kocevski et al. (2015) Kocevski, D. D., Brightman, M., Nandra, K., et al. 2015, ApJ, 814, 104
- Koss et al. (2012) Koss, M., Mushotzky, R., Treister, E., et al. 2012, ApJ, 746, L22
- Koss et al. (2016) Koss, M. J., Glidden, A., Baloković, M., et al. 2016, ApJ, 824, L4
- Lister et al. (2013) Lister, M. L., Aller, M. F., Aller, H. D., et al. 2013, AJ, 146, 120
- Lobanov & Roland (2005) Lobanov, A. P. & Roland, J. 2005, A&A, 431, 831
- Massaro et al. (2012) Massaro, F., D’Abrusco, R., Tosti, G., et al. 2012, ApJ, 750, 138
- Massaro et al. (2015) Massaro, F., Harris, D. E., Liuzzo, E., et al. 2015, ApJS, 220, 5
- Massaro et al. (2010) Massaro, F., Harris, D. E., Tremblay, G. R., et al. 2010, ApJ, 714, 589
- Mihos & Hernquist (1996) Mihos, J. C. & Hernquist, L. 1996, ApJ, 464, 641
- Morganti et al. (2005) Morganti, R., Tadhunter, C. N., & Oosterloo, T. A. 2005, A&A, 444, L9
- Müller-Sánchez et al. (2015) Müller-Sánchez, F., Comerford, J. M., Nevin, R., et al. 2015, ApJ, 813, 103
- Myers et al. (2008) Myers, A. D., Richards, G. T., Brunner, R. J., et al. 2008, ApJ, 678, 635
- O’Dea & Owen (1985) O’Dea, C. P. & Owen, F. N. 1985, AJ, 90, 927
- Owen et al. (1985) Owen, F. N., O’Dea, C. P., Inoue, M., & Eilek, J. A. 1985, ApJ, 294, L85
- Panessa et al. (2007) Panessa, F., Barcons, X., Bassani, L., et al. 2007, astro-ph/0701546 [astro-ph/0701546]
- Panessa et al. (2006) Panessa, F., Bassani, L., Cappi, M., et al. 2006, A&A, 455, 173
- Ramos Almeida et al. (2012) Ramos Almeida, C., Bessiere, P. S., Tadhunter, C. N., et al. 2012, MNRAS, 419, 687
- Ramos Almeida et al. (2011) Ramos Almeida, C., Tadhunter, C. N., Inskip, K. J., et al. 2011, MNRAS, 410, 1550
- Reyes et al. (2008) Reyes, R., Zakamska, N. L., Strauss, M. A., et al. 2008, AJ, 136, 2373
- Ricci et al. (2017) Ricci, C., Bauer, F. E., Treister, E., et al. 2017, MNRAS, 468, 1273
- Rodriguez et al. (2006) Rodriguez, C., Taylor, G. B., Zavala, R. T., et al. 2006, ApJ, 646, 49
- Roland et al. (2013) Roland, J., Britzen, S., Caproni, A., et al. 2013, A&A, 557, A85
- Romero et al. (2000) Romero, G. E., Chajet, L., Abraham, Z., & Fan, J. H. 2000, A&A, 360, 57
- Rosario et al. (2011) Rosario, D. J., McGurk, R. C., Max, C. E., et al. 2011, ApJ, 739, 44
- Satyapal et al. (2017) Satyapal, S., Secrest, N. J., Ricci, C., et al. 2017, ApJ, 848, 126
- Smith et al. (2010) Smith, K. L., Shields, G. A., Bonning, E. W., et al. 2010, ApJ, 716, 866
- Steenbrugge & Blundell (2008) Steenbrugge, K. C. & Blundell, K. M. 2008, MNRAS, 388, 1457
- Tadhunter et al. (2002) Tadhunter, C., Dickson, R., Morganti, R., et al. 2002, MNRAS, 330, 977
- Tadhunter et al. (2011) Tadhunter, C., Holt, J., González Delgado, R., et al. 2011, MNRAS, 412, 960
- Tadhunter & Tsvetanov (1989) Tadhunter, C. & Tsvetanov, Z. 1989, Nature, 341, 422
- Thomasson et al. (2003) Thomasson, P., Saikia, D. J., & Muxlow, T. W. B. 2003, MNRAS, 341, 91
- Treister et al. (2012) Treister, E., Schawinski, K., Urry, C. M., & Simmons, B. D. 2012, ApJ, 758, L39
- Tremblay et al. (2009) Tremblay, G. R., Chiaberge, M., Sparks, W. B., et al. 2009, ApJS, 183, 278
- Ulvestad (1985) Ulvestad, J. S. 1985, ApJ, 288, 514
- Van Wassenhove et al. (2012) Van Wassenhove, S., Volonteri, M., Mayer, L., et al. 2012, ApJ, 748, L7
- Villar-Martín et al. (2013) Villar-Martín, M., Rodríguez, M., Drouart, G., et al. 2013, MNRAS, 434, 978
- Villar-Martín et al. (1999) Villar-Martín, M., Tadhunter, C., Morganti, R., Axon, D., & Koekemoer, A. 1999, MNRAS, 307, 24
- Wang et al. (2009) Wang, J.-M., Chen, Y.-M., Hu, C., et al. 2009, ApJ, 705, L76
- Westhues et al. (2016) Westhues, C., Haas, M., Barthel, P., et al. 2016, AJ, 151, 120
- Williams et al. (2017) Williams, D. R. A., McHardy, I. M., Baldi, R. D., et al. 2017, MNRAS, 472, 3842
- Wills et al. (2008) Wills, K. A., Tadhunter, C., Holt, J., et al. 2008, MNRAS, 385, 136
- Wilson et al. (1993) Wilson, A. S., Braatz, J. A., Heckman, T. M., Krolik, J. H., & Miley, G. K. 1993, ApJ, 419, L61
- Winge et al. (1997) Winge, C., Axon, D. J., Macchetto, F. D., & Capetti, A. 1997, ApJ, 487, L121
- Zakamska et al. (2003) Zakamska, N. L., Strauss, M. A., Krolik, J. H., et al. 2003, AJ, 126, 2125