Physical properties and CNO abundances for high-mass stars in four main-sequence detached eclipsing binaries: V478 Cyg, AH Cep, V453 Cyg and V578 Mon
Abstract
A prerequisite for probing theortical evolutionary models for high-mass stars is the determination of stellar physical properties with a high accuracy. We do this for three binary systems containing components with masses above 10: V478 Cyg, AH Cep and V453 Cyg. New high-resolution and high-S/N échelle spectra were secured and analysed using spectral disentangling, yielding improved orbital elements and the individual spectra for the component stars. In conjuction with a re-analysis of archival light curves, the stellar masses and radii were measured to accuracies of 1.5–2.5% and 1.0–1.9%, respectively. Detailed spectroscopic analysis then yielded atmospheric parameters and abundances for C, N, O, Mg and Si. Abundances were also determined for V578 Mon. These results allowed a detailed comparison to the predictions of stellar evolutionary models. No star in our sample fits its position on the evolutionary track for its dynamical mass, leaving mass discrepancy (or alternatively overluminosity) an open problem in theoretical modelling. Moreover, the CNO abundances cluster around the initial values with mean values and . No trend in the CNO abundances for single OB stars are found for the eight high-mass stars analysed here, as well in an extended sample including literature results. This opens an important question on the role of binarity in terms of tides on damping internal mixing in stars residing in binary systems.
keywords:
stars: binaries: eclipsing – stars: binaries: spectroscopic – stars: fundamental paramtrs – stars: abundances1 Introduction
Detached eclipsing binary stars (dEBs) are the primary source of fundamental stellar properties (mass , radius and effective temperature ). Direct determinations of mass, the most fundamental stellar quantity, can be obtained only from measurements of radial velocities (RVs) of the components in binary and multiple system, complemented with a determination of the inclination of the orbital plane either from analysis of light curves, or astrometric/interferometric measurements (c.f. Hilditch, 2000). Dynamically determined stellar mass is a model-independent quantity. Assessing the fidelity of theoretical stellar evolutionary models is possible only with accurate empirical data (Pols et al., 1997; Lastennet & Valls-Gabaud, 2002; Torres et al., 2010).
Despite the astrophysical importance of high mass stars in the critical evaluation of stellar theoretical predictions, only ten dEBs were known with physical properties measured to an accuracy and precision of 3%, at the time of the most recent review paper (Torres et al., 2010). Since then, this list has been expanded by only three systems (see DEBCat111http://www.astro.keele.ac.uk/jkt/debcat/, Southworth 2015), so the situation remains unsatisfactory. An important piece of analysis is also missing for many high-mass dEBs: a detailed spectroscopic analysis including atmospheric diagnostics and determination of the photospheric chemical composition for the individual components in a system.
Some steps have been undertaken in this direction (Pavlovski & Hensberge, 2005; Pavlovski & Southworth, 2009; Pavlovski et al., 2009; Mayer et al., 2013; Tkachenko et al., 2014a, b, 2016; Martins et al., 2017), but the small sample size prevents definitive conclusions. However, the results of these studies have clearly confirmed the disagreement between empirical data and theoretical evolutionary models: high-mass stars are in general more luminous than predicted by theoretical calculations for their measured dynamical masses. This effect was discovered and named the ‘mass discrepancy’ by Herrero et al. (1992), who compared spectroscopically determined masses to evolutionary tracks for single high-mass stars. The inclusion of rotation into theoretical models was a promising solution, as stellar rotation could induce some extra missing of stellar material, and moreover lift nuclear-processed material up to the surface layers (Maeder & Meynet, 2000; Langer, 2012). However, observational studies have not completely supported this concept (Hunter et al., 2008, 2009), opening more problems than were solved. Whilst changes in the carbon, nitrogen and oxygen (C, N and O) abundances in the photospheres of high-mass single stars were proved with dedicated accurate observations (Przybilla et al., 2010; Nieva & Przybilla, 2012; Maeder et al., 2014), the role of rotation remains unclear and possibly unhelpful (Aerts et al., 2014). The observational studies of highly rotating stars with the masses larger than 20 (Cazorla et al., 2017a, b; Markova et al., 2018) are also inconclusive for the role of rotational mixing in changing the abundance pattern for the CNO elements in stellar atmospheres. Promising direction in understanding internal structure and mixing profiles for high mass stars is coming through asteroseismic probing as was shown in the calculations by Pedersen et al. (2018). The authors showed that a combination of gravity-mode oscillations and surface nitrogen abundance is extremely sensitive probe for constraining not only the amount but also the profile of interior mixing in intermediate- and high-mass stars.
Recently, Garland et al. (2017) examined a sample of B-type multiple systems in the VLT/FLAMES Tarantula Survey. Due to observational constraints the authors limited their sample to the subset of 33 systems with relatively small projected rotational velocities ( km s-1). Their abundance analysis revealed primary stars with a whole range of N enhancement up to a normal abundance, thus corroborating the N abundances found for single B-type stars in the LMC. The majority of the stars studied in their sample were identified as binary systems from RV variability and/or detection of a secondary component in the spectrum. Their results suffer from unknown contribution and flux dilution due to the presence of the secondary star, which would affect the measurement of the atmospheric parameters and abundances. Since abundance changes are sensitive to bulk metallicity, binaries in the Local Group of galaxies like the LMC and SMC are important for further investigation.
| Binary | HD | Orbital | Spectral | Age | Cluster | Apsidal | |
|---|---|---|---|---|---|---|---|
| system | number | period [d] | [mag] | types | [Myr] | membership | period [yr] |
| V478 Cyg | 121721 | 2.88 | 8.63 | O9.5 V + 09.5 V | 10 | Cyg OB1 | |
| AH Cep | 99272 | 1.77 | 6.88 | B0.5 Vn + B0.5 Vn | 3.2 | ||
| V453 Cyg | 126721 | 3.89 | 8.28 | B0.4 IV + B0.7 IV | 6.9 | Cyg OB2 | |
| V578 Mon | 53121 | 2.41 | 8.55 | B1 V + B2 V | 2.2 | NGC 2244 |
Empirical constraints on these processes remain hard to come by, despite a steady improvement in observational techniques and capabilities (see Hilditch, 2004). In the current series of papers we aim to calibrate the abundance patterns and chemical evolution of a sample of high-mass stars by analysing dEBs. These are vital for obtaining observational constraints on the structure and evolution of high-mass stars, and are the primary source of directly measured stellar properties (Andersen, 1991). Chemical abundances are difficult to determine from the spectra of high-mass dEBs for several reasons. Firstly, they tend to display only a small number of spectral lines. Secondly, the often high values of these objects means the lines are wide and shallow. Thirdly, in dEBs the spectral lines from the two components interfere with each other (‘line blending’).
In a seminal work, Simon & Sturm (1994) introduced the technique of spectral disentangling (spd), by which individual spectra of the component stars of a double-lined spectroscopic binary can be deduced from observations covering a range of orbital phases. spd can be used to measure spectroscopic orbits which are not affected by line blending (see Southworth & Clausen, 2007). The resulting disentangled spectra also have a much higher S/N than the original observations, making them very useful for chemical abundance analysis. As a bonus, the strong degeneracy between and surface gravity () is not a problem for dEBs because can be measured directly and to high accuracy (0.01 dex or better). A detailed investigation of these possibilities is given by Pavlovski & Hensberge (2005, hereafter PH05).
2 Sample
Four main-sequence (MS) binary systems have been selected for study, based partly on the availability of high-resolution spectra. These are V478 Cyg, AH Cep, V453 Cyg and V578 Mon, all composed of components of late-O or early-B spectral type. Basic information on these systems is given in Table 1. The component stars have s between 25 000 and 32 000 K, and s from 3.7 to 4.2. The primary star of V453 Cyg is near the terminal-age MS, the components of V478 Cyg are roughly halfway through their MS lifetimes, and the components of AH Cep are early in their MS lifetimes. We now introduce each of these systems.
2.1 V478 Cygni
V478 Cyg is the least-studied system considered here. This is surprising becasuse it contains two late-O stars with masses slightly above 16, so is very useful for constraining the evolution of high-mass stars. The only modern spectroscopic study is due to Popper & Hill (1981), who secured observations at the Lick Observatory. The cross-correlation technique was applied to derive RVs using He i lines, based on digitised versions of the photographic-plate spectra. The RVs were complemented with extensive photometric observations (Popper & Hill, 1981; Sezer et al., 1983) and the properties of the components were derived. This revealed it to be a binary system of two almost identical components.
Mossakovskaya & Khaliullin (1996) found apsidal motion from photometric observations, and estimated an age of about 4 Myr from a comparison of the observed masses and radii to theoretical models. Wolf et al. (2006) presented additional times of minimum light and determined an apsidal period of yr and an eccentricity of Claret & Giménez (2010) analysed the apsidal motion for a sample of well-determined binaries, including V478 Cyg, and found an excellent agreement between the observations and stellar models.
Zakirov (1993) presented and analysed extensive photometry of V478 Cyg. Zakirov (1990) studied the membership probability of this binary system in the open cluster Dolidze 42 using multicolour photometry. They found that it is a background object, but is probably a member of the OB association Cyg OB1 with the distance of 1.04 kpc and an age of about 10 Myr.
2.2 AH Cephei
AH Cep is a short-period dEB composed of two high-mass early-B stars (Bell et al., 1986; Holmgren et al., 1990). Modern photometric solutions (Bell et al., 1986; Drechsel et al., 1989; Harvig, 1990) have shown that the system is detached and at the beginning of its MS lifetime with an age of about 6 Myr. Unfortunately, it is not a member of any known stellar cluster or association, so an independent estimate of the age is not available.
Some ambiguity is left in the photometric solution primarily because of the uncertainties in the component s. The rather low orbital inclination, which causes the eclipses to be partial and shallow, has contributed additional uncertainties especially when the light ratio of the two stars is not fixed via spectroscopic analysis (see Section 4.1).
There are indications for the presence of a third body in the system, on the basis of the period study by Mayer & Wolf (1986) and third light in light curve solutions (Drechsel et al., 1989). However, the analysis of times of minima by Bell et al. (1986) did not support the claimed light-time effect. This issue has been discussed by Harvig (1990) and Kim et al. (2005). These authors also suggested that a fourth body could exist. Also uncorroborated is the claim by Drechsel et al. (1989) that long-term changes in the amplitude of the light curve exist, which these authors explained by the effect of changing inclination.
The values of the components are relatively high (185 km s-1, Holmgren et al. 1990), so the lines available for RV measurement are rather broad and/or shallow, and difficult to measure. This might explain the poor agreement between different datasets. Modern spectroscopic studies have yielded masses of the components of plus (Bell et al., 1986), plus (Holmgren et al., 1990), and plus (Burkholder et al., 1997)222There is a numerical error in the calculation of the uncertainties in Burkholder et al. (1997) as they used an inclination of instead of the value of given by Bell et al. (1986)..
Ignace et al. (2017) analysed Chandra observations and found X-ray variability. They also studied CW Cep, a binary system with very similar physical properties to AH Cep. CW Cep was not detected as X-ray source, so they excluded embedded wind shocks or binary wind collision as the source of the X-rays in AH Cep. The X-rays were instead attributed to magnetism in one or both components of AH Cep.
2.3 V453 Cygni
V453 Cyg is the only totally-eclipsing binary in our sample. Its primary (more massive, and hotter) component has passed more than half its MS lifetime, and is evolutionarily the most advanced among the stars in our sample. In a comprehensive study of V453 Cyg Southworth et al. (2004) analysed new grating spectra and the light curves from Cohen (1974), obtaining masses of and , and radii of and . The high precision of the radius determination was greatly helped by the deep and total eclipses. An apsidal period of yr was found.
The same set of grating spectra, centred on the H line, were complemented with grating spectra obtained by Simon & Sturm (1994) and further analysed by Pavlovski & Southworth (2009). They applied spd to isolate the individual spectra of the components. The spectroscopic analysis yielded K and K. Abundances for both components were determined for the first time. The abundances were found to be typical for B-type stars, whilst no indication was found for the presence of CNO-processed material in the photospheres of the component stars.
2.4 V578 Monocerotis
V578 Mon is composed of two early-B stars. It is a member of the young open cluster NGC 2244, which is itself embedded in the Rosette Nebula (NGC 2237, NGC 2246). This star-forming region is situated inside the older Mon OB2 association (see Román-Zúñiga & Lada 2008 and references therein). Heiser (1977) found V578 Mon to show fast apsidal motion. The first comprehensive analysis of photometric and spectroscopic observations for this system was accomplished by Hensberge et al. (2000), based on photometric measurements and high-resolution échelle spectra. Application of spd made possible the determination of the orbital and stellar quantities with a high accuracy.
Garcia et al. (2011) studied apsidal motion for this system, and improved the measurement of its orbital eccentricity. Garcia et al. (2014) reanalysed all available light curves, complemented with new high-resolution spectra secured with the hermes spectrograph at the Mercator telescope on La Palma, Spain. Their results were fully compatible with those of Hensberge et al. (2000), with a further improvement in the accuracy. Hence the uncertainties in mass are around 0.5%, in radius around 1%, and in around 1.7%. They also found yr. These results make V578 Mon a benchmark dEB among the high-mass binaries, and allows a strict test of stellar evolutionary models (Garcia et al., 2014).
V578 Mon was detected in the high-spatial-resolution X-ray study of NGC 2244 using Chandra (Wang et al., 2008). The authors attributed the X-ray spectra of the Rosette Nebula OB stars to the standard model of small-scale shocks in the inner wind of these high-mass stars. Since V578 Mon is an eclipsing system it offers a rare opportunity where X-ray eclipses can be used to constrain the emitting geometry. However, to our knowledge no further X-ray study of this binary system has been undertaken.
 |
 |
 |
 |
3 Spectroscopic data
New spectroscopic observations have been secured with three high-resolution échelle spectrographs.
A total of 13 spectra for V478 Cyg were aquired in June 2013 with the Hamilton Echelle Spectograph (Vogt, 1987) on the Shane 3 m telescope at Lick Observatory, USA. The spectra cover 3550–7280 Å over 89 échelle orders and with resolving power . The signal to noise ratios (S/N) in the visual range from 53 to 92 and average 70.
AH Cep was observed using the Fibre-fed Echelle Spectrograph (FIES, Telting et al. 2014) aT the 2.56 m Nordic Optical Telescope at La Palma, Spain. 26 spectra were obtained in November 2006 and October 2007. The spectra cover 3440–9700 Å over 79 échelle orders with . The S/N values range from 230 to 355 and average 300.
21 spectra of V453 Cyg were obtained in August 2008 using the Fiber Optics Cassegrain Echelle Spectrograph (FOCES, Pfeiffer et al. 1998) on the 2.2 m telescope at Calar Alto, Spain. They cover 3850–7340 Å at , and have S/N values from 80 to 110 with an average of 97.
The spectra for V578 Mon (Garcia et al., 2014) were acquired with the High Efficiency and high Resolution Mercator Echelle Spectrograph (HERMES, Raskin et al. 2011) on the 1.2 m Mercator telescope at La Palma, Spain. The 33 spectra cover 3700–9100 Å at and with S/N values from 70 to 110.
In each case, wavelength calibration was performed using thorium-argon exposures, and flat-fields were obtained using a halogen lamp. The FIES and FOCES spectra were bias-subtracted, flat-fielded and extracted with the iraf333iraf is distributed by the National Optical Astronomy Observatory, which are operated by the Association of the Universities for Research in Astronomy, Inc., under cooperative agreement with the NSF. échelle package routines. The Hamilton spectra were reduced with the standard reduction package for this instrument. Normalisation and merging of the orders was performed with great care, using programs developed by ourselves (Kolbas et al., 2014), to ensure that these steps did not cause any systematic errors in the resulting spectra.
| Binary | Period | ||||||
|---|---|---|---|---|---|---|---|
| system | [d] | [d] | [deg] | [km s1] | [km s1] | ||
| V478 Cyg | 2.8808994 | 2456222.23 0.19 | 0.021 0.005 | 148.1 21.3 | 225.9 2.3 | 231.5 2.6 | 0.976 0.011 |
| AH Cep | 1.7747420 | - | 0.0 | - | 234.9 1.1 | 276.9 1.4 | 0.848 0.009 |
| V453 Cyg | 3.889825 | 2445272.31 0.16 | 0.022 0.003 | 25.1 11.7 | 175.2 1.3 | 220.2 1.6 | 0.795 0.007 |
4 Spectroscopic orbits
4.1 Spectral disentangling
Our analysis follows the methods introduced by Hensberge et al. (2000) and PH05 in their studies of V578 Mon. This approach involves reconstruction of individual component spectra from the observed composite spectra using spd, which then enables a detailed abundance analysis using the same methods as for single stars (Hensberge & Pavlovki, 2007; Pavlovski & Hensberge, 2010; Pavlovski & Southworth, 2012). spd also gives the velocity amplitudes of the two stars which, together with analysis of light curves, yields the physical properties of the stars. The abundance analysis then can benefit from the availability of the precise and accurate surface gravity measurements from the known masses and radii of the stars.
The spectra of OB binaries are dominated by pressure-broadened H and He lines, and usually rotationally broadened metal lines. Although metal lines are not numerous, and are due to only a few species at these high s, line blending is severe and further enhanced by Doppler shifts in the course of the orbital cycle. This is the principal reason the masses and atmospheric properties for most high-mass stars are not derived with an accuracy usually achieved for low-mass stars. spd enables reconstruction of individual spectra of the components from a time-series of composite spectra, while simultaneously solving for the optimal orbital elements. There is no need for template spectra which also means biases due to template mismatch are avoided (Hensberge & Pavlovki, 2007).
We performed spd in the Fourier domain (Hadrava, 1995) using the code fdbinary444http://sail.zpf.fer.hr/fdbinary/ (Ilijić et al., 2004). One advantage of Fourier disentangling is that only modest computing resources are needed, so long or multiple spectral segments can be disentangled. Some practical issues for spd are discussed in Pavlovski & Hensberge (2010). A regular distribution of observations through the orbital cycle is important, as was shown numerically by Hensberge et al. (2008). Otherwise, a spurious pattern in disentangled spectra can appear, diminishing the quality of reconstructed spectra and affecting the reliability of the orbital solution.
In fdbinary optimisation is performed with the simplex routine (Press et al., 1992). We usually performed 100 runs, each with 1000 iterations, examining a relatively wide parameter space around the initial set of orbital parameters. In most cases, with high-S/N spectra well distributed in the orbital phases, convergence was achieved quickly.
4.2 Error calculations for the orbital parameters in spectral disentangling with bootstrapping
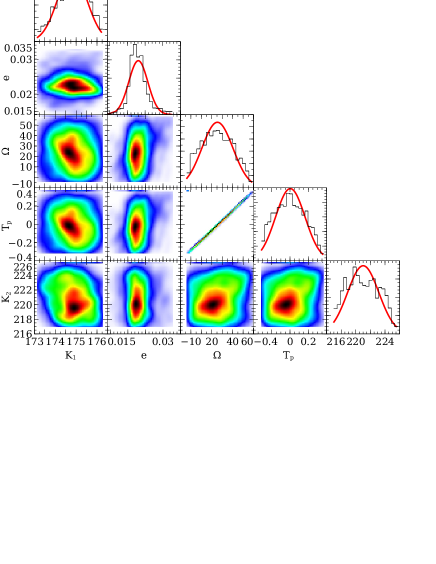
spd allows the disentangled spectra of the component stars to be determined simultanously with the orbital elements of the binary system. Propagation of uncertainties through this process is difficult so must be tackled numerically. The fdbinary code includes an implementation of the jackknife method (Tukey, 1958), which is an early example of resampling methods with limited statistical validity. We have therefore quantified the uncertainties of the orbital elements from spd using bootstrapping (Efron, 1979), a versatile generalisation of jackknife. Bootstrapping is an efficient tool for constraining confidence intervals and calculating standard errors (Lupton, 1993; Ivezić et al., 2014).
Our approach is to generate a large number of spectral datasets by sampling from the original spectra with replacement. Whilst for observed spectra the jackknife method allows only unique samples to be obtained, bootstrapping allows for up to samples although in practise of order 1000 samples are sufficient. Each of the spectral datasets are run through fdbinary in order to determine a distribution of values for each orbital parameter of interest. From these distributions we calculate the standard deviation of the values for each parameter and adopt this as its uncertainty. fdbinary is well suited to this approach because its use of the Fourier domain makes it relatively fast, although it remains computationally demanding for eccentric orbits.
 |
 |
 |
 |
4.3 Orbit determination
In spd the orbital parameters are determined simultaneously with a reconstruction of the components’ individual spectra using a time-series of the observed spectra after careful continuum normalisation (Kolbas et al., 2014). First, we searched for the orbital solution by performing spd on relatively short spectral segments of about 100–300 Å width, centred on the prominent H i and He i lines. Since the spectra of all binary systems analysed here are affected by diffuse interstellar bands (DIBs) and interstellar lines, special care was taken to mask them. The red parts of the spectra were also not used because of variable telluric lines which cannot be handled with the present version of fdbinary.
In the final run for the orbital solution we performed spd in a large spectral range covering about 4000 to 6000 Å, masking the broad Balmer lines and DIBs. Thus, the orbital parameters are derived from He i, He ii, and numerous metal lines, of which the lines of He i, and He ii are the strongest in almost all spectra of the individual components. The Balmer lines were excluded from this analysis because Doppler shifts are much smaller than intrinsic width of the lines, and some unavoidable systematic uncertainties remain in placing the continuum level for these broad lines.
4.3.1 V478 Cyg
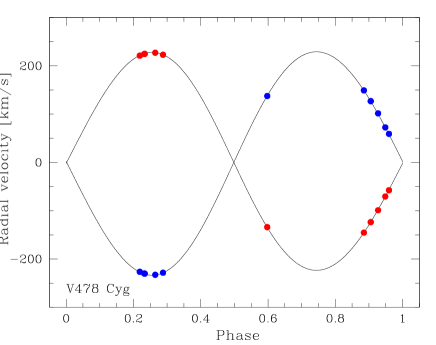
Our 11 spectra are not ideally distributed in orbital phase. The first quadrature is covered well, but the second is not (see Fig. 2). We fitted for the parameters of an eccentric orbit, since indications of orbital eccentricity were found previously (Popper & Etzel, 1981). The results are given in Table 2. The errors were calculated via bootstrapping. We confirm the finding of Popper & Hill (1981) that the masses of the components are very similar. The mass ratio determined with spd, is in excellent agreement with that found by Popper & Hill (1981), and within 1- uncertainty corroborates with the result of Martins et al. (2017) who derived . Latter result is also based on high-resolution CCD spectra, and using spd method for determination of the spectroscopic orbit.
We find that the velocity amplitudes , and determined via spd are systematically lower than those measured using cross-correlation (Popper & Hill, 1981). The difference is about 6 km s-1 and means our measured masses are lower than those found by Popper & Hill (1981). Popper & Hill introduced an empirical correction factor calibrated in cross-correlation of standard RV stars. If uncorrected values are considered, then the differences in and between their and our result amount to about 13 km s-1. This is true also for the measurements performed by Martins et al. (2017) who obtained km s-1, and km s-1, but setting the eccentricity , as Popper & Hill (1981) did, too.
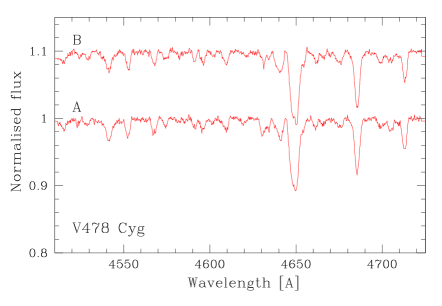
V478 Cyg comprises two almost identical components, as is shown by the almost indistinguishable disentangled spectra. In subsequent spectroscopic analysis we found a difference between the stars of K. The values are high for both stars, at 125 km s-1, making the lines broad and blended. We therefore ascribe the discrepancy with the analysis of Popper & Hill (1981) to line blending affecting the cross-correlation solution of the photographic spectra with medium spectral resolution.
4.3.2 AH Cep
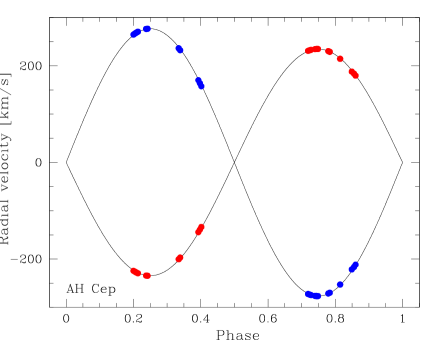
The orbital phase distribution of our 23 spectra is shown in Fig. 2. Whilst the observations do not cover a whole orbital cycle, both quadratures are well covered. This, and the fact that the orbit is circular, helps to measure and with reasonable uncertainties. We find km s-1 and km s-1 (see Table 2), giving a mass ratio of .
Our new results fall in between those of previous studies. The mass ratios obtained by Bell et al. (1986) and Holmgren et al. (1990) are the same, , and , respectively. However, the velocity amplitudes from these two works are very different. Bell et al. (1986) combined photographic and digital spectra, and found km s-1 and km s-1. In their pioneering study using cross-correlation of Reticon spectra, Holmgren et al. (1990) arrived at substantially smaller values of km s-1 and km s-1. In a third spectroscopic study of AH Cep (Burkholder et al., 1997) CCD spectra were obtained with a better spectral resolution than previously. Double Gaussians were fitted to the best double lines in the spectra, giving km s-1 and km s-1. The velocity amplitudes and mass ratio, , are within 2 of our values. The previous inconsistencies can therefore be attributed to the variety of methods and observational data employed in the previous studies of AH Cep, as well as the intrinsic difficulty of the system. The most recent spectroscopic study (Martins et al., 2017) is not helpful in resolving possible ambiguity in the spectroscopic orbit due to large uncertainties in derived semiamplitudes, km s-1, and km s-1, with .
Both stars are rotating quickly, with – km s-1, which makes the measurements of the RVs extremely difficult. In an extensive intercomparison of different measuring techniques for a similar system, Southworth & Clausen (2007) found that spd gave the most internally consistent results, followed by double-Gaussian fitting. This supports the agreement between our orbital elements and those found by Burkholder et al. (1997); our analysis also benefited from using high-resolution and high-S/N échelle spectra.
4.3.3 V453 Cyg
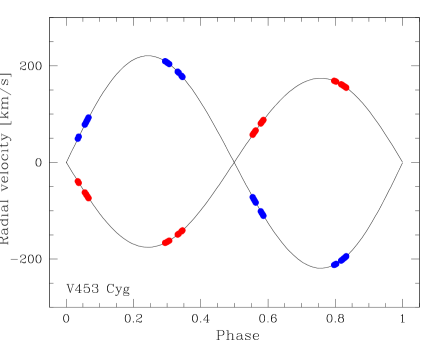
Our 33 new spectra cover the range of RVs of the two stars fairly well (Fig. 2). The orbital parameters were optimised as before, using all spectra and the spectral range 4000–6000 Å with masks on broad Balmer and interstellar lines. The uncertainties were calculated with 2000 bootstrap samples. The orbit of V453 Cyg is eccentric, and all parameters were initially set free in the calculations.
The orbital solution gives km s-1 and km s-1, which yields (Table 2). In our previous studies of V453 Cyg the orbital solution was determined from grating spectra (Southworth et al., 2004; Pavlovski & Southworth, 2009) and we found values of 172.5–174.1 km s-1, and values of 216.2–224.6 km s-1. Our new solution, based on échelle spectra, falls between these values. The eccentricity is in good agreement with that derived in Southworth et al. (2004) from apsidal motion, and within 1 of that found by Pavlovski & Southworth (2009).
Orbital solutions for V453 Cyg have also been published by Popper & Hill (1981), Simon & Sturm (1994) and Burkholder et al. (1997). The methods used by Popper & Hill (1981) and Burkholder et al. (1997) have already been described. In their seminal paper, Simon & Sturm (1994) introduced the spd method and used V453 Cyg for its very first application. This binary is totally eclipsing, and a spectrum taken during totality in the secondary eclipse matched their disentangled spectrum of the primary star very well, proving the veracity of spd. All three studies were based on digital spectra, but the analysis methods differed. The resulting masses were –14.4 and –11.1; our new values are and .
5 Spectroscopic analysis
5.1 Reconstruction of the individual components’ spectra
Disentangled spectra of the components are normally still in the common continuum of the binary system. This is because the lack of significant light variations outside eclipse means that the determinant of the set of equations for zero mode in Fourier expansion is strictly zero. This singularity corresponds to the intrinsic uncertainty of how to distribute the observed continuum flux over the two components given that spd is only sensitive to changes in the flux distribution of a spectrum. This, and near-singularities which exist for other low modes, are responsible for undulations often seen in disentangled spectra (Hensberge & Pavlovki, 2007; Hensberge et al., 2008). These spurious patterns were first found in spd of relatively broad spectral segments (Hensberge et al. 2000; Fitzpatrick et al. 2002, PH05).
In the case of significant light variability, there is a guarantee that no singularities occur. This means that spectra obtained during eclipse help to stabilise the solution of spd. Caution is needed at this point. In the most cases, the line profiles during the eclipses could be affected by the Rossiter-McLaughlin effect. Distortion of the line profiles violates a principal assumption of spd that the components’ spectra are not variable except for a scaling due to the light variability. Disentangling of spectra affected by pulsations, the Rossiter-McLaughlin effect, or any other distortions, would produce unreliable results. However, the spectra obtained in the total eclipse are extremely useful because then spd has access to information on the continuum flux of the stars so is able to return disentangled spectra in their individual continua (Pavlovski & Southworth, 2009).
We performed spd in pure separation mode (Pavlovski & Hensberge, 2010), with no significant light variability even outside the eclipses. Renormalisation of the separated spectra from a common continuum of the binary system to the components’ spectra in their individual continua is a two-step procedure as was elaborated in PH05. A linear transformation involves both an additive and multiplicative operation. The additive terms come from differing line blocking between the components. The multiplication factors could be fixed from the light ratio derived in the light curve solution (Hensberge et al. 2000, PH05), or determined from the optimal fitting of the separated spectra (Tamajo et al., 2011). In the present paper we use both approaches. Obviously, in renormalisation random and systematic errors are multiplied by a factor inversely proportional to the light dilution factor. For random errors this amplification is counteracted with a gain in S/N coming from the use of time-series of the observed spectra. In other words, even when the spectral lines in the observed composite spectrum of binary system are resolved (e.g. at quadrature phases), it is more reliable to fit disentangled spectra than a single composite spectrum because of the gain in S/N achieved in spd.
5.2 Optimal fitting of disentangled spectra
Model atmospheres are defined by the , and metallicity. Once disentangled spectra are transformed from a common continuum level to their intrinsic continuum flux (Section 5.2) these stellar parameters could be derived with standard spectroscopic tools as for single stars. The atmospheric diagnostics include also measurements of , which is one of the most prominent broadening mechanisms for metallic lines. Stark-broadened H lines are not affected by the rotational kernel.
For a hot, high-mass star the helium and silicon lines, especially if present in different ionisation stages, are sensitive indicators of . The Balmer lines can also serve this purpose, but are often affected with inaccuracy in the normalisation of échelle spectra since broad wings of these lines can be spread over two to three échelle orders. The uncertainties of the continuum placement and échelle order merging are, with the singularity of Fourier zero mode, the main source of spurious patterns in disentangled spectra. In short-period binary systems, metallic lines are often broadened by a high leaving the He i and He ii lines the best diagnostic lines.
A grid search is the most common practice for determing the optimal stellar atmospheric parameters. Here we did the same, but expanded it for an additional option. Disentangling spectra preserves the astrophysical contents of the individual components. There is a scaling factor between the disentangled spectrum and intrinsic spectrum of the component which is equal to the component’s fractional light contribution to the total light of the system. Fortunately, the FWHM as a measure of is invariant on this scaling factor. Hence, the light ratio between the components could be determined from disentangled spectra directly, without a need for external information. This is useful in cases when the light ratio is poorly defined in the light curve solution (partial eclipses), or the photometric observations have low precision. Determination of the light ratio in constrained mode (Tamajo et al., 2011), i.e. with the condition that the sum of the light dilution factors should be equal to 1, is a fine cross-check for the credibility of other methods (e.g. the light curve solution).
Our first release of constrained optimal fitting of the disentangled components’ spectra was the code genfit (Tamajo et al., 2011). For its optimisation routine the code uses a genetic algorithm inspired by the pikaia subroutine of Charbonneau (1995). The error propagation is calculated with the Levenberg-Marquart method (Press et al., 1992). starfit (Kolbas et al., 2014) is our second release and an expanded version of genfit. It uses the same optimisation routine, but error calculations are performed by an MCMC routine (Ivezić et al., 2014). With starfit the following parameters for each component can be either optimised or fixed: , , , light dilution factor , Doppler shift relative to the wavelength rest frame, and an additive constant for continuum level adjustment. Both codes can be run in constrained mode (simultaneous fit for both components with the condition that ) and unconstrained mode (an independent run for each component disentangled spectrum). A grid search was made in precalculated spectra (see below). Also, we used synthetic NLTE spectra of O and B-type stars calculated by Lanz & Hubeny (2003, 2007).
5.3 Atmospheric parameters
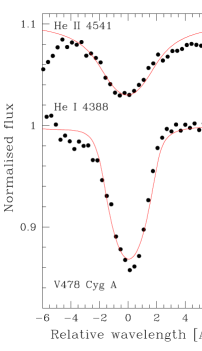
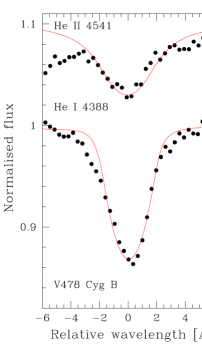
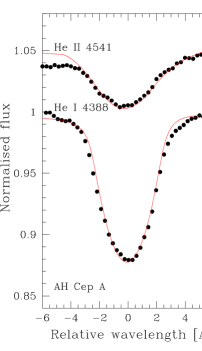
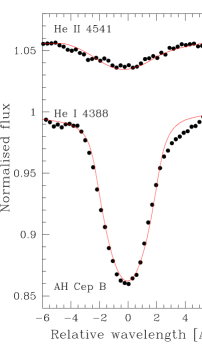
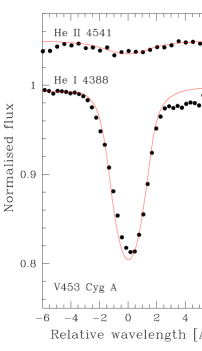
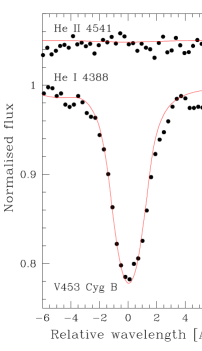
The atmospheric parameters (, and metallicity) are the principal ingredients for the generation of the model atmospheres needed for a detailed abundance analysis. Our approach has been outlined above, and includes: (i) fixing the to the value found from the combined spectroscopic and light curve analysis; (ii) whenever possible using the light ratio from the light curve analysis for the renormalisation of disentangled spectra; (iii) determining the values from clean (unblended) metal lines. Obviously, an iteration procedure is needed to converge for the atmospheric parameters. The starfit code was used for determination of the atmospheric parameters, using H and He lines, and assigning more weight to He i and He ii lines as they are a sensitive probe of . Examples of the quality of the fits to He lines are shown in Fig. 4. The results for and are given in Table 3.
For a check of the consistency of the spectroscopically derived quantities with those from the iterative procedure, we used starfit in both constrained and unconstrained modes. Fixing was found to be especially useful due to the degeneracy between and when fitting Balmer line profiles in hot stars. It was encouraging to find a good agreement for the light ratio from disentangled spectra and the light curve solutions. Therefore, in the light curve analysis of AH Cep we opted for the spectroscopically determined light ratio (Section 6.2).
| Star | ||||||||
|---|---|---|---|---|---|---|---|---|
| R☉ | [cgs] | [K] | L☉ | [km s-1] | [km s-1] | [km s-1] | ||
| V478 Cyg A | 15.40 0.38 | 7.26 0.09 | 3.904 0.009 | 32 100 550 | 4.70 0.03 | 129.1 3.6 | 127.4 1.5 | 5 1 |
| V478 Cyg B | 15.02 0.35 | 7.15 0.09 | 3.907 0.010 | 31 800 600 | 4.67 0.04 | 127.0 3.5 | 125.5 1.6 | 5 1 |
| AH Cep A | 16.14 0.26 | 6.51 0.10 | 4.019 0.012 | 30 700 550 | 4.53 0.03 | 172.1 2.1 | 185.4 1.0 | 6 1 |
| AH Cep B | 13.69 0.21 | 5.64 0.11 | 4.073 0.018 | 28 800 630 | 4.30 0.04 | 160.6 2.3 | 160.6 1.0 | 3 1 |
| V453 Cyg A | 13.90 0.23 | 8.62 0.09 | 3.710 0.009 | 28 800 500 | 4.66 0.04 | 107.2 2.8 | 112.1 1.2 | 14 1 |
| V453 Cyg B | 11.06 0.18 | 5.45 0.08 | 4.010 0.012 | 27 700 600 | 4.20 0.05 | 98.3 3.7 | 70.8 1.0 | 3 1 |
| V578 Mon A | 14.54 0.08 | 5.41 0.04 | 4.133 0.018 | 30 000 500 | 4.33 0.03 | 123 5 | 110.0 3.1 | 4 1 |
| V578 Mon B | 10.29 0.06 | 4.29 0.05 | 4.185 0.021 | 25 750 435 | 3.86 0.03 | 99 3 | 89.1 2.1 | 2 1 |
| Star | C | N | O | [N/C] | [N/O] | Mg | Si |
|---|---|---|---|---|---|---|---|
| V478 Cyg A | 8.24 0.09 | 7.69 0.11 | 8.65 0.08 | 7.69 0.10 | 7.58 0.11 | ||
| V478 Cyg B | 8.28 0.08 | 7.68 0.09 | 8.72 0.11 | 7.70 0.10 | 7.59 0.06 | ||
| AH Cep A | 8.37 0.08 | 7.64 0.07 | 8.66 0.12 | 7.78 0.10 | 7.69 0.11 | ||
| AH Cep B | 8.27 0.05 | 7.67 0.06 | 8.69 0.12 | 7.52 0.10 | 7.47 0.09 | ||
| V453 Cyg B | 8.28 0.04 | 7.73 0.09 | 8.74 0.09 | 7.53 0.10 | 7.66 0.06 | ||
| V453 Cyg B | 8.24 0.06 | 7.76 0.08 | 8.74 0.08 | 7.54 0.10 | 7.54 0.08 | ||
| V578 Mon A | 8.18 0.07 | 7.69 0.12 | 8.74 0.10 | 7.52 0.10 | 7.50 0.06 | ||
| V578 Mon B | 8.21 0.11 | 7.72 0.09 | 8.76 0.11 | 7.50 0.10 | 7.44 0.06 | ||
| OB binaries | 8.26 0.05 | 7.70 0.04 | 8.71 0.04 | 7.59 0.08 | 7.57 0.10 | ||
| B stars1 | 8.33 0.04 | 7.79 0.04 | 8.76 0.05 | 7.56 0.05 | 7.50 0.05 |
 |
 |
 |
 |
 |
 |
5.4 Photospheric chemical composition
We have estimated the chemical abundances of the stars by fitting the renormalized disentangled spectra with synthetic spectra. Non-LTE line formation and spectrum synthesis computations were performed using detail and surface (Giddings, 1981; Butler, 1984) and the model atoms as listed in Pavlovski & Southworth (2009). Model atmospheres were calculated with atlas9 (Kurucz, 1979). Justification for this hybrid approach can be found in Nieva & Przybilla (2007).
5.4.1 V478 Cyg
V478 Cyg contains stars with very similar fundamental quantities. The differences in mass and are only 0.4 and 600 K, respectively, within their 1 uncertainties. The abundances derived for the stars are also identical to within 1. The abundance pattern is close to the ‘present-day cosmic’ abundances (Nieva & Przybilla, 2012), except for magnesium. The Mg abundances are for the primary and for the secondary, so are internally very consistent. They are somewhat larger than the ‘standard’ Mg abundance in slowly rotating B-stars in the solar neighbourhood, (Nieva & Przybilla, 2012). The Mg abundance in V478 Cyg is almost identical to the mean Mg abundance determined for 52 B-stars by Lyubimkov et al. (2005). However, they adopted the mean abundance of from the stars with the most reliably determined microturbulence velocities (). Using the Mg abundance as a good indicator of metallicity (Lyubimkov et al., 2005), we can conclude that the metallicity of the stars in V478 Cyg is slightly above solar, [Mg/H] , using from Asplund et al. (2009).
The CNO abundances for the components of V478 Cyg were determined recently by Martins et al. (2017), who found considerable differences of 0.30 dex (C), 0.36 dex (N) and 0.12 dex (O) which are not corroborated by our own determinations (Table 4). Our log(N/O) and log(N/C) also clearly disagree with the results of Martins et al. (2017). There is a difference between the mass ratios derived in the two studies, and Martins et al. (2017) found a larger mass difference of 0.7 than our own. Martins et al. (2017) found the secondary star to be more luminous and also about 1000 K cooler than the primary, which is difficult to understand for a MS binary system. The abundance measurements are sensitive to the used: this is not reported by Martins et al. (2017) so we do not make any further comparison with this study.
5.4.2 AH Cep
The measured abundances for the components of AH Cep are consistent for CNO, but not for Mg and Si. Whilst the secondary star is of solar metallicity, if the Mg abundance is used as a metallicity indicator, the primary star is supersolar, with [Mg/H] 0.36 0.10 dex. Also, the primary’s Si abundance is higher than solar (Asplund et al., 2009) and the ’present-day cosmic’ standard abundance (Nieva & Przybilla, 2012). Under the assumption of the same initial chemical composition for the components of binary system, it is hard to explain how stars of such young age differ in metallicity. An incorrect light ratio, or dilution by some third light could explain these differences, but any corrections for these effects would also affect determination of the atmospheric parameters, and thus the CNO abundances. In a comprehensive study of the Mg abundance in B stars Lyubimkov et al. (2005) examined the influnce of the Al iii line at 4480.1 Å, which blends with the usually much stronger Mg ii 4481.2 Å line. For the s of the components in AH Cep this is unlikely to cause the discrepancies.
Martins et al. (2017) also studied AH Cep, and determined the CNO abundances but unfortunately not those for Mg and Si. On the average the C abundances for the components between both studies agree, but the N and O abundances from Martins et al. (2017) are systematically lower. Compared to our results (Table 4) they obtained an underabundance for both species, with and dex, and and dex, for the primary and secondary star, respectively. Again, without knowledge of the s used by Martins et al. (2017) it is hard to trace the deviations between the two studies.
5.4.3 V578 Mon
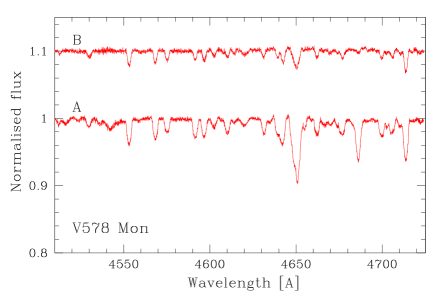
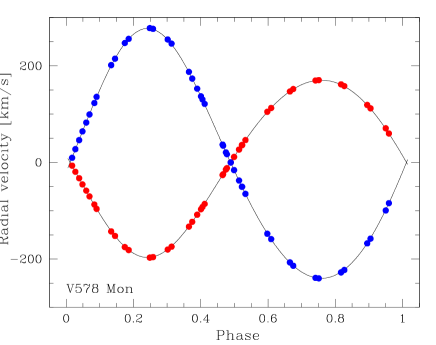
Th hermes spectra used in this work cover almost the entire optical spectral region, and substantially extend the spectral coverage on which the previous spectroscopic analysis by PH05 was based. Since the caspec spectra used by PH05 cover only 4000–5000 Å the new data makes important groups of N and C lines accessible in the 4990–5050 Å and 5115–5150 Å regions, plus some lines of interest in other spectral regions. Since the values for the components are not as large (100–120 km s-1), line blending is less severe for V578 Mon than in the other objects studied in the current work. This is important since C and N lines in this range are quite weak; the measured abundances for V578 Mon are more secure.
The results of the abundance analysis for the components of V578 Mon are given in Table 4. The photospheric abundance pattern of the two components is almost identical, and for all studied species is identical to within 1. Both components share the ‘cosmic abundance standard’ (Nieva & Przybilla, 2012), which is given at the base of Table 4, except for the C abundances which are within 2.
The photospheric composition for the components of V578 Mon was determined by PH05 relative to the sharp-lined B-type star #201 in the open cluster NGC 2244, for which a detailed spectroscopic analysis was performed by Vrancken et al. (1998). Star #201 has K and and closely resembles V578 Mon B. PH05 rotationally broadened the CASPEC spectrum of star #201 to measured the value of the components of V578 Mon. The derived abundances matched the abundance pattern of #201 fairly well, and within the 1 uncertainties. However, our new determinations do not corroborate these findings. Beside the C abundances, all other species are systematically underabundant. In this context only the deviation in abundance for Si could be understandable: in previous studies all available Si lines were used, and this is known to produce underestimates due to uncertainties in the Si model atom. In this work we used a selection of Si lines after the critical examination by Simón-Díaz (2010). For the s of the stars in question the C lines change only weakly, which could explain the apparent consistency between the new and previous determinations.
A source of the deviations could be the , but we cannot easily trace its systematics since the O abundances for the components of V578 Mon in the previous study are in perfect agreement with those in star #201. In the present study we use the s of the components found by Garcia et al. (2014), which are basically the same as those originally determined in Hensberge et al. (2000) and used by PH05. One avenue for resolving the situation is to reanalyse the reference star #201 based on new high-quality échelle spectra. Unfortunately, possible systematic errors in the abundances for star #201 make obsolete any further comparison of the abundance pattern found by Vrancken et al. (1998) for early-B stars in NGC 2244.
5.4.4 V453 Cyg
The previous abundance determination for this object (Pavlovski & Southworth, 2009) suffers from a limited spectral coverage of only 4000–4900 Å. As a consequence the C abundance relied on only two spectral lines, which were also blended with O lines. As with V578 Mon, it it important to extend the wavelength coverage to beyond H.
For V453 Cyg A, the most evolved star in the current work but still on the MS, Pavlovski & Southworth (2009) found a very high of km s-1. So far, only V380 Cyg A (an evolved star on the subgiant branch; Tkachenko et al. 2014a), has been found with such a high . It is encouraging that our reanalysis of V453 Cyg A yields km s-1, which confirms the previous finding. Also, it should be noted that the measurement for the primary star has also been revised to better match the He ii lines, and is now K. The C abundance is now much more reliably determined, primarily from lines in the 5130–5160 Å region. We also performed a check with disentangled profiles of spectral segments centred on H, and the C ii lines at 6555 Å and 6568 Å. Since we avoid a weak Si iii triplet on a blue wing of the H line, the Si abundances for both components are now consistent with their Mg abundances (Table 4).
6 Light curve analysis
The light curves of V478 Cyg, AH Cep and V453 Cyg were modelled using the Wilson-Devinney (WD) code (Wilson & Devinney, 1971; Wilson, 1979) in order to determine their photometric parameters. This code implements full Roche geometry and accounts for the effects of reflection, gravitational distortion, and limb and gravity darkening. We used the jktwd wrapper (Southworth et al., 2011), which implements automatic iteration to the differential-corrections procedure in the 2004 version of the WD code (hereafter called wd2004).
In order to determine the best solution for each light curve, we defined a default solution based on a typical approach to modelling dEBs. We then systematically varied each of the input parameters and available control parameters for wd2004 and reran the least-squares fit, to find those that had a significant effect on the output parameters. The errorbar for each output parameter was obtained from the spread of results for that parameter coming from the different fits. These errorbars are almost always much larger than the formal errors calculated by wd2004 from the covariance matrix, underlining the inadequacy of the formal errors in capturing the true uncertainty of the parameter values. Informed by these investigations, we then calculated final photometric solutions which represent our best physical interpretation of the light curves of each system.
For our default solution we chose Mode 0 in wd2004 (see Wilson & Van Hamme, 2004), which is for a detached binary where the relative light contributions of the two stars to each of the light curves are not coupled to each other or to the values. We left the s fixed at the values found in Section 5.3. The mass ratios, eccentricities and arguments of periastron were fixed to the spectroscopic values. All light curves were fitted together. The rotation rates were fixed to the values found from the atmospheric analysis. Bolometric albedos and gravity brightening exponents were fixed to 1.0 as expected for radiative envelopes. A linear limb darkening (LD) law was used, and coefficients were fixed at values interpolated from the tables of Van Hamme (1993). Our exploratory solutions used a reasonable numerical precision (n1 n2 30; see Wilson & Van Hamme 2004).
To obtain the final ‘best’ solutions we used a high numerical precision (n1 n2 60), the simple model of reflection, and suitable orbital ephemerides. We fitted for the potentials of the two stars, their contributions to the total light in each passband, orbital inclination, and the phase shift of the primary eclipse.
For the exploration and error-analysis phase we performed each of the following checks. (1) Solutions were obtained in Mode 2, which couples the s to the light contributions in each passband using predictions from model atmospheres. (2) Each light curve was modelled individually. (3) We varied the mass ratio by the size of its error bar from the spectroscopic analysis. (4) We varied the eccentricity and argument of periastron by the size of their error bars from the spectroscopic analysis. (5) Solutions were obtained using the detailed reflection option. (6) The rotation rates were included as fitted parameters. (7) The albedos were included as fitted parameters. (8) The gravity brightening exponents were included as fitted parameters. (9) The linear LD coefficients were fitted. (10) The logarithmic and square-root LD laws were tried. (11) Third light was included as a fitted parameter.
6.1 V478 Cyg
This system shows apsidal motion so the argument of periastron was included as a fitted parameter in all solutions. The orbital eccentricity was fixed at 0.021 based on our spectroscopic solution.
Light curves are available in the and bands from Sezer et al. (1983), totalling 1094 and 1079 datapoints respectively, and it is these data on which our solution is based. We were not able to obtain the data from Popper & Dumont (1977). A -band light curve containing 418 points was obtained by Laur et al. (2017) using a 0.25 m telescope in New Mexico, in the framework of a variability survey of OB associations. The measurements are quite scattered and also sparsely sampled so were not considered in detail. Finally, , , and light curves of V478 Cyg were obtained by Zakirov (1993), totalling 712, 719, 717 and 718 datapoints. These have full phase coverage but a large scatter so were not used in our best solution.
The Sezer et al. (1983) light curves do not yield a determinate ratio of the radii because the eclipses are partial and quite shallow. We therefore obtained a light ratio between the two stars from the spectroscopic analysis and used this to break the solution degeneracy. The uncertainty in this light ratio was propagated into the final results by running solutions with the light ratio perturbed by its errorbar. We expected that third light would be significant for this system, but the best-fitting value of third light is small and consistent with zero. Solutions for the , and datasets were very consistent.
We found that changing the stellar rotational velocities in the wd2004 fit can have a significant effect on the best-fit parameter values. The spectroscopic results indicate that the stars rotate super-synchronously. We set the rotation rates at 1.40 and 1.33 times the synchronous values and determined the effect of rotation on the solution by perturbing these values by 5%, a conservatively large amount.
Whilst the gravity brightening exponents have little effect on the solution, the best-fitting values for both stars are 0.85 rather than the 1.0 expected on theoretical grounds. The formal error on the values is 0.2 for both stars, so this deviation is not significant. We found that different treatments of reflection and LD have a negligible effect on the results. Fitting for the LD coefficients does give a slightly better fit to the data, so we included them as fitted parameters in the final solution. The results are given in Table 5 and the best fits are shown in Fig. 5.
| Parameter | wd2004 name | V478 Cyg | AH Cep | V453 Cyg |
| Control and fixed parameters: | ||||
| wd2004 operation mode | mode | 0 | 0 | 0 |
| Treatment of reflection | mref | 1 | 1 | 1 |
| Number of reflections | nref | 1 | 1 | 1 |
| Limb darkening law | ld | 1 (linear) | 1 (linear) | 1 (linear) |
| Numerical grid size (normal) | n1, n2 | 60 | 60 | 60 |
| Numerical grid size (coarse) | n1l, n2l | 30 | 30 | 30 |
| Fixed parameters: | ||||
| Orbital period (d) | period | 2.88090063 | 1.774761 | 3.88982486 |
| Primary eclipse time (HJD) | hjd0 | 2444777.4852 | 2445962.7359 | 2439340.0993 |
| Mass ratio | rm | 0.976 | 0.848 | 0.795 |
| star A (K) | tavh | 32 100 | 30 700 | 27 700 |
| star B (K) | tavh | 31 800 | 28 800 | 26 400 |
| Rotation rates | f1, f2 | 1.40, 1.33 | 1.0, 1.0 | 1.59, 2.35 |
| Gravity darkening | gr1, gr2 | 1.0, 1.0 | 1.0, 1.0 | 1.0, 1.0 |
| Bolometric albedos | alb1, alb2 | 1.0, 1.0 | 1.0, 1.0 | 1.0, 1.0 |
| Bolometric LD coeff. A | xbol1 | 0.538 | 0.552 | 0.585 |
| Bolometric LD coeff. B | xbol2 | 0.542 | 0.581 | 0.630 |
| Orbital eccentricity | e | 0.021 | 0.0 | 0.022 |
| Fitted parameters: | ||||
| Phase shift | pshift | 0.0005 | 0.0004 | 0.0365 |
| Star A potential | phsv | 4.714 | 3.867 | 4.388 |
| Star B potential | phsv | 4.718 | 4.013 | 5.629 |
| Orbital inclination (°) | xincl | |||
| Longitude of periastron (°) | perr0 | – | ||
| -band limb darkening coefficient | ldu | 0.369, 0.268 | ||
| -band limb darkening coefficient | ldu | 0.36, 0.268 | 0.369, 0.268 | |
| -band limb darkening coefficient | ldu | 0.23, 0.110 | 0.239, 0.110 | |
| -band limb darkening coefficient | ldu | 0.294, 0.302 | ||
| -band limb darkening coefficient | ldu | 0.279, 0.288 | ||
| -band limb darkening coefficient | ldu | 0.261, 0.269 | ||
| -band limb darkening coefficient | ldu | 0.242, 0.236 | ||
| -band light contributions | hlum, clum | 14.17, 5.24 | ||
| -band light contributions | hlum, clum | 5.615, 5,438 | 13.91, 5.30 | |
| -band light contributions | hlum, clum | 7.925, 7.667 | 14.00, 5.29 | |
| -band light contributions | hlum, clum | 6.369,2.544 | ||
| -band light contributions | hlum, clum | 5.815, 2.372 | ||
| -band light contributions | hlum, clum | 5.485, 3.905 | ||
| -band light contributions | hlum, clum | 8.525, 3.467 | ||
| -band third light | el3 | 0.0 | 0.019 | |
| -band third light | el3 | 0.0 | 0.0 | 0.032 |
| -band third light | el3 | 0.0 | 0.0 | 0.032 |
| -band third light | el3 | 0.0 | ||
| -band third light | el3 | 0.0 | ||
| -band third light | el3 | 0.0 | ||
| -band third light | el3 | 0.0 | ||
| Fractional radius of star A | ||||
| Fractional radius of star B |
6.2 AH Cep
AH Cep is a simpler system than V453 Cyg and V478 Cyg because it has a circular orbit. However, the eclipses are shallow and provide a poor constraint on the ratio of the radii of the stars. There is also a light-time effect due to the orbit of the distant third component, but this can trivially be accounted for by fitting the phase offset of the primary eclipse (as done in all light curve analyses presented in the current work).
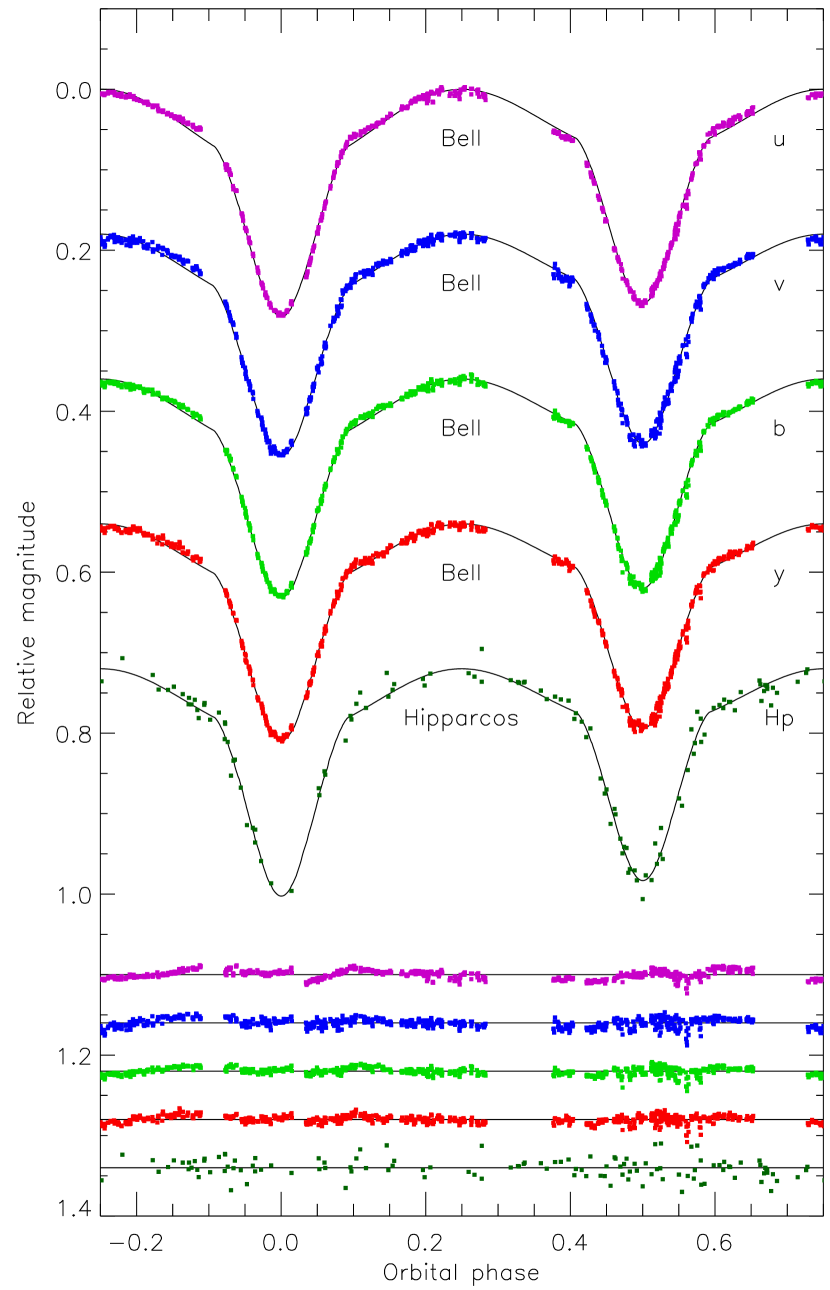
Extensive light curves in the Strömgren system were presented by Bell et al. (1986), consisting of 685 observations in each filter taken simultaneously with a Danish photoelectric photometer on the 0.75 m telescope at Observatorio del Sierra Nevada, Spain. These have complete coverage of both eclipses and partial coverage of the out-of-eclipse phases. Whilst having a low internal scatter, they suffer from systematic night-to-night offsets which are clearly visible in and but much weaker in and . Observations are also available from the Hipparcos satellite (Perryman et al., 1997), Huffer & Eggen (1947) and Nekrasova (1960) but are significantly lower in quality. We therefore base our analysis on the light curves of Bell et al. (1986), but also include the Hipparcos data in Fig. 6. Our analysis differs from those of Bell et al. (1986) and Drechsel et al. (1989) in that we conduct a more extensive error analysis via the testing of multiple alternative models.
Preliminary analyses of the light curves indicated that the radii of the stars were strongly anti-correlated, a typical occurrence for shallow partial eclipses. This is exacerbated by the need to include third light, something which we know exists because a distant third star has been detected via its orbital motion. We therefore used our spectra to obtain a constraint on the light ratio of the two eclipsing stars of , where the cooler and less massive star is the fainter of the two. The uncertainty in this measurement was determined using MCMC simulations. Our spectroscopic light ratio agrees well with the previous determination of by Petrie (1948).
We also were able to place an upper limit on the amount of third light of 2% of the total light of the system from non-detection of a third set of absorption lines in our spectra. The errorbar is conservative. This constraint is suitable only for objects showing roughly similar spectral lines to the eclipsing stars, but alternative scenarios can be ruled out on astrophysical grounds. For example, if the third component was a white dwarf it would be extremely faint (e.g. a white dwarf with a of 100,000 K would contribute approximately 0.1% of the light of the system) and could also not have formed in situ because the eclipsing stars have a much shorter evolutionary timescale than even the most massive star capable of becoming a white dwarf.
Our attempts to fit for the rotational velocities of the stars failed due to solution indeterminacy, so we quantified the uncertainty contributed by stellar rotation by running solutions differing from synchronous rotation by 5%. Similar difficulties were found when attempting to fit for LD coefficients or albedo. Our final results correspond to the best-fitting solution in the band for the measured spectroscopic light ratio and no third light (Table 5). The best fits are shown in Fig. 6. The uncertainties in , and include contributions due to the stellar rotation rates, albedo, LD, mass ratio, the uncertainty in the spectroscopic light ratio, the upper limit on the amount of third light, variation between solutions of the four light curves, and the numerical precision of the wd2004 code. All contributions were assessed individually then added in quadrature for each of the three parameters of interest.
6.3 V453 Cyg
This system shows apsidal motion so the argument of periastron was included as a fitted parameter in all solutions. The orbital eccentricity was set to the value of 0.022 found from analysis of the apsidal motion of the system by Southworth et al. (2004). We also fixed the mass ratio at the spectroscopic value of 0.795 and the s at the values found in Section 5.3.
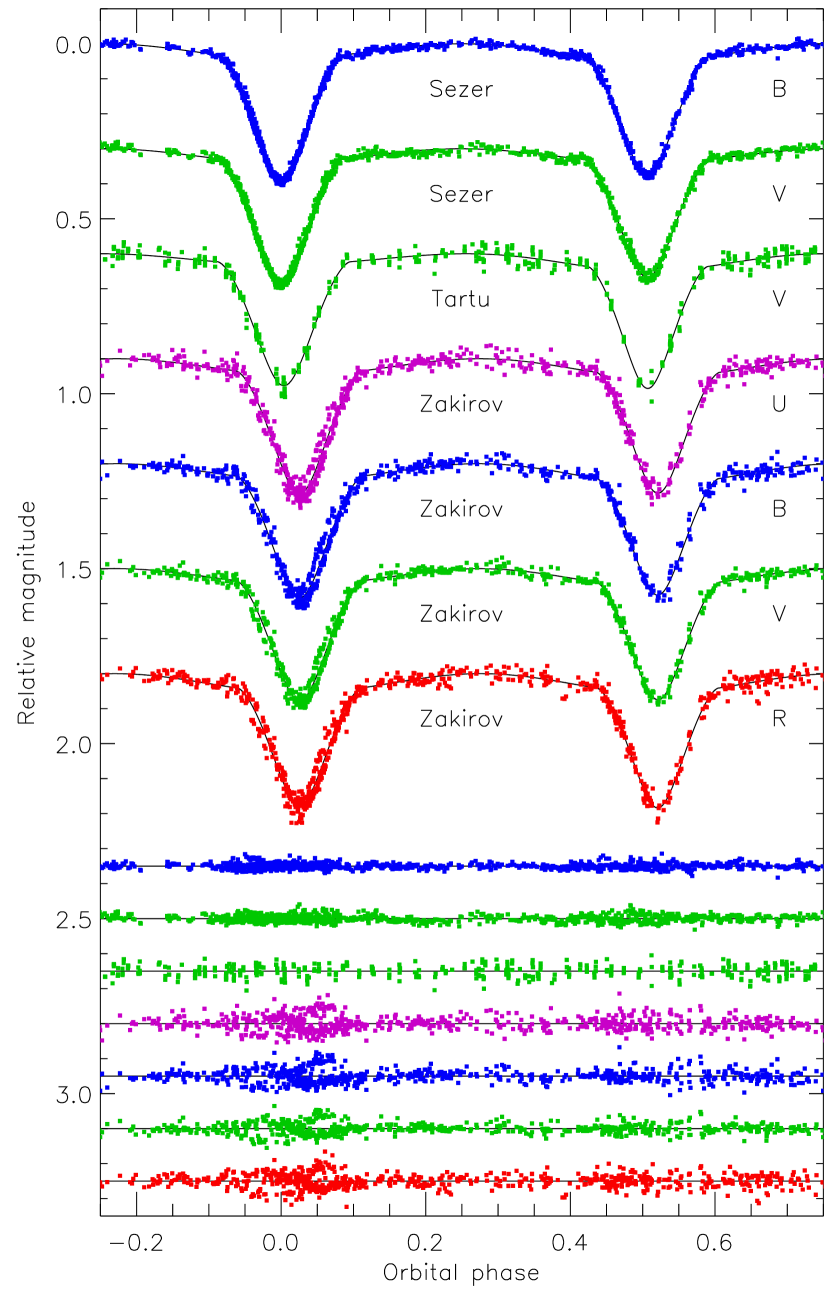
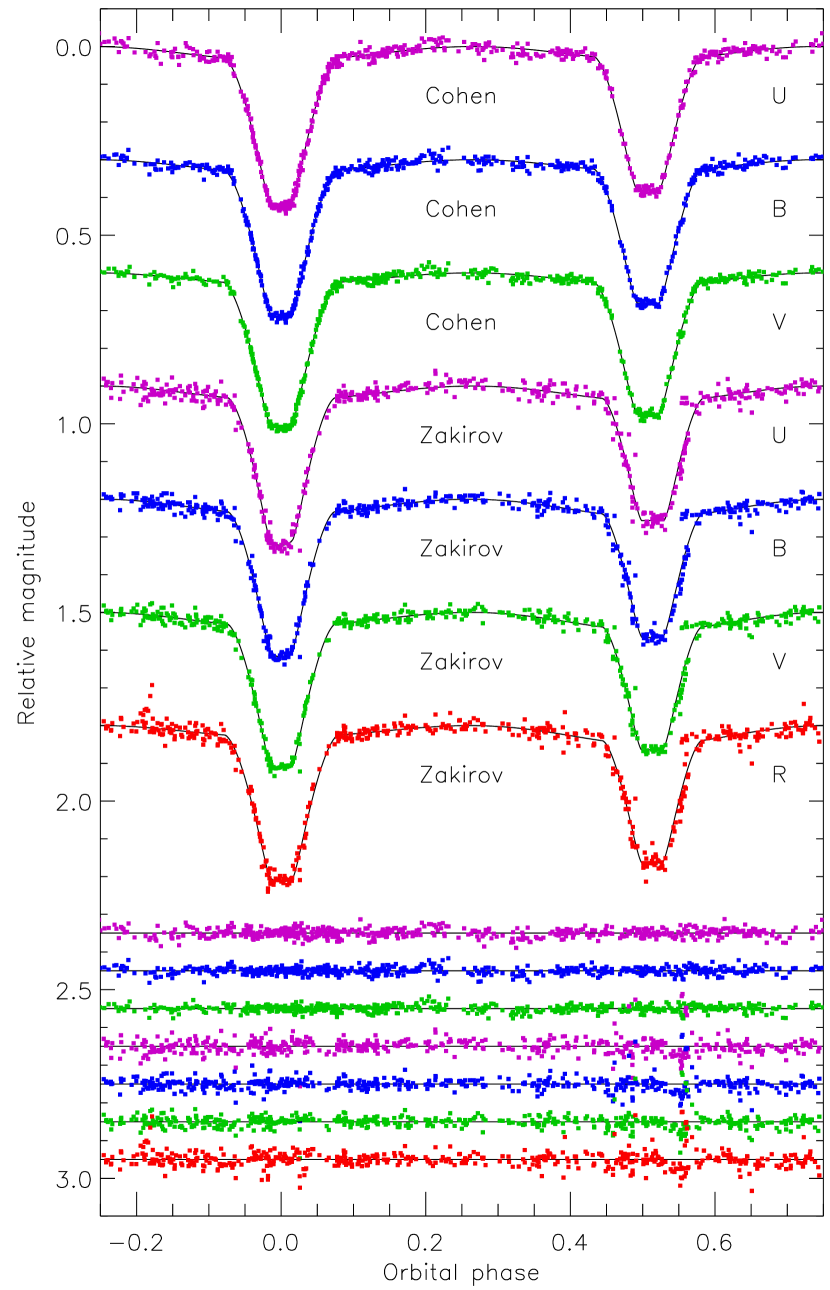
Light curves are available in the bands from Cohen (1974), totalling 531, 532 and 512 datapoints respectively. We also obtained the data from Zakirov (1992), containing 496 observations each, but find them to have a scatter higher by a factor of two, as well as a possible transcription problem around the egress of secondary eclipse. Our results are therefore based on the data from Cohen (1974).
The total eclipses mean that these light curves are rich in information, especially in the relative light contributions of the two stars in the passbands used for the observations. As with V478 Cyg, we found that the rotational velocities of the stars have a significant effect on the results, so we allowed for a deviation of 5% from the measured spectroscopic value when determining this contribution to the overall uncertainties. We find that there is a strong anticorrelation between the stellar albedos and third light, as they are both strongly related to the amplitude of the out-of-eclipse variability. The amount of third light is also correlated with the LD coefficients, so for our final result we fixed the LD coefficients at the tabulated values. The amount of third light varies between fits with different solution options calculated with wd2004, so we are not able to definitively claim its existence. Instead we suggest that it probably exists, with an upper limit of 7% on its value, and that better light curves are needed to investigate this further.
The fixed and measured properties from the best fit of the light curves are given in Table 5 and the best fits are shown in Fig. 7. Uncertainties were assessed for the orbital inclination and the fractional radii of the two stars, and were the quadrature addition of separate contributions arising from the adopted mass ratio, treatment of LD, treatment of the reflection effect, numerical precision of the wd2004 code, and the stellar rotation rates and albedos.
6.4 Physical properties
Armed with the results of both spectroscopic and photometric analyses, we have determined the physical properties of V478 Cyg, AH Cep and V453 Cyg. For this we used the velocity amplitudes and orbital eccentricities from Table 2, and the orbital inclinations and fractional stellar radii from Table 5. The calculations were performed using the jktabsdim code (Southworth et al., 2004) which propagates all uncertainties individually then adds them in quadrature to reach a final uncertainty value for each parameter. We note that the uncertainty in the masses of the components of AH Cep is dominated by the uncertainty in the orbital inclination, so obtaining better light curves of this system would also improve the mass measurement.
7 Discussion
The results of the analyses described above are summarised in Tables 3 and 4. We have achieved a high accuracy in the fundamental stellar properties, with uncertainties in the masses of 1.6–2.5% and radii of 1.0–1.9%, giving values to 0.009–0.021 dex. Having a precise allows us to avoid the degeneracy between this quantity and , which is estimated from the Balmer lines and He line ionisation balance, resulting in uncertainties of 1.7–2.5% in . Since and are the principal quantities for specifying a model atmosphere, precise values are also very helpful in measuring chemical abundances to a high precision. We now discuss the implications of our results for two subjects: evolutionary models for high-mass stars, and chemical evolution in high-mass binaries.
7.1 Evolutionary models for high-mass stars
The accuracy achieved in the measured stellar properties of our sample is high enough for a detailed comparison to the predictions of evolutionary models for high-mass stars. Moreover, determination of the photospheric abundances is a sensitive probe on internal mixing processes. Important insights on the internal structure of these stars could be gained from the analysis of apsidal motion since it was observed for three of these systems (Table 1). Additional information is available from their membership of stellar clusters.
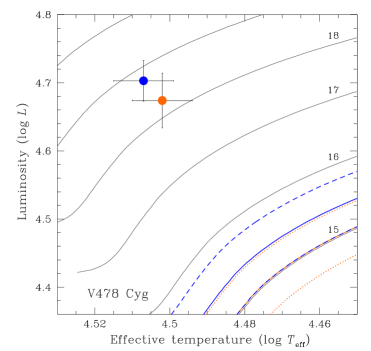
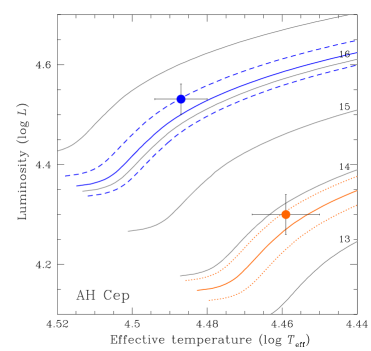
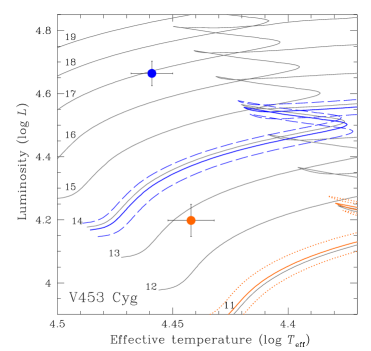
Evolutionary models for high mass stars can still have difficulty in matching observational quantities in detail. The most important stellar quantity which governs the path of stellar evolution is mass, which can be measured in a model-independent way in binary systems. Fig. 8 shows HR diagrams with the positions of the components of V478 Cyg, AH Cep and V453 Cyg relative to the predictions of the Geneva models (Ekström et al., 2012); V578 Mon is discussed by Garcia et al. (2014). The components are shown with filled circles, blue (dark grey in b&w print) for the primary, and orange (light grey) for the secondary, respectively. The theoretical evolutionary tracks are plotted in grey. The evolutionary tracks for the determined dynamical masses are shown as solid blue/orange lines, with the effect of the uncertainty in mass shown with dashed/dotted blue/orange lines, for the primary/secondary components.
It is clear that all six stars are overluminous for their mass, although the discrepancies for the components of AH Cep are within the 1 uncertainties. This effect was first found for single stars by Herrero et al. (1992), and was termed ‘mass discrepancy’. Herrero et al. (1992) determined spectrosopic masses from the surface gravities and radii of stars measured from their spectra, and found them to be significantly lower than evolutionary masses determined by fitting evolutionary tracks to the positions of the stars in the HR diagram.
Two of the best-documented binaries with evidence of a mass discrepancy are V380 Cyg (Guinan et al., 2000; Pavlovski et al., 2009; Tkachenko et al., 2014a) and V578 Mon (Hensberge et al., 2000; Garcia et al., 2014). In trying to match the observations Guinan et al. (2000) tuned the overshooting parameter in evolutionary models, and found a satisfactory fit for an extremely large overshooting. Once the rotational evolutionary tracks became available for the Geneva models (Ekström et al., 2008) a new attempt was made to match positions of the stars in the V380 Cyg system (Pavlovski et al., 2009). Rotation has almost the same effect on stellar evolutionary tracks as overshooting, making star more luminous, and extending its MS lifetime. No rotational models were found that would fit the observed properties satisfactorily. Pavlovski et al. (2009) also determined the photospheric abundances for the primary component, which did not show any peculiarities in terms of the changes in abundances of the CNO elements, as expected for rotationally-induced mixing in high mass stars (see below). This system was revisited by Tkachenko et al. (2014a), who analysed the Kepler satellite light curve plus 420 high-S/N échelle spectra. A grid of evolutionary models parametrised with the overshooting parameter and an initial rotational velocities were calculated with the mesa code (Paxton et al., 2011). Comparison of the observed properties of the binary components to a new grid of evolutionary models did not settle the mass discrepancy, showing that the theoretical models are still inadequate and lack a significant amount of near-core mixing.
The mass discrepancy for high-mass stars in binary systems is now a well-determined effect, which points to shortcomings in modern evolutionary models. The inclusion of some extra mixing into the models allows to minimise the discrepancy between the dynamical and evolutionary masses of stars but, as stressed by Tkachenko (2017), the high overshooting values appear to be inconsistent with asteroseismological values known for single stars of similar masses. As already stressed in Sect. 1 the calculations by Pedersen et al. (2018) have shown to be very promising for probing efficiency and profile of internal mixing from constraints between gravity-mode oscillations and surface abundances, in particular nitrogen contents. We postpone further discussion of this important issue for a dedicated study which will involve a sample of 12 or more well-studied binary systems (Tkachenko et al., in prep.).
7.2 Chemical evolution in high-mass binaries
The principal energy source in high-mass stars is the CNO cycle. In the beginning of the process, N is produced in the CN cycle at the expense of C. Later, when the CNO cycle reaches equilibrium, additional N is produced, at the expense of both C and O. Thus N enhancement, C depletion, or preferably the N/C abundance ratio have been recognised as sensitive indicators of the evolutionary processes in high-mass stars (Przybilla et al., 2010; Maeder et al., 2014). The photospheric chemical composition, and in particular the N overabundance, becomes a sensitive probe of mixing processes in stellar interiors. Rotation has been postulated as an efficient mechanism for enhanced mixing and transport of a processed material, with N and He enhancement, up to the stellar surface layers. Stellar evolutionary models with rotationally induced mixing predict a causal relationship between initial stellar rotational velocities and the N/C abundance ratio (Maeder & Meynet, 2000; Langer, 2012, and references therein).
In a seminal work on the CNO abundances for a large sample of Galactic OB stars Gies & Lambert (1992) revealed a variety of abundance peculiarities, including N enhancement. In a dedicated large-scale observational project using multi-object spectroscopy, OB stars in eight stellar clusters in the Galaxy, LMC and SMC, were observed (Evans et al., 2005, 2006). Studies of the N abundances for OB stars in the Galaxy and the Magellanic Clouds have become controversial since no simple and clear relationship between the N abundance and projected rotational velocity was disclosed (Hunter et al., 2008, 2009). Instead three distinctive groups of stars have been revealed (to be discussed at the end of this section).
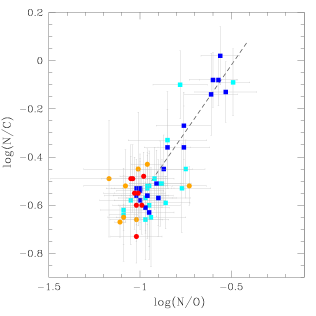
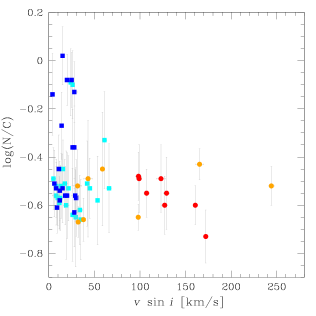
Determination of the elemental abundances for fast-rotating stars is observationally challenging. Spectral lines overlap, and fast rotation broadens and weakens them. Studies of slowly rotating early-B type stars allowed Przybilla et al. (2010) and Nieva & Przybilla (2012) to achieve much more accurate line profile measurements and also more accurate atmospheric parameter measurements through the ionisation balance for several elements. They found a tight correlation of the abundance ratios N/C versus N/O. Their finding was further strengthened in a subsequent analysis by Maeder et al. (2014), who re-examined part of an extensive vlt/flames sample. This correlation closely follows theoretical predictions due to nuclear processing in the CN branch of the CNO cycle (Przybilla et al., 2010; Maeder et al., 2014). The enhancement of the nitrogen in high-mass stars is consequence of a bottle-neck nuclear reaction chain in the CN cycle, and it happens on the expense of the carbon. On these theoretical grounds Przybilla et al. (2010) and Maeder et al. (2014) predicted the slope d(N/C)/d(N/O) = 3.77. This analytical approximation to the nuclear reactions path beginning at initial initial ratios N/C and N/O is represented by dashed line in the left panel of Fig. 9. It is obvious that abundance ratios of the CNO elements for single early-B type stars from samples of Nieva & Przybilla (2012) (solid squares in blue) and Lyubimkov et al. (2013) (solid squares in cyan) obey theoretically predicted evolutionary changes. However, the mechanism which brings nuclear-processed material to the stellar surface layers becomes more obscure because the majority of the stars examined are slow rotators (see the right panel in Fig. 9).
Proffitt et al. (2016) investigated rotationally driven mixing in high mass stars through another channel. Since boron is destoyed at much lower temperatures than needed for the CN cycle, it has diagnostic power (Fliegner et al., 1996; Frischknecht et al., 2010). HST spectroscopy of B iii lines in the UV spectral range showed boron depletion in a sample of early-B stars in the young open cluster NGC 3293, but with the efficiency at or slightly below the low end of the range predicted by rotating evolutionary models (Proffitt et al., 2016).
An important study towards the identification of possible mechanisms which enable an early change in the photospheric N abundance in high-mass stars was undertaken by Aerts et al. (2014). They collected a statistically significant sample of well-studied Galactic B-stars for which seven observables were available (surface N abundance, rotational frequency, magnetic field strength, and the amplitude and frequency of their dominant acoustic and gravity modes of oscillation). A multivariate analysis indicated that the and the frequency of the dominant acoustic oscillation mode have the most predictive power of the surface N abundance.
How do the results of our photospheric CNO abundance measurements fit in the picture outlined for single stars? An examination of the abundances for the eight high-mass stars in dEBs studied in the present work (Table 4) shows a little dispersion clustered around the initial values established for high mass stars (see Fig. 9, left panel, solid cyrcles in red). Since the dispersion of the derived abundances is small, we have calculated the mean values, also given in Table 4. Comparison to the ‘present-day cosmic’ abundances (Nieva & Przybilla, 2012) shows agreement within 1. Our sample of eight high-mass stars spans a large parameter space with the masses between 10 and 16 , s between 25 000 and 32 000 K, s from 3.7 to 4.2 dex, and values from 100 to 180 km s-1. In spite of a broad range of stellar quantities, no substantial changes which would follow expected theoretical predictions are found (the left panel of Fig. 9). This is in a plain contrast to the results found from the most accurate determination of CNO abundances for sinle early-B type stars by Nieva & Przybilla (2012) (solid blue squares in the Fig. 9), and corroborated by Lyubimkov et al. (2013) (solid cyan squres in Fig. 9). It should be noted that samples for single stars represented in Fig. 9 contain stars covering a similar parameter space. In sample of Nieva & Przybilla (2012) the masses (derived spectroscopically) are between 7 and 19 , s between 17 000 and 33 000 K, s from 3.6 to 4.3 dex, and values from 4 to 30 km s-1. Lyubimkov et al. (2013) sample comprises stars at a low end of high mass domain, and an upper part of the intermediate mass stars. The masses are between 5.5 and 11.2 , s between 15 400 and 24 000 K, s from 3.6 to 4.3 dex, and values from 5 to 66 km s-1. Both samples are biased toward low projected rotatioal velocities, more strongly for the stars in Nieva & Przybilla (2012) than Lyubimkov et al. (2013), for achieving a high accuracy in determination of the atmospheric parameters and abundances.
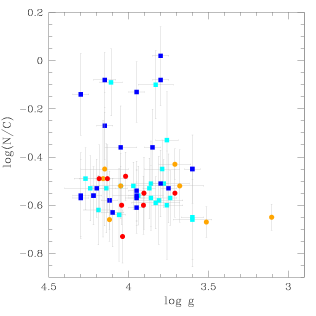
The majority of the stars in our sample are young: only V453 Cyg A is beyond the halfway point of its MS lifetime. The middle panel of Fig. 9 shows the N/C abundance ratio as a function of , the latter being a good indicator of stellar evolution. In this representation an absence of evolutionary changes of the N abundance is even more evident, in particular compared to the sample of single early B-type stars. Also, it is striking that N enhancement is present for single high mass-stars early in their MS lifetime.
Fig. 9 includes other high-mass stars in binaries (solid circles in orange): V380 Cyg (Tkachenko et al., 2014a), Sco (Tkachenko et al., 2014b), Vir (Tkachenko et al., 2016), HD 165246 (Mayer et al., 2013), and V621 Per (Southworth et al., in prep). Of particular interest are V380 Cyg A, and V621 Per A, which are evolved stars, with s of 3.1 and 3.5 dex, respectively. Despite their advance evolutionary stage, these evolved stars do not (yet) show any photospheric abundance anomalies in terms of N enhancement or C depletion. Vir A and Sco A are Cep-type pulsators, and are in an advanced stage of their MS lifetimes without any trace of changes in the CNO abundances. HD 165246 A is the most massive star in this extended sample, with , and with the highest of 230 km s-1 (Mayer et al., 2013). Recently, its oscillating nature was found by Johnston et al. (2017) using Kepler data. No outlier is seen among this group of high-mass stars, which corroborates our findings in the current work. It should be noted that the CNO abundances for these binaries are determined with the same methodology, and NLTE spectrum analysis, as performed in this work.
If rotational mixing is the main physical mechanism which brings the CNO nuclearly processed material to the stellar surface layers then the changes in the nitrogen-to-carbon ratio should grow with stellar rotational velocity. The right panel in Fig. 9 shows dependence of log(N/C) on the projected rotational velocity for single stars (squares) and binary components (circles). As noted early, the samples for single stars are biased to low for the stars in Nieva & Przybilla (2012), and up to moderate in Lyubimkov et al. (2013). Our sample is not biased to and covers binary components with from 100 to 170 km s-1(this work), and from 32 to 244 km s-1(compilation of the previous studies). Plot (the right panel in Fig. 9) is reminiscent of the diagram first presented in Hunter et al. (2008, 2009). Examing theoretically predicted dependence of the nitrogen abundance on the projected rotational velocity for OB stars, both in the Galaxy and the Magellanic Clouds, they disclosed three distinct groups: (i) stars with a low with high N abundance, (ii) fast rotators with no N enhancement, and (iii) stars which show correlation between N enrichment and the projected rotational velocity. Evidently, single B-type stars in the right panel of Fig. 9 show a large spread in the N abundance and resemble group (i) in the quoted diagram of Hunter et al. (2008, 2009). Next, the stars in binaires, with a large spread in the rotational velocities (with the inclination angle known from the light curve analysis for the stars in binaries a true rotational velocity could be calculated) occupied domain of group (ii). Not present in our plot are stars, either singles or binary components, from group (iii). The N enriched early-B type stars with high are either missing for intrinsic reason(s) in binary systems, or they are missing for single stars because of an observational bias. Still, it is not excluded some stars with low are highly rotating star seen close to pole-on. Recently progress in the measurements of CNO abundance for highly rotating stars (high ) was made (Cazorla et al., 2017a, b; Markova et al., 2018). But these new observational studies are dealing with stars in the mass range , thus higher than we are considering in the present work, hence both samples can not be directly compared. Still, it is worth mentioning that these new observational studies did not support rotational mixing as only process governing the changes in the surface chemical composition in high-mass single stars.
8 Summary and Conclusions
Our understanding of the structure and evolution of high-mass stars is still incomplete, despite intensive theoretical and observational effort. The aim of our project is to extend the number of OB binaries with precise and accurate measurements of their physical properties, to become a statistically significant sample able to provide an advance in probing the predictions of theoretical models.
We presented and analysed new high-S/N échelle spectroscopy for three OB binary systems: V478 Cyg, AH Cep and V453 Cyg. Using the method of spectral disentangling we obtained the spectroscopic orbits and individual spectra of the component stars. The spectroscopic orbits were combined with a detailed analysis of published light curves in order to determine the masses and radii of the stars. Their disentangled spectra were analysed to determine the atmospheric parameters and photospheric chemical abundances. The uncertainties in the measured masses are lower than 2.5%, in the radii below 1.9%, and in the s below 2.5%.
Accurate stellar data allows a robust testing of evolutionary models for high-mass stars. We find that no star in our sample matches the evolutionary track for its dynamically-measured mass. All stars studied have a higher luminosity than predicted for their dynamical masses, showing that the ‘mass discrepancy’ identified by Herrero et al. (1992) still exists. The deviations between the dynamical and evolutionary masses for stars in our sample range from 1% to 10%. Thus results corroborate the mass discrepancy found for single stars as well for OB binaries (see Tkachenko 2017 and references therein). The source(s) of the mass discrepancy remains hidden and absent from theoretical models. Further investigation of this problem will be found in a forthcoming study (Tkachenko et al., in preparation).
An important aspect of our work is determination of the photospheric chemical abundances of C, N, O, Mg and Si. We also included the dEB V578 Mon (Garcia et al., 2014) in this analysis, superseding our previous analysis based on more limited spectroscopic data (PH05). Similarly, our new results for V453 Cyg supersede those presented by Pavlovski & Southworth (2009), which were based on spectra of much smaller wavelength coverage.
Whilst global stellar quantities for single and binary stars share the same tendency of overluminosity or mass discrepancy, this appears not to be the case for the surface CNO abundance pattern. The CNO abundances of stars in our sample cluster around N/C and N/O (Table 4), whilst the ‘present-day cosmic standard’ values determined by Nieva & Przybilla (2012) from a sample of sharp-lined early-B stars are: N/C and N/O. The initial values for single B-stars, and for OB stars in binary systems are the same within their uncertainties. High-mass stars in binaries do not show any changes in the course of their evolution, or as a function of stellar properties (mass, , ). This result corroborates our previous abundance determinations for several OB binaries (PH05, Pavlovski & Southworth 2009; Pavlovski et al. 2009; Mayer et al. 2013; Tkachenko et al. 2014a, b, 2016). However, caution is needed since all these stars are at the low-mass end of the high-mass category, with masses 10–16. We note that Mayer et al. (2013) found no abundance anomaly for HD 165234 A, which has a mass of . Since the recent discovery of its pulsations (Johnston et al., 2017), this system is promising target for an improvement in the previous analysis, due to the synergy with asteroseismology. Recently, Martins et al. (2017) determined the CNO abundances for the binary systems DH Cep (38 and 33) and Y Cyg (16 and 17). The results for Y Cyg fall around the values we found for our sample. In the case of DH Cep, abundances are available for the secondary component only. These are N/C and N/O. The prohibitively large errors unfortunately preclude further discussion of these results.
Usually, it is taken for granted that evolution for the components in detached binaries is not affected by the presence of the companion, so is the same as for single stars, until proximity effects become important once the stars have evolved to larger radii. In the present work, we arrived at two apparently contradicitory findings: (1) the binary components also show the overluminosity found for single stars, usually referred to as the mass discrepancy; and (2) the photospheric chemical composition appears unaffected by evolution on the MS, which is different to single stars. Whilst a source of an extra luminosity for high-mass stars still should be identified and correctly accounted for in theoretical models, probably as some mechanism for causing extra mixing in stellar interiors, the second finding we reported in this work points to some (efficient) mechanism of blocking or damping diffusion of nuclear-processed material to the stellar surface. It is not surprising that the structure and evolution of stars in binaries is affected by tidal effects due to the proximity of a companion. Important issue is the fact that fundamental stellar quantities are calibrated with detached binaries. Therefore, further observational clarification of these open issues are needed, in particular with an extension to a higher mass range than covered in this work.
Acknowledgements
We thank the anonymous referee for the timely and constructive comments that have helped to improve the paper. Also, we are grateful to Kelsey Clubb for obtaining and reducing the spectra of V478 Cyg, and to Laurits Leedjärv and Mamnun Zakirov for communicating their photometric obsrvations of binaries studied in this work. KP and ET are financially supported by the Croatian Science Foundation through grant IP 2014-09-8656. We acknowledge help in the course of this work from A. Dervişoğlu, V. Kolbas and K. Tisanić.
Based on observations collected at the Centro Astronómico Hispano Alemán (CAHA) at Calar Alto, operated jointly by the Max-Planck Institut für Astronomie and the Instituto de Astrofísica de Andalucía (CSIC), and on observations made with the Nordic Optical Telescope, operated on the island of La Palma jointly by Denmark, Finland, Iceland, Norway, and Sweden, in the Spanish Observatorio del Roque de los Muchachos of the Instituto de Astrofísica de Canarias, and Lick Observatory, USA.
References
- Aerts et al. (2014) Aerts C., Molenberghs G., Kenward M.G., Neinr C., 2014, ApJ, 781, 88
- Andersen (1991) Andersen, J., 1991, A&ARv, 3, 91
- Asplund et al. (2009) Asplund M., Grevesse N., Sauval A. J., Scott, P., 2009, ARA&A, 47, 481
- Bell et al. (1986) Bell, S. A., Hilditch, R. W., Adamson, A. J., 1986, MNRAS, 223, 513
- Burkholder et al. (1997) Burkholder V., Massey P., Morrell N., 1997, ApJ, 490, 328
- Butler (1984) Butler K., 1984, PhD Thesis, University of London
- Cazorla et al. (2017a) Cazorla C., Morel T., Nazé Y., et al., 2017a, A&A, 603, A56
- Cazorla et al. (2017b) Cazorla C., Nazé Y., Morel T., et al., 2017b, A&A, 603, A56
- Charbonneau (1995) Charbonneau P., 1995, ApJS, 101, 309
- Claret & Giménez (2010) Claret A., Giménez A., 2010, A&A, 519, A57
- Cohen (1974) Cohen H. L., 1974, A&AS, 15, 181
- Drechsel et al. (1989) Drechsel H., Lorenz R., Mayer P., 1989, A&A, 221, 49
- Efron (1979) Efron B., 1979, Ann. Statistics, 7, 1
- Ekström et al. (2008) Ekström S., Meynet G., Maeder A., Barblan F., 2008, A&A, 478, 467
- Ekström et al. (2012) Ekström S., Georgy C., Eggenberger P., et al., 2012, A&A, 537, A146
- Evans et al. (2006) Evans C.J., Lennon D.J., Smartt S.J., Trundle C., 2006, A&A, 456, 623
- Evans et al. (2005) Evans C.J., Smartt S.J., Lee J.-K., et al., 2005, A&A, 437, 467
- Fitzpatrick et al. (2002) Fitzpatrick E. L., Ribas I., Guinan, E. F., DeWarf L. E., Maloney F. P., Massa D., 2002, ApJ, 564, 260
- Fliegner et al. (1996) Fliegner J., Langer N., Venn K. A., 1996, A&A, 308, L3
- Frischknecht et al. (2010) Frischknecht U., Hirschi R., Meynet G., et al., 2010, A&A, 522, A39
- Garcia et al. (2011) Garcia E. V., Stassun K. G., Hebb L., Gómez Maqueo Chew Y., Heiser A., 2011, AJ, 142, 27
- Garcia et al. (2014) Garcia E. V., Stassun K. G., Pavlovski K., Hensberge H., Gómez Maqueo Chew Y., Claret A., 2014, AJ, 148, 39
- Garland et al. (2017) Garland R., Dufton P. L., Evans C. J., et al., 2017, A&A,
- Gies & Lambert (1992) Gies D. R., Lambert D. L., 1992, ApJ, 387, 673
- Giddings (1981) Giddings J., 1981, PhD Thesis, University of London
- Guinan et al. (2000) Guinan E. F., Ribas I., Fitzpatrick E. L., et al., 2000, ApJ, 544, 409
- Hadrava (1995) Hadrava P., 1995, A&AS, 114, 393
- Harvig (1990) Harvig V., 1990, Publ. Tartu Observatory, 53, 115
- Heiser (1977) Heiser A. M., 1977, AJ, 82, 973
- Hensberge & Pavlovki (2007) Hensberge H., Pavlovski K., 2007, in Hartkopf W. I., Guinan, E. F., Harmanec, P., eds., Proc. IAU Symp. 240, Binary Stars as Critical Tools & Tests in Contemporary Astrophysics, Cambridge Univ. Press, p. 136
- Hensberge et al. (2008) Hensberge H., Ilijić S., Torres K. B. V., 2008, A&A, 482, 1031
- Hensberge et al. (2000) Hensberge H., Pavlovski K., Verschueren W., 2000, A&A, 358, 553
- Herrero et al. (1992) Herrero, A., Kudritzki R. P., Vilchez J. M., 1992, A&A, 261, 209
- Hilditch (2000) Hilditch, R. W., 2000, Close Binary Stars, Cambridge University Press
- Hilditch (2004) Hilditch, R. W., 2004, Hilditch R. W., Hensberge H., Pavlovski K., eds, ASP Conf. Ser. Vol. 318, Spectroscopically and Spatially Resolving the Components of Close Binary Stars, Astron. Soc. Pac., San Francisco, p. 3
- Holmgren et al. (1990) Holmgren D. E., Hill G., Fischer W., 1990, A&A, 236, 409
- Huffer & Eggen (1947) Huffer C. M., Eggen O. J., 1947, ApJ, 106, 313
- Hunter et al. (2008) Hunter I., Brott I., Lennon D. J., et al., 2008, ApJ, 676, L29
- Hunter et al. (2009) Hunter I., Brott I., Langer N., et al., 2009, A&A, 496, 841
- Ignace et al. (2017) Ignace R., Hole K.T., Oskinova L.M., Rotter J.P., 2017, ApJ, 850, 82
- Ilijić et al. (2004) Ilijić S., Hensberge H., Pavlovski K., Freyhammer L. M., 2004, in Hilditch R. W., Hensberge H., Pavlovski K., eds, ASP Conf. Ser. Vol. 318, Spectroscopically and Spatially Resolving the Components of Close Binary Stars, Astron. Soc. Pac., San Francisco, p. 111
- Ivezić et al. (2014) Ivezić Ž., Connolly A.J., VanderPlas J.T., Gray A., 2014, Statistics, Data Mining, and Machine Larning in Astronomy, Princeton University Press
- Johnston et al. (2017) Johnston C., Buysschaert B., Tkachenko A., Aerts C., Neiner C., 2017, MNRAS, 469, L118
- Kim et al. (2005) Kim C.-H., Nha I.-S., Kreiner J. M., 2005, AJ, 129, 990
- Kolbas et al. (2014) Kolbas V., Dervişoǧlu A., Pavlovski K., Southworth J., 2014, MNRAS, 444, 3118
- Kolbas et al. (2014) Kolbas V., Pavlovski K., Southworth J., et al., 2015, MNRAS, 451, 4150
- Kurucz (1979) Kurucz, R. L., 1979, ApJS, 40, 1
- Langer (2012) Langer N., 2012, ARA&A, 50, 107
- Lanz & Hubeny (2003) Lanz T., Hubeny I., 2003, ApJS, 146, 417
- Lanz & Hubeny (2007) Lanz T., Hubeny I., 2007, ApJS, 169, 83
- Lastennet & Valls-Gabaud (2002) Lastennet E., Valls-Gabaud D., 2002, A&A, 396, 551
- Laur et al. (2017) Laur J., Kolka I., Eenmäe T., Tuvikene T., Leedjärv L., 2017, A&A, 598, A108
- Lupton (1993) Lupton R., 1993, Statistics in Theory and Practise, Princeton University Press
- Lyubimkov et al. (2013) Lyubimkov L. S., Lambert D. L., Poklad D. B., Rachkovskaya T. M., Rostopchin S. I., 2013, MNRAS, 428, 3497
- Lyubimkov et al. (2005) Lyubimkov L. S., Rostopchin S. I., Lambert D. L., Rachkovskaya T. M., Poklad D. B., Lambert D. L., 2005, MNRAS, 358, 193
- Maeder & Meynet (2000) Maeder A., Meynet G., 2000, ARA&A, 38, 143
- Maeder et al. (2014) Maeder A., Przybilla N., Nieva M.-F., Georgy C., Meynet G., Ekström S., Eggenberger P., 2014, A&A, 565, A39
- Markova et al. (2018) Markova N., Puls J., Langer N., 2018, A&A, 613, A12
- Martins et al. (2017) Martins F., Mahy L., Hervé A., 2017, A&A, 607, A82
- Mayer & Drechsel (1987) Mayer P., Drechsel H., 1987, A&A, 183, 61
- Mayer & Wolf (1986) Mayer P., Wolf M., 1986, Inf. Bull. Var. Stars No. 2886
- Mayer et al. (2013) Mayer P., Harmanec P., Pavlovski K., 2013, A&A, 550, A2
- Mossakovskaya & Khaliullin (1996) Mossakovskaya L. V., Khaliullin K. F., 1996, Astronomy Letters, 22, 132
- Nekrasova (1960) Nekrasova S. V., 1960, Peremennye Zvezdy, 13, 157
- Nieva & Przybilla (2007) Nieva M. F., Przybilla N., 2007, A&A, 467, 295
- Nieva & Przybilla (2012) Nieva M. F., Przybilla N., 2012, A&A, 539, A143
- Pavlovski & Hensberge (2005) Pavlovski K., Hensberge H., 2005, A&A, 439, 309 (PH05)
- Pavlovski & Hensberge (2010) Pavlovski K., Hensberge H., 2010, in Prša A., Zejda M., eds, ASP Conf. Ser. Vol. 435, Binaries - Key to Comprehension of the Universe. Astron. Soc. Pac., San Francisco, p. 207
- Pavlovski & Southworth (2009) Pavlovski K., Southworth J., 2009, MNRAS, 394, 1519
- Pavlovski & Southworth (2012) Pavlovski K., Southworth J., 2012, in Richards M.T., Hubeny I., eds, Proc. IAU Symp. 282, From Interacting Binaries to Exoplanets: Essential Modeling Tools, Cambridge Univ. Press, Cambridge, p. 359
- Pavlovski et al. (2009) Pavlovski K., Tamajo E., Koubský P., Southworth J., Yang S., Kolbas V., 2009, MNRAS, 400, 791
- Paxton et al. (2011) Paxton B., Bildstein L., Dotter A., Herwig F., Lesaffre P., Timmes F., 2011, ApJS, 192, 3
- Pedersen et al. (2018) Pedersen M. G., Aerts C., Pápics P. L., Rogers T. M., 2018, A&A, 614, A128
- Perryman et al. (1997) Perryman, M. A. C., Lindegren, L., Kovalevsky, J., et al., 1997, A&A, 323, L49
- Petrie (1948) Petrie R. M., 1948, Harvard Observatory Monographs, 7, 231
- Pfeiffer et al. (1998) Pfeiffer M. J., Frank C., Baumueller D., Fuhrmann K., Gehren T., 1998, A&AS, 130, 381
- Pols et al. (1997) Pols O. R., Tout C. A., Schroder K.-P., Eggleton P. P., Manners J., 1997, MNRAS, 289, 869
- Popper & Dumont (1977) Popper D. M., Dumont P. J., 1977, AJ, 82, 216
- Popper & Etzel (1981) Popper D. M., Etzel P. B., 1981, AJ, 86, 102
- Popper & Hill (1981) Popper D. M., Hill G., 1991, AJ, 101, 600
- Press et al. (1992) Press, W. H. and Teukolsky, S. A., Vetterling, W. T. and Flannery, B. P., 1992, Numerical Recipes in FORTRAN 77. The art of scientific computing, Cambridge University Press, Cambridge, UK
- Proffitt et al. (2016) Proffitt C. R., Lennon D. J., Langer N., Brott I., 2016, ApJ, 824, 3
- Przybilla et al. (2010) Przybilla N., Firnstein M., Nieva M. F., Meynet G., Maeder A., 2010, A&A, 517, A38
- Raskin et al. (2011) Raskin G., van Winckel H., Hensberge, H., et al., 2011, A&A, 526, A69
- Román-Zúñiga & Lada (2008) Román-Zúñiga C.G., Lada E.A., 2008, Handbook of Star Forming Regions, Volume I: The Northern Sky, Ed. B. Reipurth, ASP Monograph Publications, Vol. 4, 928
- Sezer et al. (1983) Sezer C., Güdür N., Gülmen Ö., Şengonca H., 1983, A&AS, 53, 363
- Simon & Sturm (1994) Simon K. P., Sturm E., 1994, A&A, 281, 286
- Simón-Díaz (2010) Simón-Díaz S., 2010, A&A, 510, A22
- Southworth (2015) Southworth J., 2015, in Rucinski, S. M., Torres, G., and Zejda, M., eds., ASP Conf. Ser. 496, Living Together: Planets, Host Stars and Binaries, p. 164
- Southworth & Clausen (2007) Southworth J., Clausen J. V., 2007, A&A, 461, 1077
- Southworth et al. (2004) Southworth J., Maxted P. F. L., Smalley B., 2004, MNRAS, 351, 1277
- Southworth et al. (2004) Southworth J., Maxted P. F. L., Smalley B., 2005, A&A, 429, 645
- Southworth et al. (2011) Southworth J., Zima W., Aerts C., et al., 2011, MNRAS, 414, 2413
- Tamajo et al. (2011) Tamajo E., Pavlovski K., Southworth J., 2011, A&A, 526, A76
- Telting et al. (2014) Telting J.H., Avila G., Buchhave L., 2014, Astronomische Nachrichten, 335, 41
- Tkachenko (2017) Tkachenko A., 2017, EPJ Web of Conference, 160, 05007
- Tkachenko et al. (2012) Tkachenko A., Aerts C., Pavlovski K., et al., 2012, MNRAS, 424, L21
- Tkachenko et al. (2014b) Tkachenko A., Aerts C., Pavlovski K., et al., 2014b, MNRAS, 442, 616
- Tkachenko et al. (2014a) Tkachenko A., Degroote P., Aerts C., et al., 2014a, MNRAS, 438, 3093
- Tkachenko et al. (2016) Tkachenko A., Matthews J. M., Aerts C., et al., 2016, MNRAS, 458, 1964
- Torres et al. (2010) Torres G., Andersen J., Giménez A., A&ARv, 18, 67
- Tukey (1958) Tukey J.W., 1958, Annals of Mathematical Statistics, 29, 614
- Van Hamme (1993) Van Hamme W., 1993, AJ, 106, 2096
- Vogt (1987) Vogt S. S., 1987, PASP, 99, 1214
- Vrancken et al. (1998) Vrancken M., Hensberge H., David M., Verschueren W., 1997, A&A, 320, 892
- Wang et al. (2008) Wang J., Townsley L. K., Feigelson E. D., Broos, P. S., Getman K. V., Román-Zúñiga C. G., Lada E., 2008, ApJ, 675, 464
- Wilson (1979) Wilson R. E., 1979, ApJ, 234, 1054
- Wilson & Devinney (1971) Wilson R. E., Devinney E. J., 1971, ApJ, 166, 605
- Wilson & Van Hamme (2004) Wilson R. E., Van Hamme W., 2004, Computing Binary Star Observables
- Wolf et al. (2006) Wolf M., Kučáková H., Kolasa M., et al., 2006, A&A, 456, 1077
- Zakirov (1990) Zakirov M. M., 1990, Kinematika i Fizika Nebesnykh Tel, 6, 42
- Zakirov (1992) Zakirov M. M., 1992, Kinematika i Fizika Nebesnykh Tel, 8, 38
- Zakirov (1993) Zakirov M. M., 1993, Kinematika i Fizika Nebesnykh Tel, 9, 47