Measuring the Hubble constant and spatial curvature from supernova apparent magnitude, baryon acoustic oscillation, and Hubble parameter data
Abstract
Cosmic microwave background (CMB) anisotropy (spatial inhomogeneity) data provide the tightest constraints on the Hubble constant, matter density, spatial curvature, and dark energy dynamics. Other data, sensitive to the evolution of only the spatially homogeneous part of the cosmological model, such as Type Ia supernova apparent magnitude, baryon acoustic oscillation distance, and Hubble parameter measurements, can be used in conjunction with the CMB data to more tightly constrain parameters. Recent joint analyses of CMB and such non-CMB data indicate that slightly closed spatial hypersurfaces are favored in nonflat untilted inflation models and that dark energy dynamics cannot be ruled out, and favor a smaller Hubble constant. We show that the constraints that follow from these non-CMB data alone are consistent with those that follow from the CMB data alone and so also consistent with, but weaker than, those that follow from the joint analyses of the CMB and non-CMB data.
Subject headings:
cosmological parameters — large-scale structure of universe — observations — methods:statistical1. Introduction
Establishing an accurate cosmological model that is consistent with observations is one of the primary goals of cosmology. Currently the spatially flat CDM world model is considered to be the standard cosmological model (Peebles, 1984). In this model the current energy budget is dominated by the cosmological constant with nonrelativistic cold dark matter (CDM) being the second biggest contributor. The former is responsible for the accelerated cosmological expansion at the present epoch, and the latter for initiating large-scale cosmological structure formation, and, along with nonrelativistic baryonic matter, for the earlier decelerated cosmological expansion.
The spatially flat CDM model is consistent with the cosmic microwave background (CMB) anisotropy (Planck Collaboration, 2016, 2018), Type Ia supernova apparent brightness (Scolnic et al., 2018), baryonic acoustic oscillation distance (Alam et al., 2017), and Hubble parameter (Farooq et al., 2017)111Hubble parameter measurements provide evidence for the earlier nonrelativistic matter dominated cosmological expansion as well as the current dark energy powered accelerating cosmological expansion (Farooq & Ratra, 2013; Farooq et al., 2013; Capozziello et al., 2014; Moresco et al., 2016; Farooq et al., 2017; Yu et al., 2018; Jesus et al., 2018; Haridasu et al., 2018b). measurements. While CMB anisotropy data most tightly constrain cosmological models, at present no single kind of cosmological data is that restrictive, and it is the combination of CMB and non-CMB data that results in powerful constraints (and breaks some of the degeneracy between correlated parameters).
Though the standard CDM model assumes flat spatial hypersurfaces and a constant dark energy density, current observations do not require either. To include nonzero spatial curvature in the analysis of CMB (and other spatial inhomogeneity) data requires the use of a nonflat inflation model to generate a physically consistent power spectrum of spatial inhomogeneities (as touched upon below and elsewhere; this has previously been ignored, resulting in invalid constraints on spatial curvature based on physically inconsistent power spectra). As an alternative to the constant dark energy density of CDM model, the XCDM model is based on a simple and widely used dynamical dark energy parameterization. In this model, the ratio of dark energy pressure and density — the equation of state parameter () — is constant. However, XCDM is not able to consistently describe the evolution of density inhomogeneities and so is not physically consistent. The CDM model is a physically consistent dynamical dark energy model based on the evolution of a scalar field (Peebles & Ratra, 1988; Ratra & Peebles, 1988).222For earlier discussions of cosmological constraints on the CDM model see Samushia et al. (2007), Yashar et al. (2009), Samushia & Ratra (2010), Chen & Ratra (2011b), Campanelli et al. (2012), Avsajanishvili et al. (2015), Solà et al. (2017a), Solà et al. (2017b), Zhai et al. (2017), Sangwan et al. (2018), and references therein.
Recently, Ooba et al. (2018a, b, c, d) and Park & Ratra (2018a, b, c) reported that compilations of Planck 2015 CMB anisotropy data (Planck Collaboration, 2016) and non-CMB data favor slightly closed spatial hypersurfaces in the nonflat CDM, XCDM, and CDM dark energy untilted inflation models, and noted that a dynamical dark energy density that varies both temporally and spatially cannot be ruled out.333This result differs from the Planck Collaboration (2016, 2018) finding. As mentioned above, and discussed in detail elsewhere, the Planck analyses used a physically inconsistent power spectrum for energy density inhomogeneities, a physically inconsistent generalization of the nonflat untilted inflation model (Gott, 1982; Hawking, 1984; Ratra, 1985) energy density inhomogeneity power spectrum (Ratra & Peebles, 1995; Ratra, 2017).
Most studies concentrate on using the most recent compilation of CMB and non-CMB data to estimate the cosmological parameters as precisely as possible. Here we want to examine the constraints on cosmological parameters that follow from the non-CMB observations alone, to avoid having to assume an energy density inhomogeneity power spectrum, and to examine whether the non-CMB data constraints are consistent with the CMB ones. In this paper, we constrain the flat and nonflat CDM, XCDM, and CDM dark energy models using an up-to-date collection of non-CMB data sets to constrain the spatially homogeneous cosmological models. We use Type Ia supernova apparent magnitude, baryon acoustic oscillation distance, and Hubble parameter data to measure the matter density, Hubble constant, spatial curvature, and parameters characterizing dark energy dynamics. We find that the conclusions obtained by jointly using CMB and non-CMB data sets, that favor slightly closed spatial hypersurfaces and a slightly smaller Hubble constant, and allow for mild dark energy dynamics, also hold for the non-CMB data, but with lower statistical significance.444We emphasize that these results refer to the cosmological parameter constraints, not to the goodness-of-fit of the best-fit set of cosmological parameters to the measurements. We find that the non-CMB data compilation we use here does not significantly distinguish between any of the best-fit models on the basis of goodness-of-fit. When the CMB data are included in the mix we are unable to quantitatively determine the goodness-of-fit of the best-fit set of cosmological parameters to the measurements. This is in part due to the ambiguity in the number of degrees of freedom of the Planck CMB data (see discussion in Ooba et al., 2018a, b, c, d; Park & Ratra, 2018a, b, c). We also emphasize that qualitatively the slightly closed models better fit the lower multipole number CMB temperature anisotropy data and the weak lensing constraints on density inhomogeneities (DES Collaboration, 2018) while the flat models better fit the higher multipole number CMB temperature anisotropy data and the observed deuterium abundances (Penton et al., 2018).
In Sec. 2 the non-CMB data sets used in our analysis are briefly summarized. In Sec. 3 we summarize our analysis methods that use the flat and nonflat CDM, XCDM, and CDM models. The observational constraints on the parameters of the six cosmological models are presented in Sec. 4. We summarize our results in Sec. 5.
2. Data
We use Type Ia supernova apparent magnitude (SN), baryon acoustic oscillation distance (BAO), and Hubble parameter [] measurements to constrain the flat and nonflat CDM, XCDM, and CDM models.
We use the most recent SN data compilation, the Pantheon collection of 1048 Type Ia supernova apparent magnitude measurements over a redshift range of (Scolnic et al., 2018). This data set is a combination of Type Ia supernovae discovered by the Pan-STARRS1 Medium Deep Survey, the Sloan Digital Sky Survey, and the Supernova Legacy Survey, together with low- and Hubble Space Telescope SN samples. In our analyses here we account for the statistical and systematic uncertainties in the Pantheon measurements.
We use a compilation of BAO data from Alam et al. (2017), Beutler et al. (2011), Ross et al. (2015), Ata et al. (2018), Bautista et al. (2017), and Font-Ribera et al. (2014), which is summarized in Table 1. Here is the comoving distance at redshift , , , , is the radius of the sound horizon at the drag epoch , and is the speed of light (see Sec. 2.3 of Park & Ratra 2018a). Although Table 1 here is similar to Table 1 of Park & Ratra (2018a), here we exclude the growth rate () points from the Baryon Oscillation Spectroscopy Survey (BOSS) DR12 data (Alam et al., 2017). Since we exclude these points, the DR12 covariance matrix between measurement errors (Alam et al., 2017) we use here is
| (1) |
As in Park & Ratra (2018b, c) we also use the updated BAO data point of Ata et al. (2018). In actual parameter estimation we use the probability distributions of the BAO data points of Ross et al. (2015) and Font-Ribera et al. (2014), instead of the approximate Gaussian constraints shown in Table 1. See Sec. 2.3 of Park & Ratra (2018a) for more details about our procedure.
| Measurement | Reference | |
| [Mpc] | [1] | |
| [km s-1 Mpc-1] | [1] | |
| [Mpc] | [1] | |
| [km s-1 Mpc-1] | [1] | |
| [Mpc] | [1] | |
| [km s-1 Mpc-1] | [1] | |
| [2] | ||
| [Mpc] | [3] | |
| [Mpc] | [4] | |
| [5] | ||
| [6] | ||
| [6] |
References: [1] Alam et al. (2017), [2] Beutler et al. (2011), [3] Ross et al. (2015), [4] Ata et al. (2018), [5] Bautista et al. (2017), [6] Font-Ribera et al. (2014). Note: The sound horizon size (at the drag epoch) of the fiducial model is in Alam et al. (2017) and Ata et al. (2018), and in Ross et al. (2015).
3. Methods
We measure the parameters of the flat and nonflat CDM, XCDM, and CDM models by comparing model predictions with the observed SN apparent magnitudes, BAO distances, and Hubble parameters over a large range of redshift.
The evolution of the spatially homogeneous background in the CDM and XCDM models is usually described by the evolution of the Hubble parameter. For the nonrelativistic matter and dark energy dominated epochs, the Hubble parameter as a function of the scale factor (normalized to be unity now) is
| (2) |
for the CDM model, and
| (3) |
for the XCDM parameterization. Here is the Hubble constant, the nonrelativistic matter density parameter present value is the sum of present baryonic matter and CDM density parameters, , is the present value of the spatial curvature density parameter, and and are the present values of the dark energy density parameters in the CDM and XCDM models, respectively. In the limit the XCDM dark energy becomes the cosmological constant .
In the CDM model we consider a minimally coupled dark energy scalar field with an inverse power-law potential energy density
| (4) |
where is a positive constant parameter and is determined in terms of (Peebles & Ratra, 1988). In the limit the scalar field dark energy becomes the cosmological constant .
For the background evolution of the CDM model in the nonrelativistic matter and scalar field dominated epochs we use
| (5) |
where the evolution of the dark energy scalar field is governed by the equation of motion
| (6) |
Here , , , , , and an overdot denotes the time derivative . We have chosen units such that the Newtonian gravitational constant . We use the initial conditions of Peebles & Ratra (1988) at scale factor . This places the homogeneous background scalar field on the attractor/tracker solution (Peebles & Ratra, 1988; Ratra & Peebles, 1988; Pavlov et al., 2013). For a given set of cosmological parameters and initial conditions for the scalar field, we numerically determine the value of to satisfy the condition at the present epoch (when ). The current value of the dark energy density parameter is , where and are the current values of and .
The version of Eqs. (2)–(6) we use in the actual computations also take into account the contribution of photons and massless and massive neutrinos. We assume that the present CMB temperature , that the effective number of neutrino species , and one massive neutrino species (with mass ).
To obtain the likelihood distributions of the cosmological parameters, we use the Markov chain Monte Carlo (MCMC) method that randomly explores the parameter space based on the probability function , where and denote model and data, respectively, and is the sum of individual contributions from the SN, BAO, and data. When comparing the Pantheon SN apparent magnitude data with model predictions we use the defined in Appendix C (Eq. C1) of Conley et al. (2011). The SN covariance matrix is the sum of the diagonal statistical uncertainty covariance matrix, , and the systematic uncertainty covariance matrix, : . For the BAO data, is the sum of contributions from each BAO measurement. For example for the BOSS DR12 BAO data we have where is a vector whose elements are the differences between model predictions and data points (the first six entries in Table 1). For Hubble parameter data, .
We constrain the flat CDM model with three cosmological parameters (, , ) and the nonflat CDM model with four parameters (, , , ), where km s-1 Mpc-1). We add one more free parameter, the equation of state parameter for the XCDM parameterization, and the scalar field potential parameter for the CDM model.555 Although we use the parameter , the approximate angular size of the sound horizon at recombination (Planck Collaboration, 2014), instead of in our CDM and XCDM model analyses, we instead record the derived as one of the main cosmological parameters for these models. For the CDM model, however, (not ) is the active parameter in the MCMC analysis.
We modified the publicly available CAMB/COSMOMC package (version of November 2016, Challinor & Lasenby 1999; Lewis et al. 2000; Lewis & Bridle 2002) to constrain the flat and nonflat CDM, XCDM, and CDM models, at the spatially homogeneous background level, by using the SN+, SN+BAO, BAO+, and SN+BAO+ data combinations. For the SN+ data combination, the model predictions are not sensitive to baryonic density parameter variations. In this case is not constrained but instead taken to be , the best-fit value of the flat CDM model constrained using Planck 2015 TT + lowP + lensing CMB data (Planck Collaboration, 2016). In our analyses here we assume flat priors nonzero over , , , , , and .
4. Observational Constraints
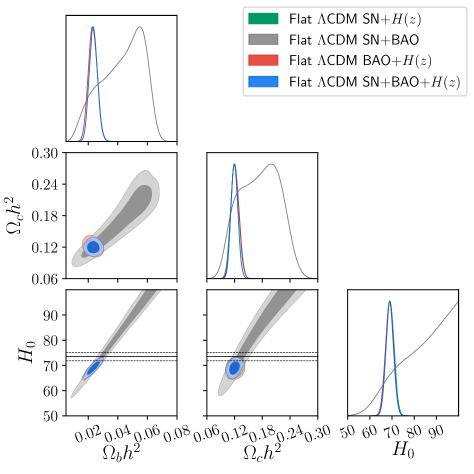
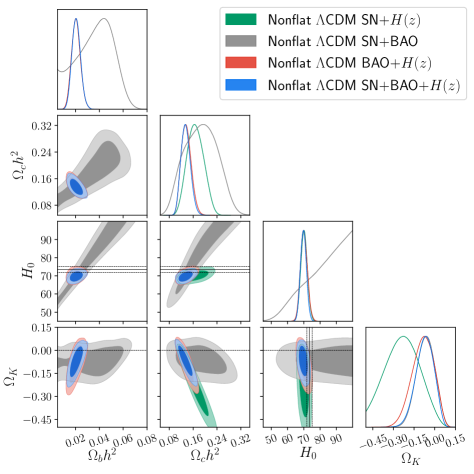
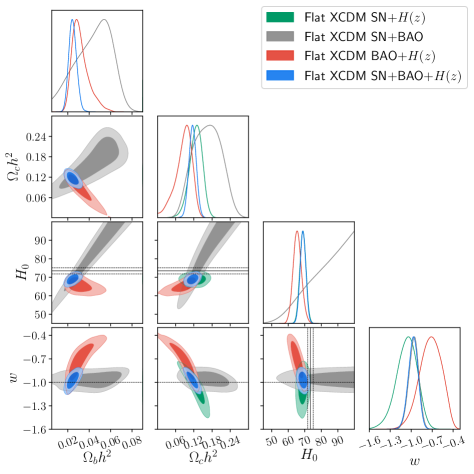
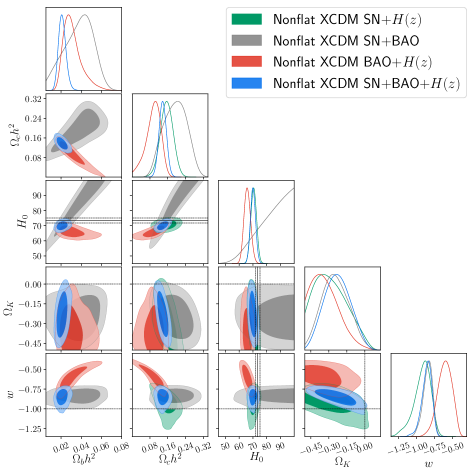
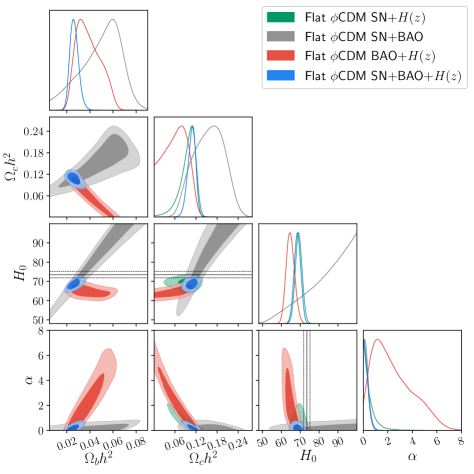
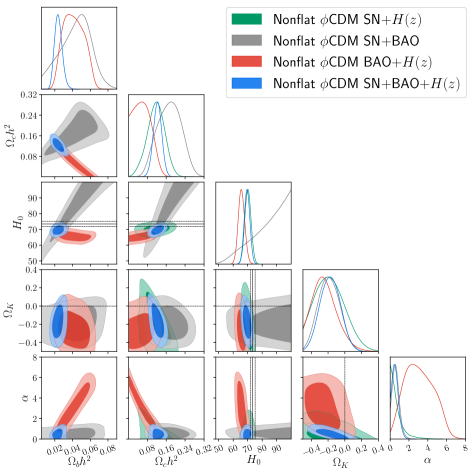
Figures 1–3 show the likelihood distributions of model parameters of flat and nonflat CDM, XCDM, and CDM models, respectively. The mean and 68.3% confidence limits (or 95.4% upper limits) are summarized in Table 2.
The SN+BAO data do not tightly constrain , , and especially not , in the flat and nonflat CDM, XCDM, and CDM models. However, the SN+BAO data provide the most restrictive constraints on the dynamical dark energy parameters and in the XCDM and CDM models.
The results obtained using BAO+ data are interesting. The Hubble constant measured using the flat and nonflat XCDM and CDM models are lower than the recent local measurement of km s-1 Mpc-1 (Riess et al., 2018) by between 2.6 and 3.1 (of the quadrature sum of the two error bars), while in the flat (nonflat) CDM model it is lower by 1.9 (1.3). In the nonflat XCDM parameterization, the BAO+ data strongly favor dark energy dynamics with deviating from towards by . For the XCDM parameterization and the full SN+BAO+ data set, the equation of state parameter in the flat model is measured to be consistent with that of the cosmological constant () while it deviates from by in the nonflat case, which is still significant though smaller than the of the BAO+ case. In the nonflat CDM model, the BAO+ data constraint also favors dark energy dynamics with (a deviation from ), but for the SN+BAO+ data combination is consistent with zero and a cosmological constant. We note that in the nonflat CDM model the CMB data alone (without lensing data) cannot tightly constrain , allowing large (Park & Ratra, 2018c), while even the least effective combination for this here, BAO+, is able to bound , see the bottom subpanel row in the right panel of Fig. 3.
For the full SN+BAO+ data combination, closed spatial hypersurfaces are favored at 1.1, 2.1, and 1.4 significance in the nonflat CDM, XCDM, and CDM models. The Planck 2015 CMB anisotropy measurements (Planck Collaboration, 2016) also favor closed spatial hypersurfaces (Ooba et al., 2018a, b, c), at 1.8, 1.1, and 1.8 in the CDM, XCDM, and CDM untilted nonflat inflation cases, and when combined with the SN+BAO+ data, as well as with growth factor () observations, they favor closed hypersurfaces at 5.2, 3.4, and 3.1 significance, respectively (Park & Ratra, 2018a, b, c). It is interesting, and possibly significant, that in Table 2 all three pairs of data combinations, SN+, SN+BAO, and BAO+, also favor closed geometries in the nonflat models, at between 1.0 and 2.9.666For earlier discussions of constraints on spatial curvature, see Farooq et al. (2015), Chen et al. (2016), Yu & Wang (2016), L’Huillier & Shafieloo (2017), Farooq et al. (2017), Wei & Wu (2017), Rana et al. (2017), Yu et al. (2018), Mitra et al. (2018, 2019), and Ryan et al. (2018, 2019).
Using the SN+BAO+ combination, is measured to be (), (), and () km s-1 Mpc-1 for the flat (nonflat) CDM, XCDM, and CDM models, respectively, These are all very mutually consistent and are also consistent with the most recent median statistics estimate of km s-1 Mpc-1 (Chen & Ratra, 2011a), which is very consistent with earlier estimates based on median statistics (Gott et al., 2001; Chen et al., 2003).777The estimates here are consistent with many recent estimates based on non-CMB data (L’Huillier & Shafieloo, 2017; Chen et al., 2017; Wang et al., 2017; Lin & Ishak, 2017; DES Collaboration, 2017; Yu et al., 2018; Haridasu et al., 2018a; Zhang et al., 2018; Gómez-Valent & Amendola, 2018; Haridasu et al., 2018b; da Silva & Cavalcanti, 2018; Zhang, 2018) as well as with those from CMB data (Planck Collaboration, 2018; Park & Ratra, 2018a, b, c). However, these values are a little lower than the recent local expansion rate measurement of km s-1 Mpc-1 (Riess et al., 2018)888Other local expansion rate measurements find slightly lower values and slightly larger error bars (Rigault et al., 2015; Zhang et al., 2017; Dhawan et al., 2017; Fernández Arenas et al., 2018); also see Roman et al. (2017), Kim et al. (2018), and Jones et al. (2018). by between 1.9 and 2.0 for the flat models and between 1.3 and 1.5 for the nonflat models (of the quadrature sum of the two error bars, in both cases), less discrepant than when the CMB anisotropy data is included in the mix (Park & Ratra, 2018a, b, c).
It is also interesting to see the estimated values of the current matter density parameter (for the full non-CMB data), (), (), and () for the flat (nonflat) CDM, XCDM, and CDM models, respectively. The flat models and both the CDM cases are more consistent with the Dark Energy Survey (DES) constraint, (DES Collaboration, 2018) while the nonflat CDM and XCDM model results are 1.5 (of the quadrature sum of the two error bars) larger than the DES measurement.
Table 3 summarizes the individual and total for the best-fit flat and nonflat CDM, XCDM, and CDM models. The best-fit set of parameters for each model has been determined by using Powell’s minimization method (built into the COSMOMC program) for finding the location of the maximum likelihood. The of the XCDM and CDM models denotes the excess relative to the CDM one for the same combination of data sets and spatial curvature sign. The last two columns list the number of degrees of freedom and the reduced chi-square . The number of degrees of freedom is , where is the number of data points and is the number of parameters. For example, for the nonflat CDM model constrained using SN+BAO+ data, and , considering the five cosmological parameters (, , , , ) and the five nuisance parameters of the SN sample. Except for the case of the nonflat XCDM parameterization constrained using the SN+BAO+ data, the XCDM parametrizations fit the observations better than do the CDM models. Furthermore, the CDM models better fit the data than do the XCDM parametrizations, except for the flat CDM case constrained using SN+ data.999The main reason for the smaller value in the nonflat CDM model is that it fits the BAO data much better than do the CDM and XCDM models. However, the values are not very statistically significant.
| Parameter | SN+ | SN+BAO | BAO+ | SN+BAO+ |
|---|---|---|---|---|
| Flat model | ||||
| [km s-1 Mpc-1] | (95.4% C.L.) | |||
| Nonflat model | ||||
| [km s-1 Mpc-1] | (95.4% C.L.) | |||
| Flat XCDM parameterization | ||||
| [km s-1 Mpc-1] | (95.4% C.L.) | |||
| Nonflat XCDM parameterization | ||||
| [km s-1 Mpc-1] | (95.4% C.L.) | |||
| Flat CDM model | ||||
| [km s-1 Mpc-1] | (95.4% C.L.) | |||
| [95.4% C.L.] | [ (68.3% C.L.)] | |||
| Nonflat CDM model | ||||
| [km s-1 Mpc-1] | (95.4% C.L.) | |||
| [95.4% C.L.] | (68.3% C.L.) | |||
Note: is a derived parameter.
| Data sets | Total | ||||||
| Flat CDM model | |||||||
| SN+ | 1035.98 | 14.61 | 1050.59 | 1070 | 0.9819 | ||
| SN+BAO | 1035.99 | 10.06 | 1046.05 | 1051 | 0.9953 | ||
| BAO+ | 10.03 | 14.58 | 24.61 | 39 | 0.6310 | ||
| SN+BAO+ | 1036.00 | 10.03 | 14.61 | 1060.64 | 1082 | 0.9803 | |
| Nonflat CDM model | |||||||
| SN+ | 1035.88 | 14.56 | 1050.44 | 1069 | 0.9826 | ||
| SN+BAO | 1036.10 | 10.04 | 1046.13 | 1050 | 0.9963 | ||
| BAO+ | 10.29 | 14.97 | 25.26 | 38 | 0.6647 | ||
| SN+BAO+ | 1036.06 | 10.02 | 14.58 | 1060.66 | 1081 | 0.9812 | |
| Flat XCDM parameterization | |||||||
| SN+ | 1035.93 | 14.43 | 1050.37 | 1069 | 0.9826 | ||
| SN+BAO | 1036.12 | 9.73 | 1045.84 | 1050 | 0.9960 | ||
| BAO+ | 7.03 | 14.98 | 22.01 | 38 | 0.5792 | ||
| SN+BAO+ | 1036.25 | 9.57 | 14.67 | 1060.49 | 1081 | 0.9810 | |
| Nonflat XCDM parameterization | |||||||
| SN+ | 1035.90 | 14.51 | 1050.41 | 1068 | 0.9835 | ||
| SN+BAO | 1036.03 | 9.98 | 1046.00 | 1049 | 0.9971 | ||
| BAO+ | 10.30 | 14.71 | 25.02 | 37 | 0.6762 | ||
| SN+BAO+ | 1036.15 | 9.81 | 14.81 | 1060.76 | 1080 | 0.9822 | |
| Flat CDM model | |||||||
| SN+ | 1035.98 | 14.61 | 1050.59 | 1069 | 0.9828 | ||
| SN+BAO | 1036.38 | 9.37 | 1045.74 | 1050 | 0.9959 | ||
| BAO+ | 7.00 | 14.89 | 21.88 | 38 | 0.5758 | ||
| SN+BAO+ | 1036.36 | 9.39 | 14.68 | 1060.43 | 1081 | 0.9810 | |
| Nonflat CDM model | |||||||
| SN+ | 1035.84 | 14.54 | 1050.38 | 1068 | 0.9835 | ||
| SN+BAO | 1036.07 | 8.02 | 1044.09 | 1049 | 0.9953 | ||
| BAO+ | 4.14 | 15.05 | 19.19 | 37 | 0.5186 | ||
| SN+BAO+ | 1036.26 | 7.86 | 15.14 | 1059.27 | 1080 | 0.9808 | |
Note: of the XCDM and CDM models represent the excess value relative to of the corresponding model for the same combination of data sets and spatial curvature sign.
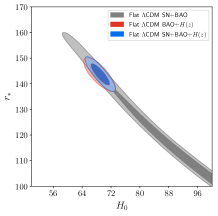
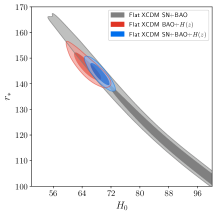
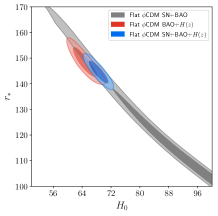
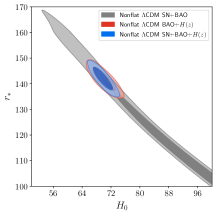
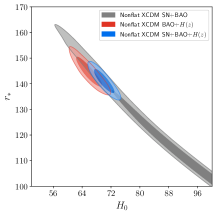
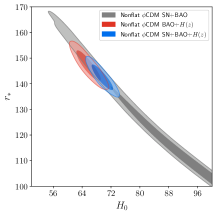
Comparing the results for SN+ and SN+BAO data in Figs. 1–3, we see that the BAO data are less restrictive than the Hubble parameter data in the parameter estimation. Especially, SN+BAO data do not provide a tight constraint on , allowing extreme values of the Hubble constant . This seems to be in contradiction to the recent estimation of Hubble constant using the inverse distance ladder method (Macaulay et al., 2019; Aubourg et al., 2015), where the Hubble constant has been tightly constrained by the SN and BAO data with a reasonable prior on the sound horizon size at recombination () based on the CMB data. In our analysis, however, we do not assume any prior on the sound horizon size because we aim to see how the cosmological parameters of the dark energy models are constrained without relying on the CMB data. Figure 4 shows the relation between the Hubble constant () and the sound horizon size at recombination () in the six models considered here. As expected, the case of SN+BAO data shows strong correlation between and . For a higher value of Hubble constant, the lower sound horizon size is favored. We note that such a low value of sound horizon (e.g., Mpc) is certainly unrealistic in most cosmological models. However, we emphasize that adding Hubble parameter measurements to our analysis provide a very tight constraint on the sound horizon size. For SN+BAO+ data set, Mpc ( Mpc) in flat (nonflat) CDM model, Mpc ( Mpc) in flat (nonflat) XCDM model, and Mpc ( Mpc) in flat (nonflat) CDM model. These values are consistent with Mpc of the flat CDM model constrained with the Planck 2018 data (TT,TE,EE+lowE+lensing, Planck Collaboration 2018).
5. Summary
We have used Type Ia supernova apparent magnitude, baryon acoustic oscillation distance, and Hubble parameter measurements to constrain parameters of the flat and nonflat CDM, XCDM, and CDM models.
Our main results, in summary, are:
-
•
These data favor closed spatial hypersurfaces at 1.1 to 2.1, depending on the nonflat model.
-
•
These data do not rule out dark energy dynamics.
-
•
These data favor a smaller Hubble constant than the recent local expansion rate measurement of km s-1 Mpc-1 (Riess et al., 2018) at 1.3 to 2.0, depending on model.
These results are consistent with those that follow from similar analyses of CMB anisotropy data in untilted nonflat inflation models, and consequently joint analyses of CMB and non-CMB data reinforce the above findings (Park & Ratra, 2018a, b, c).
References
- Alam et al. (2017) Alam, S., Ata, M., Bailey, S., et al. 2017, MNRAS, 470, 2617 [arXiv:1607.03155]
- Ata et al. (2018) Ata, M., Baumgarten, F., Bautista, J., et al. 2018, MNRAS, 473, 4773 [arXiv:1705.06373]
- Aubourg et al. (2015) Aubourg, E., et al. 2015, Phys. Rev. D, 92, 123516 [arXiv:1411.1074]
- Avsajanishvili et al. (2015) Avsajanishvili, O., Samushia, L., Arkhipova, N. A., & Kahniashvili, T. 2015, arXiv:1511.09317
- Bautista et al. (2017) Bautista, J. E., Busca, N. G., Guy, J., et al. 2017, A&A, 603, A12 [arXiv:1702.00176]
- Beutler et al. (2011) Beutler, F., Blake, C., Colless, M., et al. 2011, MNRAS, 416, 3017 [arXiv:1106.3366]
- Campanelli et al. (2012) Campanelli, L., Fogli, G.-L., Kahniashvili, T., Marrone, A., & Ratra, B. 2012, Eur. Phys. J., C72, 2218 [arXiv:1110.2310]
- Capozziello et al. (2014) Capozziello, S., Farooq, O., Luongo, O., & Ratra, B. 2014, Phys. Rev. D, 90, 044016 [arXiv:1403.1421]
- Challinor & Lasenby (1999) Challinor, A., & Lasenby, A. 1999, ApJ, 513, 1 [arXiv:astro-ph/9804301]
- Chen et al. (2003) Chen, G., Gott, J. R., & Ratra, B. 2003, PASP, 115, 1269 [arXiv:astro-ph/0308099]
- Chen & Ratra (2011a) Chen, G., & Ratra, B. 2011a, PASP, 123, 1127 [arXiv:1105.5206]
- Chen et al. (2017) Chen, Y., Kumar, S., & Ratra, B. 2017, ApJ, 835, 86 [arXiv:1606.07316]
- Chen & Ratra (2011b) Chen, Y., & Ratra, B. 2011b, Phys. Lett. B, 703, 406 [arXiv:1106.4294]
- Chen et al. (2016) Chen, Y., Ratra, B., Biesiada, M., Li, S., & Zhu, Z.-H. 2016, ApJ, 829, 61 [arXiv:1603.07115]
- Conley et al. (2011) Conley, A., Guy, J., Sullivan, M., et al. 2011, ApJS, 192, 1 [arXiv:1104.1443]
- da Silva & Cavalcanti (2018) da Silva, G. P., & Cavalcanti, A. G. 2018, Braz. J. Phys, 48, 521 [arXiv:1805.06849]
- DES Collaboration (2018) DES Collaboration, Abbott, T. M. C., Abdalla, F. B., Alarcon, A., et al. 2018, Phys. Rev. D, 98, 043526 [arXiv:1708.01530]
- DES Collaboration (2017) DES Collaboration, Abbott, T. M. C., Abdalla, F. B., Annis, J., et al. 2017, arXiv:1711.00403
- Dhawan et al. (2017) Dhawan, S., Jha, S. W., & Leibundgut, B. 2017, A&A, 609, A72 [arXiv:1707.00715]
- Farooq et al. (2013) Farooq, O., Crandall, S., & Ratra, B. 2013, Phys. Lett. B, 726, 72 [arXiv:1305.1957]
- Farooq et al. (2017) Farooq, O., Madiyar, F. R., Crandall, S., & Ratra, B. 2017, ApJ, 835, 26 [arXiv:1607.03537]
- Farooq et al. (2015) Farooq, O., Mania, D., & Ratra, B. 2015, ApSS, 357, 11 [arXiv:1308.0834]
- Farooq & Ratra (2013) Farooq, O., & Ratra, B. 2013, ApJ, 766, L7 [arXiv:1301.5243]
- Fernández Arenas et al. (2018) Fernández Arenas, D., Terlevich, E., Terlevich, R., et al. 2018, MNRAS, 474, 1250 [arXiv:1710.05951]
- Font-Ribera et al. (2014) Font-Ribera, A., Kirkby, D., Busca, N., et al. 2014, JCAP, 1405, 027 [arXiv:1311.1767]
- Gómez-Valent & Amendola (2018) Gómez-Valent, A., & Amendola, L. 2018, JCAP, 0804, 051 [arXiv:1802.01505]
- Gott (1982) Gott, J. R. 1982, Nature, 295, 304
- Gott et al. (2001) Gott, J. R., Vogeley, M. S., Podariu, S., & Ratra, B. 2001, ApJ, 549, 1 [arXiv:astro-ph/0006103]
- Haridasu et al. (2018b) Haridasu, B. S., Luković, V. V., Moresco, M., & Vittorio, N. 2018b, arXiv:1805.03595
- Haridasu et al. (2018a) Haridasu, B. S., Luković, V. V., & Vittorio, N. 2018a, JCAP, 1805, 033 [arXiv:1711.03929]
- Hawking (1984) Hawking, S. W. 1984, Nucl. Phys. B, 239, 257
- Jesus et al. (2018) Jesus, J. F., Holanda, R. F. L., & Pereira, S. H. 2018, JCAP, 1805, 073 [arXiv:1712.01075]
- Jones et al. (2018) Jones, D. O., Riess, A. G., Scolnic, D. M.,et al. 2018, arXiv:1805.05911
- Kim et al. (2018) Kim, Y.-L., Smith, M., Sullivan, M., & Lee, Y.-W. 2018, arXiv:1801.01192
- Lewis & Bridle (2002) Lewis, A., & Bridle, S. 2002, Phys. Rev. D, 66, 103511 [arXiv:astro-ph/0205436]
- Lewis et al. (2000) Lewis, A., Challinor, A., & Lasenby, A. 2000, ApJ, 538, 473 [arXiv:astro-ph/9911177]
- L’Huillier & Shafieloo (2017) L’Huillier, B., & Shafieloo, A. 2017, JCAP, 1701, 015 [arXiv:1606.06832]
- Lin & Ishak (2017) Lin, W., & Ishak, M. 2017, Phys. Rev. D, 96, 083532 [arXiv:1708.09813]
- Macaulay et al. (2019) Macaulay, E., Nichol, R. C., Bacon, D., et al. [DES Collaboration] 2019, MNRAS, 486, 2184 [arXiv:1811.02376]
- Mitra et al. (2018) Mitra, S., Choudhury, T. R., & Ratra, B. 2018, MNRAS, 479, 4566 [arXiv:1712.00018]
- Mitra et al. (2019) Mitra, S., Park, C.-G., Choudhury, T. R., & Ratra, B. 2019, arXiv:1901.09927
- Moresco et al. (2018) Moresco, M., Jimenez, R., Verde, L., et al. 2018, ApJ, 868, 84 [arXiv:1804:05864]
- Moresco et al. (2016) Moresco, M., Pozzetti, L., Cimatti, A., et al. 2016, JCAP, 1605, 014 [arXiv:1601:01701]
- Ooba et al. (2018a) Ooba, J., Ratra, B., & Sugiyama, N. 2018a, ApJ, 864, 80 [arXiv:1707.03452]
- Ooba et al. (2018b) Ooba, J., Ratra, B., & Sugiyama, N. 2018b, ApJ, 869, 34 [arXiv:1710.03271]
- Ooba et al. (2018c) Ooba, J., Ratra, B., & Sugiyama, N. 2018c, ApJ, 866, 68 [arXiv:1712.08617]
- Ooba et al. (2018d) Ooba, J., Ratra, B., & Sugiyama, N. 2018d, arXiv:1802.05571
- Park & Ratra (2018a) Park, C.-G., & Ratra, B. 2018a, arXiv:1801.00213
- Park & Ratra (2018b) Park, C.-G., & Ratra, B. 2018b, arXiv:1803.05522
- Park & Ratra (2018c) Park, C.-G., & Ratra, B. 2018c, ApJ, 868, 83 [arXiv:1807.07421]
- Pavlov et al. (2013) Pavlov, A., Westmoreland, S., Saaidi, K., & Ratra, B. 2013, Phys. Rev. D, 88, 123513 [arXiv:1307.7399]
- Peebles (1984) Peebles, P. J. E. 1984, ApJ, 284, 439
- Peebles & Ratra (1988) Peebles, P. J. E., & Ratra, B. 1988, ApJ, 325, L17
- Penton et al. (2018) Penton, J., Peyton, J., Zahoor, A., & Ratra, B. 2018, PASP, 130, 114009 [arXiv:1808.01490]
- Planck Collaboration (2014) Planck Collaboration, Ade, P. A. R., Aghanim, N., Arnaud, M., et al. 2014, A&A, 571, A16 [arXiv:1303.5076]
- Planck Collaboration (2016) Planck Collaboration, Ade, P. A. R., Aghanim, N., Arnaud, M., et al. 2016, A&A, 594, A13 [arXiv:1502.01589]
- Planck Collaboration (2018) Planck Collaboration, Aghanim, N., Akrami, Y., Ashdown, M., et al. 2018, arXiv:1807.06209
- Rana et al. (2017) Rana, A., Jain, D., Mahajan, S., & Mukherjee, A. 2017, JCAP, 1703, 028 [arXiv:1611.07196]
- Ratra (1985) Ratra, B. 1985, Phys. Rev. D, 31, 1931
- Ratra (2017) Ratra, B. 2017, Phys. Rev. D, 96, 103534 [arXiv:1707.03439]
- Ratra & Peebles (1988) Ratra, B., & Peebles, P. J. E. 1988, Phys. Rev. D, 37, 3406
- Ratra & Peebles (1995) Ratra, B., & Peebles, P. J. E. 1995, Phys. Rev. D, 52, 1837
- Riess et al. (2018) Riess, A. G., Casertano, S., Yuan, E., et al. 2018, ApJ, 855, 136 [arXiv:1801.01120]
- Rigault et al. (2015) Rigault, M., Aldering, G., Kowalski, M., et al. 2015, ApJ, 802, 20 [arXiv:1412.6501]
- Roman et al. (2017) Roman, M., Hardin, D., Betoule, M., et al. 2017, arXiv:1706.07697
- Ross et al. (2015) Ross, A. J., Samushia, L., Howlett, C., et al. 2015, MNRAS, 449, 835 [arXiv:1409.3242]
- Ryan et al. (2019) Ryan, J., Chen, Y., & Ratra, B. 2019, arXiv:1902.03196
- Ryan et al. (2018) Ryan, J., Doshi, S., & Ratra, B. 2018, MNRAS, 480, 759 [arXiv:1805.06408]
- Samushia et al. (2007) Samushia, L., Chen, G., & Ratra, B. 2007, arXiv:0706.1963
- Samushia & Ratra (2010) Samushia, L., & Ratra, B. 2010, ApJ, 714, 1347 [arXiv:0905.3836]
- Sangwan et al. (2018) Sangwan, A., Tripathi, A, & Jassal, H. K. 2018, arXiv:1804.09350
- Scolnic et al. (2018) Scolnic, D. M., Jones, D. O., Rest, A., et al. 2018, ApJ, 859, 101 [arXiv:1710.00845]
- Solà et al. (2017b) Solà, J., de Cruz Pérez, J., & Gómez-Valent, A. 2017b, arXiv:1703.08218
- Solà et al. (2017a) Solà, J., Gómez-Valent, A., & de Cruz Pérez, J. 2017a, Mod. Phys. Lett. A, 32, 1750054 [arXiv:1610.08965]
- Wang et al. (2017) Wang, Y., Xu, L., & Zhao, G.-B. 2017, ApJ, 849, 84 [arXiv:1706.09149]
- Wei & Wu (2017) Wei, J.-J., & Wu, X.-F. 2017, ApJ, 838, 160 [arXiv:1611.00904]
- Yashar et al. (2009) Yashar, M., Bozek, B., Abrahamse, A., Albrecht, A., & Barnard, M. 1999, Phys. Rev. D, 79, 103004 [arXiv:0811.2253]
- Yu et al. (2018) Yu, H., Ratra, B., & Wang, F.-Y. 2018, ApJ, 856, 3 [arXiv:1711.03437]
- Yu & Wang (2016) Yu, H., & Wang, F. Y. 2016, ApJ, 828, 85 [arXiv:1605.02483]
- Zhai et al. (2017) Zhai, Z., Blanton, M., Slosar, A., & Tinker, J. 2017, ApJ, 850, 183 [arXiv:1705.10031]
- Zhang et al. (2017) Zhang, B. R., Childress, M. J., Davis, T. M., et al. 2017, MNRAS, 471, 2254 [arXiv:1706.07573]
- Zhang (2018) Zhang, J. 2018, PASP, 130, 084502
- Zhang et al. (2018) Zhang, X., Huang, Q.-G., & Li, X.-D. 2018, arXiv:1801.07403