Spontaneous Frenkel pair formation in Zirconium Carbide
Abstract
With density functional theory we have performed molecular dynamics simulations of ZrC which displayed spontaneous Frenkel pair formation at a temperature of K, some ° below the melting point. To understand this behaviour, rarely seen in equilibrium simulations, we quenched and examined a set of lattices containing a Frenkel pair. Five metastable structures were found, and their formation energies and electronic properties were studied. Their thermal generation was found to be facilitated by a reduction of between and eV in formation energy due to thermal expansion of the lattice. With input from a quasi-harmonic description of the defect free energy of formation, an ideal solution model was used to estimate lower bounds on their concentration as a function of temperature and stoichiometry. At 3000 K (0.81 of the melting temperature) their concentration was estimated to be 1.2% per mole in a stoichiometric crystal, and 0.3% per mole in a crystal with 10% per mole of constitutional vacancies. Their contribution to heat capacity, thermal expansion and bulk modulus was estimated.
Zirconium carbide is a hard, corrosion-resistant material, with a high melting point and metallic conductivity. The attractiveness of ZrC for aerospace and nuclear applications has been documented.(Kim2010, ; Razumovskiy2013, ; Harrison2015, ; Justin2011, ) To support the experimental investigations of ZrC, particularly for safety critical applications, we seek to understand an predict some of the properties of this material at high temperature. In this regard, thermodynamic measurements are particularly challenging at temperatures approaching K or above, and theoretical predictions are few. Notable exceptions filling some of the gaps are the recent ultra-high temperature measurements by Savvatimsky et al., and first principles simulations by Duff et al. (Duff2015, ; Savvatimskiy2017, ). Nevertheless, even the currently most reliable phase diagram (FernandezGuillermet1995, ) is necessarily incomplete and based on empirical modelling, extrapolating from experimental data, which does not explicitly include data for point defects or their interactions.(Davey2017, )
Recent publications provide a hint that a ZrC crystal may contain a significant concentration of intrinsic Frenkel defects at high temperature. Calculations by Kim et al. and Zhang et al. at zero temperature report low enthalpies of interstitial carbon formation,(Kim2010, ; Zhang2014, ) and the analysis of experiments conducted by Savvatimsky et al.(Savvatimskiy2017, ) near the melting point attribute heat capacity behaviour at high temperature to possible Frenkel defects. In this work, we use temperature-dependent density-functional theory (DFT) calculations to address the possible formation of intrinsic defects, and deduce consequences thereof for thermal properties.
The plan of the paper is as follows. In Sec. I.1 we state technical parameters for numerical calculations, followed by the setting out of basic equations for the thermodynamic analysis in Sec. I.2. Section II.1 details the discovery of defects by molecular dynamics, and describes our systematic search of the defect configuration space. In Sec. II.2 the calculated structures and stability of defects at K is reported. Section II.3 discusses elementary thermal excitations in the defective crystal. Section II.4 reports some temperature dependent properties, including Frenkel defect concentration, thermal expansion, heat capacity and bulk modulus. Finally the effect of substoichiometry on Frenkel pair concentration is discussed. The Appendix contains supplementary details on the predicted ZrC properties and a derivation of the ideal solution model for the five Frenkel defects at variable carbon substoichiometry.
I Methods
| Observable | (eV) | k-point grid | Supercell size |
|---|---|---|---|
| 700 | |||
| 700 | |||
| 700 | |||
| 700 | |||
| 500 |
I.1 Calculation
Langevin NVT molecular dynamics (MD) simulations were performed for five temperature-volume points up to the melting point on the ZrC thermal expansion curve.(Duff2015, ) MD simulations were run for ps at each temperature-volume point, with a friction parameter of THz and time-step of fs.
Periodic plane-wave density function theory (DFT) calculations were performed using the VASP software,(Kresse1996, ; Kresse1996a, ) with the local density approximation (LDA) exchange-correlation function.(Perdew1981a, ) The projector-augmented wave (PAW) method is used,(Kresse1999, ) with 4s- and 4p-Zr electrons included as valence states. The k-point sampling mesh and cutoff kinetic energies are chosen to obtain free energies converged to better than meV/atom and meV/defect. k-point mesh sampling and plane-wave cutoff values are summarized in Table 1. The DFT crystal energy and the phonon free energy were each calculated on a mesh of 11 volumes spanning the range to . was computed using quasiharmonic lattice dynamics as implemented in the PHONOPY code(Togo2015a, ) with the direct method of calculating the dynamical matrix.(Kresse1995, ; Parlinski1997, ; Oba2008, ) At each of the 11 volumes, sets of small displacements were applied. Each configuration required between 40 and 768 displacements depending on space group. The dynamical matrix was built from these forces.(Kresse1996, ; Kresse1996a, ; Perdew1981a, ; Togo2015a, ) For defect structures, we assumed that thermal expansion of the crystal can be modelled by a supercell with homogeneous isotropic principal axis strains. At each volume, internal coordinates were optimized until force changes were less than eV/Å. Force calculations used first-order Methfessel-Paxton electron smearing with an electronic temperature of 0.1 eV.(Methfessel1989, )
The electronic free energy, , was calculated using the Mermin finite-temperature formulation of DFT,(Mermin1965, ) on a mesh of 10 temperatures and 8 volumes, sampled between and . Electron states are self-consistent to within eV/atom. The atom supercell used contains electrons, for which bands were sufficient to span all states with significant partial occupation up to the melting point.
I.2 Analysis
We calculate the Helmholtz free energy
as a sum of three terms
| (1) |
is the total energy of static crystal configurations, the vibrational free energy, and the contribution of single-electron thermal excitations as described in the Mermin functional.
The calculated free energies are fitted by third-degree polynomials,
| (2) |
with , and .
The Helmholtz free energy is Legendre transformed to the Gibbs free energy for calculating thermodynamic quantities at constant external pressure :
| (3) |
The volume minimisation is performed on a mesh of temperatures separated at K intervals.
For intrinsic defect in a stoichiometric supercell, is used to calculate the defect formation energy:
| (4) |
The spurious interaction between the defect and its periodic images, both electronic and due to the overlapping strain fields, is accounted for with a finite-size energy correction,
| (5) |
The finite-size correction , is estimated from calculations at the zero-temperature equilibrium volume,
| (6) |
where is the energy to form a defect in a supercell. To estimate in the limit of non-interacting periodic images, the defect energy is calculated for supercell sizes ranging from (Zr32C32) to (Zr256C256), and linearly extrapolated to the dilute limit.
The equilibrium concentration of intrinsic defects has been calculated using the dilute-limit with an ideal solution model. The model assumes a partition function of the form
where are degeneracies and are defect numbers, indexed for vacancies, bound pair Frenkels and unbound pair Frenkels respectively. Z gives
and
for bound and unbound Frenkel pair concentrations. Model derivation and additional details in Appendix.
II Results
II.1 Discovery of defects
Molecular dynamics
With density functional theory (DFT) we first performed ab initio molecular dynamics (AIMD) simulations for stoichiometric ZrC. Although the timescales accessible in AIMD simulations are typically insufficient to determine defect statistics such as bound pair lifetimes, even short runs of 15 ps can provide insight into defect behaviour. Trajectories were analyzed using an equal-time spatial pair correlation functions defined as follows
| (7) |
where and . The time argument is specified in as we do not suppose the thermodynamic limit for our small ensemble simulations.
Near the melting point, carbon atoms are occasionally observed to hop spontaneously from () perfect Wyckoff b-sites, with high-symmetry and octahedral coordination, to low symmetry interstitial sites. Site-resolved pair correlation functions show that newly-formed carbon interstitials do not immediately leave sites that are nearest-neighbour to the vacancy they have created. We therefore refer to the resulting defect as a bound pair Frenkel defect.
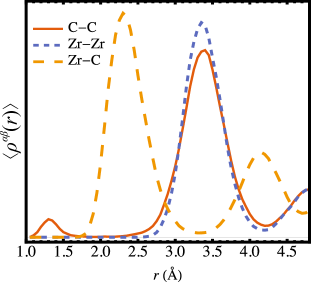
The time-averaged correlation functions,
| (8) |
are shown for stoichiometric ZrC at the melting point in Fig. 1. The distinctive carbon-carbon peak at the small separation of Å signifies interstitial carbon in ZrC. The width of the peak suggests the interstitial carbon is sufficiently thermally excited to move between multiple coordinations (which have a range of C-C bond lengths). Examining this behaviour using AIMD simulations requires significant computational resources. To aid sampling of the interstitial configuration space, interstitial dynamics has been biased to prohibit the recombination of interstitial and vacancy.
To bias interstitial dynamics a hydrogen atom is placed and frozen in position at the vacant carbon site. At the melting temperature, the interstitial is found to exchange between multiple sites within the vacancy nearest-neighbour (nn) coordination shell. Within ps, the interstitial is observed to begin diffusing, hopping away from vacancy-nn coordination. Beyond the vicinity of the vacancy-nn, the displaced carbon can hop between lattice interstitial sites, or switch places with a perfect-site carbon. In AIMD simulations we cannot access fine-grained diffusion statistics, but note that hopping behaviour between distinct sites is quite clearly observed on the picosecond timescale.
The Frenkel pairs observed in melting point AIMD are found to be metastable at low temperature. This is confirmed by selecting MD configurations at random, and quenching by steepest-descent to K. The Frenkel interstitial tends to relax to a C-C-C trimer unit, with a bond angle of and symmetry. The trimer is found to be stable across volume dilations ranging from at least -5 % to +16 % under homogeneous principal axis strains.
Systematic search for Frenkel pairs
In addition to the carbon-trimer of symmetry, identified from quenched AIMD snapshots, we have systematically searched for other Frenkel defect configurations with distinct symmetry. 1331 initial Frenkel configurations were considered, each corresponding to a different interstitial position. The interstitial positions were distributed on a uniform grid in a symmetry-reduced wedge of the defective supercell with other atoms fixed in their perfect lattice sites. Each configuration provided a starting point for a geometry optimization. Optimized configurations were subsequently analyzed in terms of energy and symmetry to identify distinct metastable Frenkel configurations.
In the relaxation of the 1331 initial Frenkel configurations, forces were finely optimized to better than eV/Å. This was necessary to prevent relaxations becoming trapped in flat, high-symmetry regions of the defect configuration space that are not quite local minima. The high-accuracy relaxations provide data from which we identify two bound and three unbound interstitial-vacancy pairs that are stable at the equilibrium volume. If the vacancy-interstitial pair is classified as bound, and if the Frenkel pair is said to be unbound.
II.2 Defect structures
| Config. | Description | Orientation | Point group | Multiplicity, i | Angle, Cnn-Ci-Cnn (°) | Length, Cnn-Ci (Å) |
|---|---|---|---|---|---|---|
| bound dimer | - | 1.411 | ||||
| bound trimer | 126.7 | 1.506 | ||||
| unbound dimer | - | 1.411 | ||||
| unbound trimer angular | 135.9 | 1.459 | ||||
| unbound trimer linear | 179.4 | 1.376 | ||||
| unbound tetramer | 117.4 | 1.586 |
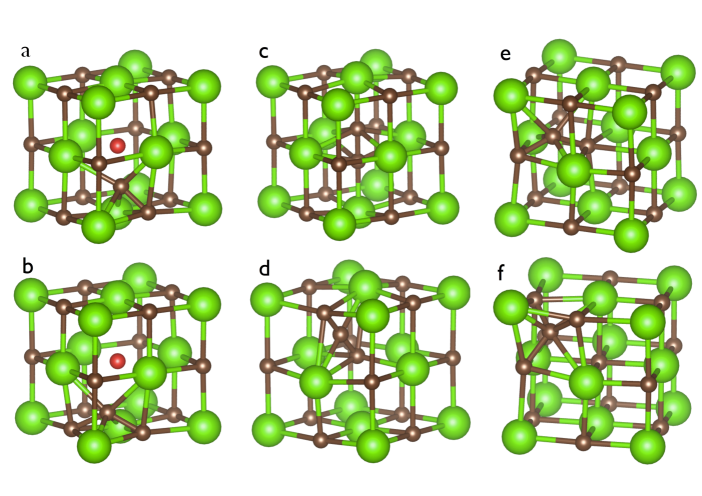
Of the five defects considered as bound () or unbound () Frenkel pairs, the carbon atoms involved are further classified as dimer, trimer or tetramer, denoted by a subscript suffix. For each configuration, bound-dimer (), bound-trimer (), unbound-dimer (), unbound-trimer (), unbound-tetramer (), the energetic ordering at the zero-temperature equilibrium volume is as follows:
Formation energies are listed in Table 4, each defect structure is pictured in Fig. 2, and features of the defect geometries such as bond lengths and point symmetries are listed in Table 2.
Note, at the equilibrium volume, the configuration is an angular C-C-C unit, but the linear C-C-C configuration, , is stabilised at sufficiently large lattice expansion. Both are shown in Fig. 2.
II.3 Electrons and phonons
| Configuration | ||||
|---|---|---|---|---|
| 0.09 | 1.18 | 2.16 | -0.97 | |
| 0.24 | 0.72 | 2.13 | -1.41 | |
| 0.01 | 2.29 | 2.45 | -0.16 | |
| 0.06 | 1.40 | 2.53 | -1.13 | |
| 0.08 | 1.26 | 2.46 | -1.20 |
Lattice vibrations with defects
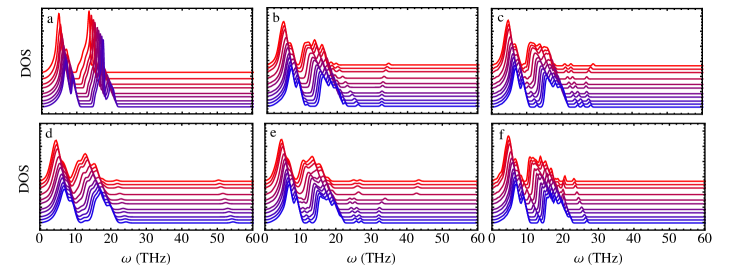
Phonon densities of states (DOS) are shown as a function of frequency and volume dilation in Fig. 3. Typically vibration frequencies soften with lattice expansion. For example the mean Grüneisen parameter () for perfect ZrC is at low temperature, increasing to at high temperature. A notable feature of the perfect ZrC phonon DOS is the obvious gap in frequencies. For each density of states, below the gap 98.6 % of the squared amplitude is on Zr sites, and above the gap 98.6 % is on C sites.
Frenkel defects can be identified in the phonon DOS (Fig. 3) from the distinctive patterns of high frequency vibrations associated with the interstitial carbon. The patterns shown may provide a useful spectroscopic fingerprint to experimentally identify Frenkel pairs in the future.
The most stable defect configuration at K is (see Table 4), for which the phonon DOS is shown in Fig. 3c. The defect states comprise localised carbon vibrational frequencies with one mode red-shifted and three modes blue-shifted enough to lie outside the band of bulk carbon frequencies. The red-shifted defect mode, clearly evident in the gap between the bulk carbon and zirconium frequencies, is due to rigid C-C-C translation. For the blue-shifted modes, the highest frequency vibration is an asymmetric stretch. The other two blue-shifted local modes are types of symmetric stretches, which are distinguished by the motion of the interstitial relative to the local environment as in or out of the C-C-C plane.
To quantify the high degree of localisation for these vibrations, consider the highest frequency defect state in Fig. 3c. For this asymmetric stretch mode, 60.1% of the motion projects onto the interstitial, and 19.3% projects onto each of the two interstitial nearest neighbours. Only the remaining 1.3% is not localised on the immediate C-C-C unit. For , shown in Fig. 3b, the blue-shifted defect frequencies involve a C-C stretching mode which has the highest frequency, and second mode in which the interstitial rocks about a near-static carbon neighbour. The frequency-volume dependence of the rocking mode mirrors the Grüneisen parameter of bulk frequencies, softening with strain, but the stretching mode anomalously increases in frequency with lattice expansion.
The phonon states in Fig. 3d are further worth mentioning. The DOS shows one remarkably high frequency peak at THz. This vibration is due to stretching of the C-C dimer. The other blue-shifted defect mode is a dimer translation parallel to the bond orientation. The red-shifted defect frequencies, that overlap into the bulk carbon range, are due to C-C partial rotation in one instance, and in another due to dimer translation orthogonal to the C-C bond.
in Fig. 3e is also notable for the phase transition in strain evident via the Grüneisen discontinuity at large dilation. The transition occurs between crystal volume 13.5 and 13.8 Å3/atom and lifts the trimer point group symmetry from angular to linear . This change yields another unusually stiff mode at THz shown in Fig. 3e, which is due to asymmetric stretching of the C-C-C unit. Two other high-frequency localised modes exist, which have the same Grüneisen parameters below the transition. At the transition, the lower frequency mode changes Grüneisen sign, and begins increasing in frequency. This gives the appearance of a degeneracy at the 8th and 9th volumes in Fig. 8 e, but closer inspection reveals the modes are not degenerate. In Fig. 8 e we also note there are two low frequency localised modes in the gap evident below the transition. Above the transition there are still two localised modes at the gap, but they are not clearly observable in the total DOS plot due to proximity to bulk modes.
For in Fig. 3f, the stiffest defect mode is due to the carbon interstitial stretching against its three carbon nearest-neighbours. The observable red-shifted defect mode, between the bulk carbon and zirconium bands, is due to the rigid translation of the C4 unit which is made up of the interstitial and it’s three C nearest-neighbours.
Harmonic interatomic forces and vibration frequencies are related as
| (9) |
In this expression the force constant matrix determinant is equated with the product of the diagonal mass matrix entries and the squared frequencies .
The defective to perfect ratio / is a useful indicator of bond stiffness. In particular for stoichiometric defects when the force determinant ratio is a useful single-valued measure of the defect-induced frequency redistribution. The ratio can be expressed as a density of states difference integral
| (10) |
which is how we have calculated the ratio in practice in this work. It is also directly related to the classical excess vibrational entropy of the Frenkel defect by
If we infer net defect-induced crystal softening, else vice versa. For Frenkel defects in ZrC we observe , indicating stoichiometric defects reduce crystal stiffness. This occurs despite the high-frequency vibrations of Frenkel defects (visible in Fig. 3), that arise from locally stiffened interstitial carbon-carbon bonds, as explained in what follows.
The values of reported in Table 3 are positive which agrees in sign with Frenkel pair entropies reported for other materials.(Gillan1983, ; Walsh2011, ; Jacobs2000, ; Sahni1982, ) The unbound defects have larger vibrational entropies than bound defects, which is also consistent with reports for other materials, e.g. the Frenkel pairs in In2O3 reported by Walsh et al..(Walsh2011, )
at fixed perfect-crystal volume ranges from to d depending on the defect. Partial contributions from carbon and zirconium in Table 3 show is positive because the Zr-character modes soften more than the carbon-type vibrations harden due to the localised interstitial frequencies. An early Green’s function analysis of Frenkel pairs in CaF2 by Gillan and Jacobs made a similar partition of the defect entropy.(Gillan1983, ) The conclusions they drew were analogous – Frenkel defect entropy is net positive, despite the locally negative entropy of the stiffened interstitial vibrations.
Defect electronic characterisation
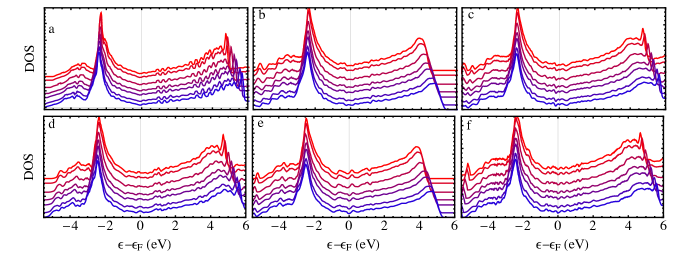
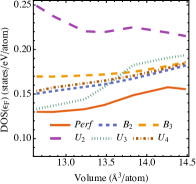
Our DFT calculations predict that perfect ZrC has a density of states at the Fermi energy of electron states/eV per atom. This value is similar to early estimates by Ihara et al.(Ihara1976, ) with 0.09 states/eV per atom, and Borukhovich and Geld(Borukhovich1969, ) with 0.1 states/eV per atom, and more recent LDA (GGA) calculations by Arya and Carter(Arya2004, ) with 0.112 (0.129) states/eV. Absolute computed values depend somewhat on technical parameters. For example we observe a 5% variation in on converging unitcell k-points between 4x4x4 and 40x40x40, +7% change increasing eV to eV, +2% change from Fermi-Dirac smearing to Methfessel-Paxton, and +12% increase from GGA to LDA at fixed volume. Given these sensitivities, we next consider trends with defect type and thermal expansion rather than absolute values.
The value of DOS(EF) is modified by the presence and type of the Frenkel defect in the crystal. A feature common to each defect is the tendency to increase DOS(EF) compared to perfect ZrC. Compared to 0.13 states/eV/atom in perfect ZrC, Frenkel defects increase DOS(EF) by between +0.02 states/eV/atom for and +0.12 states/eV/atom for .
The value of DOS(EF) in a transition metal can become larger or smaller with increasing Wigner-Seitz radius, for example, this has been reported by Pettifor for the 4d series.(Pettifor1977, ) In ZrC we find the precise dependence of DOS(EF) on volume expansion varies depending on the specific defect configuration, illustrated in Fig. 4.
As lattice dilation and the insertion of defects both tend to increase the value of DOS(EF), electron entropy will tend to stabilise defects. The distribution of DOS(E) for each crystal configuration has a distinctive energy dependence (see Fig. 4). At high temperatures a first-order Sommerfeld expansion will be inadequate beyond qualitative inferences. Quantitative predictions including electronic defect free energies from the Mermin functional are given subsequently.
II.4 Defect thermodynamics
II.4.1 Enthalpy and entropy
| Configuration | (eV/defect) | (eV/defect) |
|---|---|---|
| 3.734 | -0.031 | |
| 3.247 | -0.016 | |
| 4.436 | -0.042 | |
| 4.335 | -0.027 | |
| 4.441 | -0.030 |
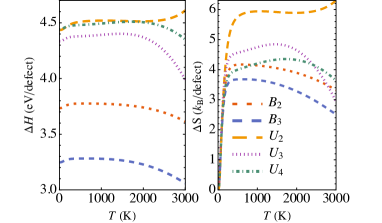
The Frenkel defect is the most energetically stable configuration at eV/defect, followed by at eV/defect. Unbound pairs are less stable, costing between and eV/defect to introduce to the lattice. The full set of values at K is listed in Table 4, and shown as a function of temperature at ambient pressure in Fig. 5. The defect formation enthalpies, , show variations of a few tenths of an eV over K. The relatively weak temperature dependence is due to partial cancellation of vibrational and electronic contributions. To see this consider the bound dimer enthalpy as a typical example. Between 0 K and 3000 K, the electronic part increases by eV/defect, and quasiharmonic part decreases by eV/defect. Overall change is modest at eV/defect, as evident in Fig. 5.
II.4.2 Gibbs energy of defect formation

The Gibbs energy of defect formation is shown in Fig. 6 up to 3000 K (above this temperature anharmonic thermodynamic contributions become considerable in ZrC)(Duff2015, ). Thermally excited electrons and phonons can reduce the energy to form a Frenkel defect by more than eV over the interval K to K. This is mostly due to phonons but the electron contribution gains relative importance with temperature. In terms of the Gibbs energy of defect formation, zero-point effects are negligible. This is observable in Fig. 6 and Table. 4.
II.4.3 Bulk modulus
| Configuration | ||||
|---|---|---|---|---|
| perfect | 240.7 | 236.2 | 216.7 | 143.6 |
| 230.0 | 225.8 | 207.6 | 134.6 | |
| 230.9 | 226.8 | 208.4 | 134.4 | |
| 229.5 | 225.1 | 206.3 | 126.4 | |
| 222.2 | 218.8 | 202.5 | 135.9 | |
| 229.5 | 225.2 | 206.8 | 135.9 | |
| ZrC (PBE) | 232.2(Jiang2017, ), 219(Ivashchenko2009, ), | - | - | - |
| 232(Cheng2004a, ; Jochym2000, ), 234(Xie2016, ) | ||||
| ZrC0.94(ultra-sonic) | - | 223(Chang1966, ) | - | - |
We estimate the isothermal bulk modulus as
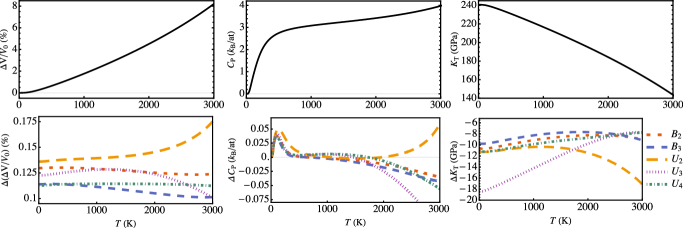
is known experimentally for ZrC from pulsed-ultrasonic measurements by Chang and Graham, who report GPa for ZrC0.94. At 300 K, we predict GPa, and GPa depending on the type of Frenkel defect present in the simulation cell. The defect reductions in are between % at the Frenkel concentration of one defect by supercell (1/32 C at. %). Frenkel-induced variation is relevant to ZrC applications in high radiation and temperature environments. ZrC is radiation tolerant and has a relatively low neutron scattering cross-section ),(Azevedo2011, ; Jiang2013, ; Jiang2017, ) but there is reportedly less known about ZrC for fuel clad design that comparable materials such as SiC.(Katoh2012, ; Azevedo2011, ; Snead2007, ) First principles data on Frenkel-induced changes to structural parameters is therefore likely useful for sensitivity analyses in multiphysics simulations of accident tolerant fuel materials.(Marino2015, ; Geelhood2014, ; Liu2018, ; Devanathan2010, )
The value we predict for perfect ZrC differs from other computational studies by 10-20 GPa.(Jiang2017, ; Ivashchenko2009, ; Cheng2004a, ; Xie2016, ) While most studies use the PBE GGA functional, we use the LDA exchange-correlation. Our choice of the LDA functional has been motivated by the adequate performance of LDA and poor performance of PBE at high temperature for ZrC reported by Duff et al. (Duff2015, ).
II.4.4 Heat capacity
The ambient-pressure isobaric heat capacity,
| (12) | ||||
| (13) |
is shown for perfect ZrC in Fig. 7, along with the excess defect contribution associated with forming a single defect.
The low-temperature peak arises from the differential temperature occupation of the perfect and defect crystal phonon spectra. Low frequency modes are softer in the defective lattice compared to the perfect crystal. As temperature increases, the defect crystal heat capacity increases more than perfect ZrC resulting in the peak. As the crystal approaches the Debye temperature, quantum effects in the heat capacity fall off and the difference recedes. We emphasise the low-temperature bump is not an isobaric effect, i.e., it is not due to the second term in Eqn. 13. It is also present in a plot of the constant volume equivalent .
| Configuration | ||||
|---|---|---|---|---|
| perfect | 12.706 | 12.740 | 12.931 | 13.749 |
| 12.836 | 12.870 | 13.060 | 13.873 | |
| 12.820 | 12.854 | 13.042 | 13.850 | |
| 12.843 | 12.877 | 13.070 | 13.924 | |
| 12.829 | 12.864 | 13.059 | 13.850 | |
| 12.819 | 12.854 | 13.045 | 13.861 | |
| ZrC (PBE) | 12.903(Jochym2000, ) 12.887(Xie2016, ) | - | - | - |
| ZrC0.94(exp.) | - | 12.973(Savvatimskiy2017, ) | - | - |
| ZrC0.95(exp.) | - | 12.928(Chang1966, ) | - | - |
II.4.5 Thermal expansion
The isotropic volume expansion is found from the volume that minimizes the Gibbs free energy at each temperature, It is shown for each configuration in Fig. 7, at a concentration of one defect per 64 atom supercell ( C at. %), and values are listed in Table 6. The volume expansion induced by one Frenkel defect in the supercell is approximately 0.12%, with weak dependence on temperature. We consider in the following sections the effect of a thermal population of defects.
| (K) | ||||
|---|---|---|---|---|
| 0 | 0.01 | 0.01 | ||
| 2 | ||||
| 2000 | 5 | |||
| 10 | ||||
| 0 | 0.02 | 0.18 | 0.20 | |
| 2 | 0.02 | 0.02 | 0.04 | |
| 2500 | 5 | 0.02 | 0.03 | |
| 10 | 0.02 | 0.02 | ||
| 0 | 0.27 | 0.93 | 1.19 | |
| 2 | 0.26 | 0.36 | 0.62 | |
| 3000 | 5 | 0.26 | 0.16 | 0.41 |
| 10 | 0.24 | 0.07 | 0.31 |
II.4.6 Defect concentration
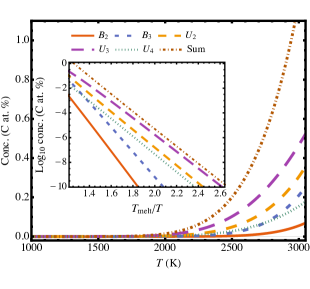
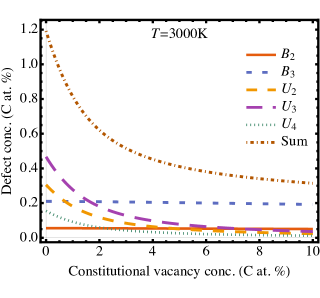
is shown in Fig. 8 between and K, calculated with the ideal solution model. Details are provided in Appendix A. ranges from 0.01% at K (0.54 ) to C at.% at K (0.81 ), where the experimental melting point is K. We are unaware of any reports of such high concentrations of thermally induced self-interstitials in any material hundreds of degrees below the melting point. Recent evidence, both experimental and with molecular dynamics, has indicated the existence of thermally induced self-interstitials in aluminium, but only within K of (Safonova2016, ), and at a concentration two or three times below that of the thermally induced vacancies. Since we are dealing here with a compound, the concept of thermally induced vacancies is not directly relevant; in the case of ZrC any concentration of carbon vacancies not associated with Frenkel defect formation is associated with non-stoichiometry. In practice, the ZrC lattice structure supports a high level of carbon deficit, manifest as vacancies on the carbon sublattice. The law of mass action dictates that such constitutional vacancies will reduce the concentration of unbound interstitials. Fig. 9 shows the calculated effect of substoichiometry on the Frenkel defect population at K. Some specific values are also listed in Table 7.
The exceptional population of Frenkel defects is explained by the following five points:
-
1.
ZrC supports at least five symmetry-inequivalent Frenkel-pair types, {, , , , }.
-
2.
Interstitial carbon tends to occupy low-symmetry sites. The associated multiplicities are listed in Table 2.
-
3.
Frenkel pairs increase the electronic density of states at the Fermi level.
-
4.
Frenkel pairs expand the lattice, with a net softening of vibration frequencies.
-
5.
ZrC remains crystalline to an unusually high melting temperature. Configurational, electronic, and phonon entropies, which are all stabilising for defects, therefore have uncommonly large stabilising effects.
III Conclusions
In simulations of a ZrC crystal, five distinct Frenkel defect configurations have been found that are metastable at zero temperature. Two of the configurations are bound pairs and in three other configurations the vacancy and interstitial are separated. While at 300 K the equilibrium concentration of Frenkel pairs is negligible, at K they were frequent enough to occur spontaneously during a first-principles molecular dynamics simulation.
We have performed quasi-harmonic lattice dynamics calculations to study further the thermodynamics of these defects. The results indicate surprisingly high concentrations of bound and unbound Frenkel pairs: in the stoichiometric crystal we estimate 0.01 % per mole at 2000 K, 0.2 % at 2500 K, and 1.2 % at 3000 K. For a substoichiometric crystal we can predict how much the number would be suppressed by recombination. The high proportion of bound vacancy-interstitial pairs maintains the high concentration of Frenkel pairs even in the presence of constitutional vacancies. We find for ZrC0.9 at 3000 K the concentration is reduced from the stoichiometric value 1.2 % to 0.3 %. This is by reducing the concentration of bound pairs from 0.93 % to 0.07 %, and the unbound pairs from 0.27 % to 0.24 %.
The high concentration of Frenkel defects change the properties of ZrC several important ways. A concentration of one defect per 64 atom ZrC cell approximately doubles the electronic density of states at the Fermi level, decreases the bulk modulus by 8-18 GPa, and dilates the lattice by 0.1-0.15 %. The Frenkel contribution to the heat capacity is relatively small, not exceeding 0.05 for K.
IV References
References
- [1] S Kim, I Szlufarska, and D Morgan. Ab initio study of point defect structures and energetics in ZrC. Journal of Applied Physics, 107(5):0535210–8, 2010.
- [2] VI Razumovskiy, AV Ruban, J Odqvist, and PA Korzhavyi. Vacancy-cluster mechanism of metal-atom diffusion in substoichiometric carbides. Physical Review B - Condensed Matter and Materials Physics, 87(5):54203–7, 2013.
- [3] RW Harrison and WE Lee. Processing and properties of ZrC, ZrN and ZrCN ceramics: a review. Advances in Applied Ceramics, 115(5):294–307, 2016.
- [4] JF Justin and A Jankowiak. Ultra High Temperature Ceramics: Densification, Properties and Thermal Stability. AerospaceLab Journal, 3(3):1–11, 2011.
- [5] AI Duff, T Davey, D Korbmacher, A Glensk, B Grabowski, J Neugebauer, and MW Finnis. Improved method of calculating ab initio high-temperature thermodynamic properties with application to ZrC. Physical Review B, 91(21):214311–8, 2015.
- [6] AI Savvatimskiy, SV Onufriev, and SA Muboyadzhyan. Measurement of ZrC properties up to 5000 K by fast electrical pulse heating method. Journal of Materials Research, 32(7):1287–1294, 2017.
- [7] A Fernández Guillermet. Analysis of thermochemical properties and phase stability in the zirconium-carbon system. Journal of Alloys and Compounds, 217:69–89, 1995.
- [8] T Davey. Thermodynamic assessments of the (Zr,Hf) carbides and borides revisited and informed by the calculation of defect formation energies in ZrC (Imperial College London). PhD thesis, 2017.
- [9] Y Zhang, J Wang, J Wang, B Liu, and H Zhang. Understanding the behavior of native point defects in ZrC by first-principles calculations. Journal of the American Ceramic Society, 97(12):4024–4030, 2014.
- [10] G Kresse and J Furthmüller. Efficiency of ab-initio total energy calculations for metals and semiconductors using a plane-wave basis set. Computational Materials Science, 6:15–50, 1996.
- [11] G Kresse and J Furthmüller. Efficient iterative schemes for ab initio total energy calculations using a planewave basis set. Physical Review B, 54(16):11169–11186, 1996.
- [12] JP Perdew and A Zunger. Self-interaction correction to density-functional approximations for many-electron systems. Physical Review B, 23(10):5048–5079, 1981.
- [13] G Kresse and D Joubert. From ultrasoft pseudopotentials to the projector augmented-wave method. Physical Review B, 59(3):1758, 1999.
- [14] A Togo and I Tanaka. First principles phonon calculations in materials science. Scripta Materialia, 108:1–5, 2015.
- [15] G Kresse, J Furthmüller, and J Hafner. Ab initio Force Constant Approach to Phonon Dispersion Relations of Diamond and Graphite. EPL (Europhysics Letters), 32(9):729, 1995.
- [16] K Parlinski, Z Li, and Y Kawazoe. First-Principles Determination of the Soft Mode in Cubic ZrO2. Physical Review Letters, 78(21):4063–4066, 1997.
- [17] A Togo, F Oba, and I Tanaka. First-principles calculations of the ferroelastic transition between rutile-type and CaCl2-type SiO2at high pressures. Physical Review B - Condensed Matter and Materials Physics, 78(13):1–9, 2008.
- [18] M Methfessel and AT Paxton. High-precision sampling for Brillouin-zone integration in metals. Physical Review B, 40(6):3616–3621, 1989.
- [19] ND Mermin. Thermal properties of the inhomogeneous electron gas. Physical Review, 137(5A):1–3, 1965.
- [20] K Momma and F Izumi. VESTA 3 for three-dimensional visualization of crystal, volumetric and morphology data. Journal of Applied Crystallography, 44(6):1272–1276, 2011.
- [21] MJ Gillan and PWM Jacobs. Entropy of a point defect in an ionic crystal. Physical Review B, 28(2):759–777, 1983.
- [22] A Walsh, AA Sokol, and CRA Catlow. Free energy of defect formation : Thermodynamics of anion Frenkel pairs in indium oxide. Physical Review B, 83:224105–9, 2011.
- [23] PWM Jacobs, MAH Nerenberg, J Govindarajan, and TM Haridasan. The entropy of formation of anion Frenkel defects in fluorites: a quasiharmonic calculation for calcium fluoride. Journal of Physics C: Solid State Physics, 15:4245–58, 1982.
- [24] VC Sahni and PWM Jacobs. A calculation of the vibrational entropy of anion Frenkel defects in fluorite crystals. Philosophical Magazine A, 46(5):817–827, 1982.
- [25] H Ihara, M Hirabayashi, and H Nakagawa. Electronic band strutures and xray photoelectron spectra of ZrC, HfC and TaC. Physical Review B, 14(4):1707–1714, 1976.
- [26] AS Borukhovich and PV Geld. Magnetic susceptibility and energy band structure of zirconium monocarbide. Physica Status Solidi, 36(1):97–102, 1969.
- [27] A Arya and EA Carter. Structure, bonding, and adhesion at the ZrC(100)/Fe(110) interface from first principles. Surface Science, 560(1-3):103–120, jul 2004.
- [28] DG Pettifor. Theory of energy bands and related properties of 4d transition metals. I. Band parameters and their volume dependence. Journal of Physics F: Metal Physics, 7(4):613–633, 1977.
- [29] M Jiang, JW Zheng, HY Xiao, ZJ Liu, and XT Zu. A comparative study of the mechanical and thermal properties of defective ZrC , TiC and SiC. Scientific Reports, 7(February):9344–14, 2017.
- [30] VI Ivashchenko, PEA Turchi, and VI Shevchenko. First-principles study of elastic and stability properties of ZrC-ZrN and ZrC-TiC alloys. Journal of physics. Condensed matter., 21(39):395503–8, 2009.
- [31] D Cheng, S Wang, and H Ye. First-principles calculations of the elastic properties of ZrC and ZrN. Journal of Alloys and Compounds, 377(1-2):221–224, 2004.
- [32] P T Jochym and K Parlinski. Ab initio lattice dynamics and elastic constants of ZrC. European Physical Journal B, 15(2):265–268, 2000.
- [33] C Xie, AR Oganov, D Li, TT Debela, N Liu, D Dong, and Q Zeng. Effects of carbon vacancies on the structures, mechanical properties, and chemical bonding of zirconium carbides: a first-principles study. Physical chemistry chemical physics : PCCP, 18(17):12299–12306, 2016.
- [34] R Chang and LJ Graham. Low-temperature elastic properties of ZrC and TiC. Journal of Applied Physics, 37(10):3778–3783, 1966.
- [35] C R F Azevedo. Selection of fuel cladding material for nuclear fission reactors. Engineering Failure Analysis, 18(8):1943–1962, 2011.
- [36] C Jiang, MJ Zheng, D Morgan, and I Szlufarska. Amorphization driven by defect-induced mechanical instability. Physical Review Letters, 111(15):155501–5, 2013.
- [37] Y Katoh, L L Snead, I Szlufarska, and W J Weber. Radiation effects in SiC for nuclear structural applications. Current Opinion in Solid State and Materials Science, 16(3):143–152, 2012.
- [38] L S Snead, T Nozawa, Y Katoh, T-S Byun, S Kondo, and D A Petti. Handbook of SiC properties for fuel performance modeling. Journal of Nuclear Materials, 371:329–377, 2007.
- [39] A C Marino, E L Losada, G L Demarco, and L Furlano. A SAFETY FUEL ELEMENT ASSESSMENT BY USING NEW MATERIALS AND ADVANCED MODELLING TOOLS. Technical report, 2015.
- [40] K J Geelhood and W G Luscher. FRAPCON-3.5: A Computer Code for the Calculation of Steady State Thermal-mechanical Behavior of Oxide Fuel Rods for High Burnup, 2014.
- [41] R Liu, W Zhou, and J Cai. Multiphysics modeling of accident tolerant fuel-cladding U3Si2-FeCrAl performance in a light water reactor. Nuclear Engineering and Design, 330:106–116, 2018.
- [42] R Devanathan, L Van Brutzel, A Chartier, C Guéneau, A E Mattsson, V Tikare, T Bartel, T Besmann, M Stan, and P Van Uffelen. Modeling and simulation of nuclear fuel materials. Energy and Environmental Science, 3(10):1365–1608, 2010.
- [43] EV Safonova, YP Mitrofanov, RA Konchakov, A Yu Vinogradov, NP Kobelev, and VA Khonik. Experimental evidence for thermal generation of interstitials in a metallic crystal near the melting temperature. Journal of Physics: Condensed Matter, 28(21):215401, 2016.
V Acknowledgements
T.A.M. and M.W.F. gratefully acknowledge the financial support of EPSRC Programme Grant (Grant No. EP/K008749/1) Material Systems for Extreme Environments (XMat), and is grateful to the UK Materials and Molecular Modelling Hub for computational resources, which is partially funded by EPSRC (EP/P020194/1). This work was funded under the embedded CSE 33 of the ARCHER UK National Supercomputing Service (http://www.archer.ac.uk). A.I.D. would like to thank the STFC Hartree Centre for supporting this effort by allowing human resource to be dedicated to this work. This work was in part supported by the STFC Hartree Centre’s Innovation: Return on Research programme, funded by the UK Department for Business, Energy & Industrial Strategy.
Appendix
Appendix A Ideal solution model
We derive an ideal solution model for ZrC based on the configurational entropy of the carbon sub-lattice. The articles of interest on the lattice are constitutional carbon vacancies (denoted ), bound Frenkel pairs (), and unbound Frenkel pairs (). The basis for counting combinations of these species is the number of perfect sites , the number of vacancies , bound pairs () and free interstitials (). The number of combinations or unordered selections without repetition is
Factors and account for the degeneracy of interstitial sites for bound pairs and unbound pairs, with counted with respect to carbon vacancy sites and with respect to carbon perfect lattice sites.
The first-order Stirling approximation is applied to the lattice configurational entropy
giving the expression
The Gibb’s free energy of the system of defects
is minimised with respect to the number of each type of defect
For bound pairs the configuration entropy term is
and for unbound pairs
The free energies to form bound and unbound pairs are given by
and
The concentrations () of each defect type are
and
For completeness the concentration of each sub-type of defect is stated explicitly. For bound pairs, the concentrations of dimer and trimer configurations are
and the concentrations of unbound Frenkel pairs of dimer, trimer and tetramer configurations are
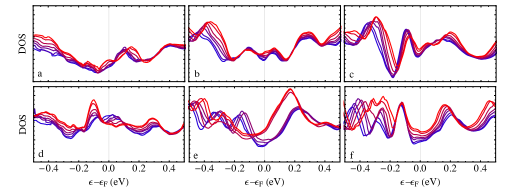
Appendix B Electron states
Fig. 4 in the main text shows the electron density of states for each defect on the interval [-0.5, 0.5] eV. The density of states is provided for interval [-6, 6] eV in Fig. 10.