Heart Rate Estimation from Ballistocardiography Based on Hilbert Transform and Phase Vocoder
Abstract
This paper presents a robust method to monitor heart rate (HR) from BCG (Ballistocardiography) signal, which is acquired from the sensor embedded in a chair or a mattress. The proposed algorithm addresses the shortfalls in traditional Fast Fourier Transform (FFT) based approaches by introducing Hilbert Transform to extract the pulse envelope that models the repetition of J-peaks in BCG signal. The frequency resolution is further enhanced by applying FFT and phase vocoder to the pulse envelope. The performance of the proposed algorithm is verified by experiment from 7 subjects. For HR estimation, mean absolute error (MAE) of 0.90 beats per minute (BPM) and standard deviation of absolute error (STD) of 1.14 BPM are obtained. Pearson correlation coefficient between estimated HR and ground truth HR of 0.98 is also achieved.
Index Terms:
Ballistocardiography; Hilbert Transfrom; phase vocoderI Introduction
Cardiovascular diseases (CVDs) are the leading factors of death according to a report from American Heart Association[1]. One way to alleviate negative consequence of CVDs is to provide in-home heart rate (HR) monitoring system that is convenient to use. Nowadays, various devices for heart rate measurement are available. However, the existing wearable solutions require the use to attach sensors on the body, which may irritate the skin and usually present discomfort to users[2, 3]. Our interest is to provide a non-intrusive and unobtrusive way to monitor HR in an in-home environment. Ballistocardiography (BCG) signal records the motions of human body generated by sudden ejection of blood into the vessels at every cycle. Such signal contains rich information, which can offer respiration rate and heart rate. An obvious attraction to users of BCG signal is that it can be directly obtained by sensor positioned under chair without any electrode attached to body. It provides a convenient, low cost, easy to use solution for HR monitoring at home. Therefore, BCG-based system becomes ideal for heart rate monitoring in natural in-home environment.
Many methods have been developed to calculate HR from BCG signal. One clustering approach (CA) was presented to detected J-peak from BCG as heartbeat[4]. It extracts three features from BCG signal, including J-peak and adjacent valley, as the input of k-means clustering with the number cluster of 2. The heartbeat class is considered as the cluster with the smaller number of objects while the other one is regarded as non-heartbeat class. Heart rate is calculated by time span between heartbeats. However, it results in erroneous heart rate estimation due to over-detected or missed heartbeats. One short-time energy (SEN) was proposed to estimate heart rate[5, 6]. The energy of BCG is calculated using short-time energy function. The peaks from energy waveform are located as heartbeats to obtain heart rate estimates. Nevertheless, it can not extract good quality of energy waveform when BCG signal shows irregular pattern. Paalasmaa et al.[7] proposed an adaptive method for HR estimation. It extractes heartbeat template from BCG and detects the points that best match the template as heartbeats. Heart rate is calculated through consecutive heartbeat intervals in one 30-s window. It needs many parameters to be tuned based on the dataset on which the algorithm is designed and tested. As a result, the performance can not be guaranteed on unknown signal. In [8], one zero phase bandpass filter with cutoff frequencies of 2 Hz and 7 Hz is first employed to preserve BCG power. BCG envelope is then extracted by applying low-pass Butterworth filter with cutoff frequency of 2 Hz. The peaks of envelope is detected for HR computaion. The envelope usally appears irregularly when BCG signal dose not have consistent pattern. Pino et al.[9] put forward multiple smoothed length transform (SLT) method for heart rate estimation from BCG. It selects four fixed windows for SLT computation. This information provides a search window for peak identification. Heart rate is obtained through detected peaks. However, it selects window sizes experimentally, hard to tackle the case with large range of heart rate. All methods above are based on time-domain to calculate heart rate, which are subject to noises caused by body movement.
In our work, we present a robust method, Hilbert Transform with Phase Vocoder (HTPV), for HR estimation from BCG sensors. Unlike previous works based on time domain to estimate HR, frequency information is used to estimate HR. We utilize Hilbert Transform (HT) to extract the envelope of BCG signal. Fast Fourier Transform (FFT) is used to calculate frequency spectrum of envelope. Frequency resolution is further increased using phase vocoder (PV) to obtain accurate HR value.
The rest of this paper is organised as follows. Section II describes the proposed method for HR estimation, including Hilbert Transform and phase vocoder. Section III details the experimental setup, metrics for evaluating the accuracy of methods and results. Conclusion is made in Section IV.
II Methodology
II-A Overall Architecture
A 30-s sliding window with increment step of 15 s is sliding on BCG signal. HR is estimated in each time window. The proposed method consists of two stages, Hilbert Transform and phase vocoder. Hilbert Transform is used to extract the envelope modelling the repetition of J-peak in BCG signal. The use of phase vocoder is to reduce frequency spacing. Heart rate is finally estimated in frequency domain. The overall architecture is shown in Fig.1.

II-B Hilbert Transform
It is not appropriate to estimate heart rate from direct Fourier Transform of BCG signal [10], especially for the BCG recorded from the sensors embedded in chair. This is because the embedded sensor does not generate the significant fundamental frequency corresponding to heart rate. In order to overcome this problem, we propose to use Hilbert Transform.
The chair-based BCG data is modelled as (1), composed of three components.
| (1) |
represents respiration signal described by sinusoid signal with frequency equal to respiration signal. is the pulse envelope that models the repetition of J-peak in BCG signal in the form of periodic pulse sequence. Its frequency spectrum mainly consists of harmonics, fundamental frequency of which corresponds to heart rate. can not be observed, only modulated with modulation frequency () is visible. denotes additive noises.
Respiration signal and additive noises can be removed by band-pass filter. In our work, we apply one band-pass filter with cutoff frequencies of 0.7 and 10 Hz since effective frequencies in BCG primarily lie in this range. The filter is constructed in forward and reverse directions to avoid phase distortion. Through this procedure, we get respiration-removed signal, as in (2).
| (2) |
The next step is to extract from modulated signal . In order to achieve this target, Hilbert Transform is used. As we know, HT yields a signal () that reserves amplitude information and introduces 90 degree phase shift of input signal. Therefore, analytical signal () is produced with input signal as real component and output of HT as imaginary component, which is given by (3).
| (3) |
When the noise is negligible and the frequency of is narrow in contrast to modulation frequency , is approximately equal to (4).
| (4) |
is thus acquired by taking the amplitude of , given by (5).
| (5) |
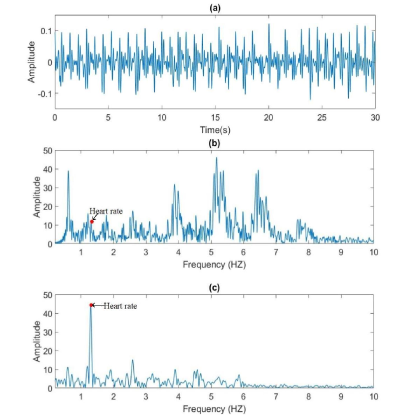
Fig.2 gives a representative example of the improvement of estimating frequency spectrum for HR estimation after extracting envelope using the proposed HT method. Fig.2 (a) shows a 30-s BCG signal. The frequency spectrum calculated by FFT for BCG is shown in Fig.2 (b). Obviously, the frequency with the largest amplitude deviates quite far from true HR. Therefore, frequency spectrum of BCG signal can not be straightly used to estimate HR. Fig.2 (c) demonstrates that frequency spectrum of envelope after HT primarily consists of the frequency corresponding to true HR and its harmonics, which offers effective information for HR estimation.
II-C Phase Vocoder
Fast Fourier Transform is first used to calculate the initial frequency spectrum () of envelope signal . However, the frequency resolution of FFT is limited by window size (30 s), which is equal to beat per minute (BPM). Zero-padding before FFT is thus used to interpolate spectrum signal to other frequencies so as to decrease frequency spacing between consecutive FFT bins. Apart from zero-padding, phase vocoder[11, 12, 13] is applied to further advance frequency resolution.
Phase vocoder estimates instantaneous frequency based on changes of phase. Phase changes of two successive frames encode the deviation of the true frequency from the bin center frequency. Therefore, instantaneous frequency can be computed using (6).
| (6) |
For discrete time signal, instantaneous frequency can be estimated using phase differencing operation defined in (7),
| (7) |
where are the time stamps of the current and previous frames, respectively. Here , is a window shift. are the two phases from two consecutive frames. is a positive integer. The series, , is calculated for several , and the value of closest to the initial frequency is selected as refined frequency as in (8).
| (8) |
Heart rate is estimated frame by frame. HR in the first frame is obtained by finding the frequency bin with the largest amplitude from initial frequency with the largest amplitude. Search range is set as 0.6-4 Hz since it is sufficient for heart rate range. Next heart rate is determined in the range that doest not differ from previous HR estimation more than 10 BPM. This controls HR variations between neighboring frames to be less drastic. The frequency bin index is first detected corresponding to the largest amplitude. At the same index, refined frequency is obtained and heart rate is estimated as .

| Subject | Time(Min) | HTPV(proposed) | SEN[5] | [8] | SLT[9] | ||||
| MAE (BPM) | STD (BPM) | MAE (BPM) | STD (BPM) | MAE (BPM) | STD (BPM) | MAE (BPM) | STD (BPM) | ||
| 1 | 18.64 | 0.37 | 0.51 | 0.49 | 0.58 | 0.47 | 0.49 | 1.12 | 1.39 |
| 2 | 13.74 | 0.91 | 1.21 | 1.62 | 3.82 | 1.11 | 0.84 | 0.78 | 1.33 |
| 3 | 14.72 | 1.07 | 1.43 | 1.50 | 2.10 | 2.30 | 2.94 | 1.87 | 1.98 |
| 4 | 18.64 | 1.16 | 1.27 | 2.57 | 2.82 | 4.86 | 7.92 | 3.83 | 3.54 |
| 5 | 14.72 | 0.67 | 1.21 | 2.18 | 3.73 | 5.12 | 8.00 | 1.50 | 2.08 |
| 6 | 17.06 | 1.07 | 1.09 | 1.09 | 1.70 | 0.87 | 1.12 | 0.82 | 1.10 |
| 7 | 13.74 | 1.06 | 1.25 | 1.56 | 2.33 | 3.56 | 4.41 | 1.32 | 2.44 |
| Mean | 15.89 | 0.90 | 1.14 | 1.57 | 2.44 | 2.61 | 3.67 | 1.57 | 1.90 |
III Experimental Results
III-A Experiment Setup
We simultaneously recorded one-channel BCG signal and an ECG signal from seven subjects. For every subject, BCG was recorded from chair-based sensor which is located under chair. ECG was also recorded from chest-based electrodes attached to the chest of subject. All signals were sampled with sampling frequency set to 225 Hz.
During data recording phase, the subject just sat on chair and maintained seating position unchanged. The postures can be changed, for instance, leaning against chair or bowing. The recording lasted approximately 15 minutes for every subject.
III-B Performance Metrics
For each time window, the heart rate from ECG signal is calculated as ground truth. The R-peaks in ECG are detected using Pan-Tompkins algorithm[14]. After that, the peaks are checked manually to guarantee all R-peaks are accurately detected. Given one frame, we calculate mean R-R time interval and then HR is computed as .
Mean absolute error (MAE) and standard deviation of absolute error (STD) are used to assess the performance of the proposed method, which are given by (9) and (10).
| (9) |
| (10) |
Denoted by is the heart rate derived from ECG signal in the -th frame, and denoted by is the estimated heart rate from BCG signal.
Bland-Altman plot[15], as the third assessment index, is used to measure the agreement between estimates and ground truth. It gives the difference for every estimate against the average of ground truth and estimate. In our study, we calculate the mean absolute error 1.96 standard deviation of the absolute error ([Mean-1.96STD, Mean+1.96STD]), which contains 95 of difference. Pearson correlation coefficient is also used to assess accuracy.
III-C Results
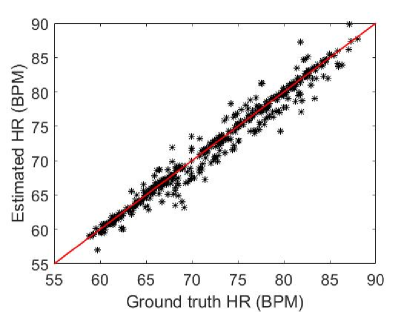
Table I gives MAE and STD for every subject using the proposed method. The methods from [5, 8, 9] are implemented as well. MAE and STD using these methods for HR estimation are also listed in Table I. It shows that the proposed HTPV obtains the best accuracy, MAE of 0.90 BPM and STD of 1.14 BPM. Shown in Fig.3 is estimated HR from BCG versus ground truth HR from ECG, and of 0.98 between estimated HR and ground truth is achieved. Fig.4 shows Bland-Altman plot between the difference and average of ground truth and estimates.
IV Conclusion
In this paper, we present a simple but effective method for heart rate estimation based on BCG signal obtained from sensors embedded in a chair. Hilbert Transform is used to extract pulse envelope. After that, phase vocoder is applied to increase frequency resolution estimated by FFT. Heart rate is finally calculated based on frequency domain. The proposed method achieves MAE of 0.90 BPM, STD of 1.14 BPM, of 0.98. Compared to [5, 8, 9], the proposed method has better accuracy.
References
- [1] E. J. Benjamin, M. J. Blaha, S. E. Chiuve, M. Cushman, S. R. Das, R. Deo, J. Floyd, M. Fornage, C. Gillespie, C. Isasi, et al., “Heart disease and stroke statistics-2017 update: a report from the american heart association,” Circulation, vol. 135, no. 10, pp. e146-e603, 2017.
- [2] A. J. Bandodkar and J. Wang, “Non-invasive wearable electrochemical sensors: a review,” Trends in Biotechnology,” vol. 32, no. 7, pp. 363-371, 2014.
- [3] A. Galli, G. Frigo, C. Narduzzi, and G. Giorgi, “Robust estimation and tracking of heart rate by ppg signal analysis,” in Instrumentation and Measurement Technology Conference, pp. 1-6, 2017.
- [4] L. Rosales, M. Skubic, D. Heise, M. J. Devaney, and M. Schaumburg, “Heartbeat detection from a hydraulic bed sensor using a clustering approach,” in Engineering in Medicine and Biology Society, pp. 2383- 2387, 2012.
- [5] K. Lydon, Y. S. Bo, L. Rosales, M. Enayati, K. C. Ho, M. Rantz, and M. Skubic, “Robust heartbeat detection from in-home ballistocardiogram signals of older adults using a bed sensor,” in Engineering in Medicine & Biology Society, p. 7175-7179, 2015.
- [6] D. E. Arias, E. J. Pino, P. Aqueveque, and D. W. Curtis, “Unobtrusive support system for prevention of dangerous health conditions in wheelchair users,” Mobile Information Systems, vol. 2016, no. 7, pp. 1-14, 2016.
- [7] J. Paalasmaa, H. Toivonen, and M. Partinen, “Adaptive heartbeat modelling for beat-to-beat heart rate measurement in ballistocardiograms,” IEEE Journal of Biomedical & Health Informatics, vol. 19, no. 6, p. 1945, 2015
- [8] J. Gomez-Clapers, R. Casanella, and R. Pallas-Areny, “A novel algorithm for fast bcg cycle extraction in ambulatory scenarios,” in Computing in Cardiology Conference (CinC), 2016, pp. 357-360, 2016.
- [9] E. J. Pino, J. A. P. Chavez, and P. Aqueveque, “Bcg algorithm for unobtrusive heart rate monitoring,” pp. 180-183, 2017.
- [10] J. Alamets¨a, A. Palom¨aki, and J. Viik, “Local ballistocardiographic spectrum studies from signals obtained from limbs and carotid artery with an emfi sensor induced with a tilt table,” in Engineering in Medicine and Biology Society (EMBC), 2013 35th Annual International Conference of the IEEE, pp. 7008-7011, 2013.
- [11] J. L. Flanagan and R. Golden, “Phase vocoder,” Bell Labs Technical Journal, vol. 45, no. 9, pp. 1493-1509, 1966.
- [12] M. S. Puckette and J. C. Brown, “Accuracy of frequency estimates using the phase vocoder,” IEEE Transactions on Speech and Audio Processing, vol. 6, no. 2, pp. 166-176, 1998.
- [13] S. F. Cotter, B. D. Rao, K. Engan, and K. Kreutz-Delgado, “Sparse solutions to linear inverse problems with multiple measurement vectors,” IEEE Transactions on Signal Processing, vol. 53, no. 7, pp. 2477-2488, 2005.
- [14] J. Pan and W. J. Tompkins, “A real-time qrs detection algorithm,” IEEE Transactions on Biomedical Engineering, vol. BME-32, no. 3, pp. 230-236, 1985.
- [15] J. M. Bland and D. G. Altman, “Agreement between methods of measurement with multiple observations per individual,” Journal of Biopharmaceutical Statistics, vol. 17, no. 4, pp. 571-582, 2007.