Counter-intuitive behaviour of energy system models under CO2 caps and prices
Abstract
The mitigation of climate change requires a fundamental transition of the energy system. Affordability, reliability and the reduction of greenhouse gas emissions constitute central but often conflicting targets for this energy transition. Against this context, we reveal limitations and counter-intuitive results in the model-based optimization of energy systems, which are often applied for policy advice. When system costs are minimized in the presence of a CO2 cap, efficiency gains free a part of the CO2 cap, allowing cheap technologies to replace expensive low-emission technologies. Even more striking results are observed in a setup where emissions are minimized in the presence of a budget constraint. Increasing CO2 prices can oust clean, but expensive technologies out of the system, and eventually lead to higher emissions. These effects robustly occur in models of different scope and complexity. Hence, extreme care is necessary in the application of energy system optimization models to avoid misleading policy advice.
keywords:
energy system model , optimization , CO2 cap , CO2 tax1 Introduction
The mitigation of climate change requires a fundamental transition of the energy system. Currently, 65% of all greenhouse gas emissions are caused by the carbon dioxide (CO3) emissions from fossil fuel combustion and industrial processes [1], such that a rapid decarbonisation of the energy sector is inevitable to meet the 2∘C goal of the Paris agreement [2, 3, 4, 5, 6]. Fossil fuelled power plants must be replaced by renewable sources such as wind turbines and solar photovoltaics, whose costs are becoming more and more competitive [7, 8, 9, 10]. One of the largest challenges of this transition concerns the security and reliability of the energy supply, which is crucial for industry, economy and infrastructure operation [11, 12, 13, 14] as well as the public acceptance of the transition [15]. Wind and solar power generation are inherently fluctuating [16, 17, 18], and suitable locations are often far away from the centers of the load [19, 20, 21]. The design of a future energy system must respect these constraints to guarantee a sustainable and reliable supply at affordable costs [3, 9, 22, 23].
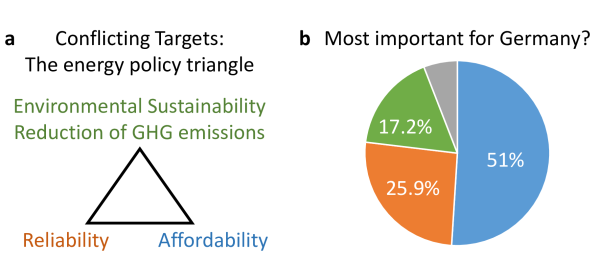
Affordability, reliability and environmental sustainability constitute central targets for energy policy, with the reduction of greenhouse gas (GHG) emissions being the most urgent environmental target (Fig. 1a). This set of targets is commonly referred to as the energy policy triangle. It forms the basis for the energy strategy of the European Union [24, 25] and is widely supported by the public. A representative survey in Germany shows that half of the population ranks affordability as the most important goal, but reliability and reduction of GHG emissions are also named as first priority frequently (Fig. 1b). However, the three targets are often conflicting, so that the triangle becomes a trilemma [26]. None of these targets can be abandoned or singled out to the exclusion of the others. As a result, balancing the targets and resolving conflicts between them is at the heart of energy system analysis and energy policy.
A variety of approaches has been put forward to assess and optimize energy systems based on these targets. Modelling approaches range from purely technical through techno-economic to predominantly economic models and most recently socio-technical models [27, 28, 29]. They differ in scales, system boundaries and level of detail. Among these modelling approaches, the class of techno-economic optimization under constraints is particularly wide-spread [30, 31, 32, 33, 27, 28]. Conflicting targets can be integrated using a specific weighting scheme or via constrained optimization. The results of such models are often fed directly into the political decision making process.
Against this context, we reveal limitations and counter-intuitive results in the techno-economic optimization of energy systems. We show that in a common emission-constrained cost optimizing model, the improvement of a technology can impede its utilization – an effect that may discourage innovations and investments. Even more striking, emission minimization in the presence of a budget limit can lead to effects reminiscent of Giffen’s paradox in microeconomics [34, 35]. In such a context, the increase of effective CO2 costs can lead to higher CO2 emissions.
We illustrate these findings for three energy system optimization models of different scope and complexity. We first consider an elementary model to reveal fundamental interactions of different constraints and objectives, then we show that effects manifest both in a short-term electricity sector model and a long-term integrated energy system model and draw some key conclusions.
2 Methods
In this article, we analyze the effects caused by target conflicts for three different energy system optimization models. We first consider a very stylized model to introduce the basic phenomena and then consider a detailed electricity sector model and an integrated energy system model. All types of models operationalize the three central targets of energy policy as follows:
-
1.
Affordability: Reduce total system costs ,
-
2.
Sustainability: Reduce total GHG emissions ,
-
3.
Reliability: Satisfaction of demand (all models) plus model specific constraints such as power grid stability.
In an energy system optimization model one of the first two targets is promoted to the objective function which is minimized, while the other targets are included via constraints.
We consider different combinations of objectives and constraints to explore fundamental problems arising from conflicting targets. In addition to the generic cost minimization, we also explore a hypothetical setting where emissions are minimized. Hence, we obtain the two cases:
-
1.
Case A: Minimization of total system costs with a hard emission cap and reliability constraints
-
2.
Case B: Minimization of total emissions with a budget cap and reliability constraints
2.1 Elementary Model
We first consider an elementary decision problem, including only two fossil fuels used for electricity generation: one cheap type with high specific CO2 emissions (e.g. lignite) and one expensive type with low specific CO2 emissions (e.g. natural gas). The model then optimizes the energy mix, i.e. the total electricity generation from the two fuel types per period.
| Unit | Lignite | Gas | |
|---|---|---|---|
| Euro/MWh | 5.40 | 36.30 | |
| % | 45 | 56 (case B) | |
| Euro/t | 15 (case A) | 15 (case A) | |
| t/MWhth | 0.41 | 0.202 | |
| Euro/MWh | - | 3 | |
| Euro/MWh | 1.65 | 0.5 |
The model implements the reliability target via a hard constraint: The electricity demand per period must always be satisfied, such that we have the inequality
| (1) |
Furthermore, the model seeks to optimize the total system costs and total CO2 emissions:
| (2) | ||||
| (3) |
where denotes the variable costs and the specific CO2 emissions for the two fuel types. Throughout this paper, we focus on CO2 emissions, as these are the main contributor to climate change. Other greenhouse gases can readily be included in terms of CO2 equivalents. We either optimize the costs in the presence of an emission cap (case A) or the emissions in term of a budget cap (case B).
The parameters used in our study are calculated as follows. The variable costs consist of costs for fuel (fc), CO2 emissions, maintenance and operating materials:
| (4) |
Fuel costs are given using the lower heating value (lhw). They thus depend on the net efficiency , which is varied for gas in case A:
| (5) |
The costs for CO2 emissions depend on the CO2 certificate price , which we vary in case B, and on the emissions per generated MWh of electricity:
| (6) |
with being the electricity specific emissions. The single parts of the variable costs are derived from the values listed in Table 7.12 and Example 7.4 in [37] and are summarized in Table 1.
We assume a fixed installed capacity for each power plant type and choose it such that one type can meet the demand without the other. Hence, if = 0, then and vice versa.
The constraint is chosen such that the optimization problem is always solvable and non-trivial. Thus, in case A we choose equal to the maximum specific emissions of gas:
| (7) |
A higher value would allow for more lignite in the system and would lead to the trivial solution with only lignite being used for all . Similarly, the CO2 price is chosen to be low enough to avoid gas being substituted for coal on a cost basis, which would lead to the trivial solution with only gas being used in all cases.
In case B, we set equal to the minimum variable costs of the highest CO2 certificate price, i.e.
| (8) | ||||
A higher budget constraint would allow for more gas in the system and choosing would lead to the trivial solution that only gas is used for all CO2 certificate prices. Similarly, a sufficiently high CO2 price would also cause coal to be replaced by gas, provided that the budget would be high enough for this solution to be feasible.
2.2 Electricity System Model PyPSA
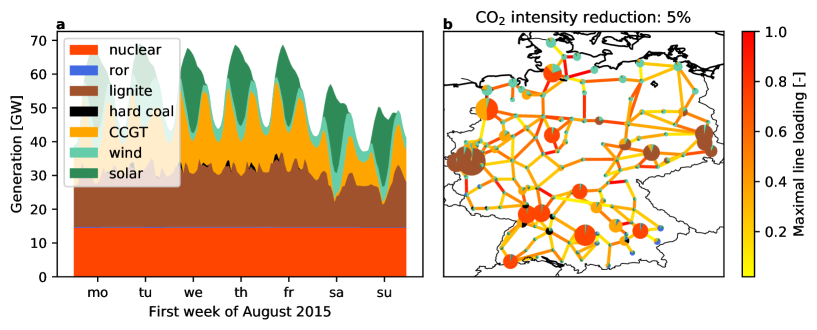
The electricity sector model PyPSA optimizes the operation of a representation of the German power system for the year 2015 with a high spatial and temporal resolution. The model includes conventional and renewable power generators, pumped hydro storage units, transmission lines and the electrical demand. The dispatch of power plants and storage as well as a potential curtailment of renewable sources is optimised hourly for the full year using nodal pricing, guaranteeing that no transmission lines are overloaded and thus approximating the current system after market clearing and redispatch (but excluding energy trading with neighbouring countries). An exemplary optimization result for one weak is shown in 2a.
| Unit | Nuclear | CCGT | OCGT | Hard Coal | Lignite | |
|---|---|---|---|---|---|---|
| 3.0 | 21.6 | 21.6 | 8.4 | 2.9 | ||
| 10.0 | 4.0 | 3.0 | 6.0 | 7.0 | ||
| % | 33.7 | 61.0 | 39.0 | 46.4 | 44.7 | |
| 0.000 | 0.181 | 0.181 | 0.336 | 0.333 |
The power system data corresponds to the German part of the European model PyPSA-Eur [39], implemented in the PyPSA modelling framework [40]. The software and all data are freely available online [41]. The hourly demand profiles are taken from the European Network of Transmission System Operators for Electricity (ENTSO-E) website [42]; the power plant database comes from the Open Power System Data (OPSD) project [43]; the transmission grid data are based on the ENTSO-E interactive map [44] extracted by the GridKit toolkit [45] and then clustered down to 128 major substations following the methodology in [46]; the generation of time series for wind and solar power uses the methodology from [47]. The fuel costs, efficiencies and variable operation and maintenance (VOM) costs for conventional power plants are taken from [38] and listed in Table 2. VOM costs for CCGT and OCGT refer to new installations, which are significantly lower than for older plants in the existing generation fleet. Solar, onshore and offshore wind and run-of-river are assumed to have zero variable costs.
Several reliability constraints are implemented: in each time step the demand at each substation must be satisfied and transmission lines may not be overloaded (cf. figure 2b). To approximate the network security constraint, it was enforced that no transmission line was ever loaded above 70% of its thermal rating.
For case A, the CO2 emissions cap was set by taking a 40% reduction in emissions compared to the unconstrained cost minimum. This yields a cap of 112 Mt for the year. We study a technological development, that results in a reduction in CO2 intensity for each technology, where a reduction of 0.1 results in the CO2 emissions being reduced by 10%. It is assumed that the efficiency is unchanged in order to isolate the effects of the reduction in carbon intensity on the model. Such a reduction of emissions can be realized with Carbon Capture and Storage (CCS). A reduction by 10% would then correspond to the average over the entire generation fleet of one type, where reductions for different plants may well vary. CCS typically leads to a reduction of efficiency, which is not considered as described above.
The fixed budget for case B was derived by minimizing the system costs within the model assuming a CO2 price of 50 Euro/t. Hence, no feasible solution can be found above 50 Euro/t.
2.3 Energy System Model IKARUS
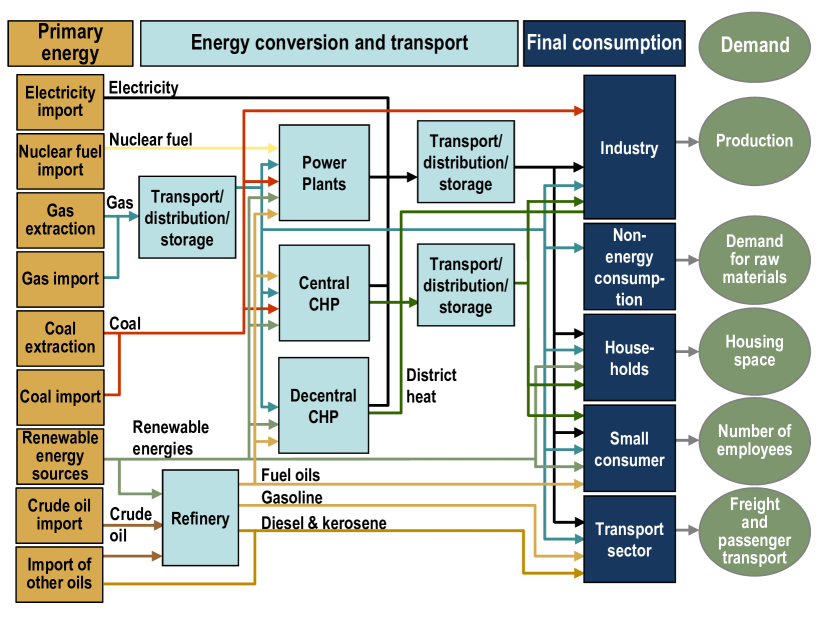
We utilize the energy system model IKARUS [48, 49, 29] which depicts the whole German energy system ranging from primary energy supply across conversion and transport of energy carriers to final energy demand in a technology rich way (some thousand technologies), cf. Figure 3. The underlying linear optimization model consists of energy and material flow balances complemented by constraints and further user defined equations. Typically, it is applied to long-term time horizons (currently up to 2050). IKARUS represents Germany as one region and inter-annual variations are included with representative time slices combined with basic heuristics for backup needs in order to guarantee the security of supply.
We chose a current policies scenario framework for all cases analysed here, which takes all already decided policies into account. This comprises especially several energy related laws in Germany, like the German Energy Saving Ordinance (EnEV) or the Renewable Energy Sources Act (EEG). A more detailed description of the included legally binding constraints can be found in [32, 50]. No political intentions or goals are taken into account in this type of scenario framework. Fuel prices are assumed in accordance to the World Energy Outlook 2016 (450ppm scenario) [51], but as we apply our model for this analysis only to 2020, impacts of fuel price pathways are limited. The electricity exchange is fixed exogenously to avoid mixing effects in the obtained results for this analysis. In addition we assume that the CO2 price is valid for the whole energy system in contrast to the current EU emission trading system in order to get around possible inter-sectoral effects between EU-ETS and Non-EU-ETS sectors and to allow to identify the counter-intuitive effects more clearly.
The fixed budget for case B was derived by minimizing the system costs within IKARUS assuming a CO2 price of 50 Euro/t. Hence, no feasible solution can be found above 50 Euro/t. This value was chosen as it is substantially higher than the current price level of below 10 Euro/t [52].
The year 2020 was chosen as (i) it allows us to use a current policies scenario, (ii) there will still be a substantial share of fossil based fuels left in the energy system and (iii) it is before the complete nuclear phase-out in Germany (2022) such that mixing effects can be avoided.
3 Results
3.1 Fundamental Model
We first introduce the basic setup and phenomena for the elementary decision problem described in section 2.1 before turning to more complex models. Suppose that a country uses two types of fossil fuels for electricity generation: one cheap type with high specific CO2 emissions (e.g. lignite) and one expensive type with low specific CO2 emissions (e.g. natural gas). What is the optimal operation of this electricity system with respect to the three conflicting targets reliability, affordability and reduction of CO2 emissions (cf. Fig. 1)?
Techno-economic energy system models typically optimize one of the targets while constraints are imposed to the remaining targets. Probably the most common approach is to minimize the total system costs leading to the optimization problem
| case A: | (9) | |||
with quantities defined in the methods section 2.1. Alternatively, one can minimize the total emissions while a budget constraint is applied leading to the optimization problem
| case B: | (10) | |||
In both cases, the conflict of targets expressed by objectives and constraints can lead to paradoxical effects. This can result in misleading advice for the regulation and governance of the energy system.
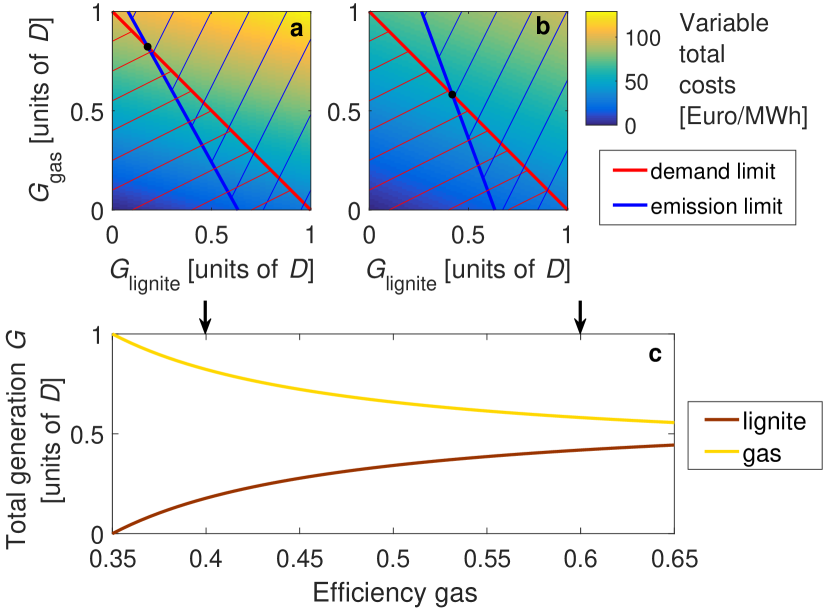
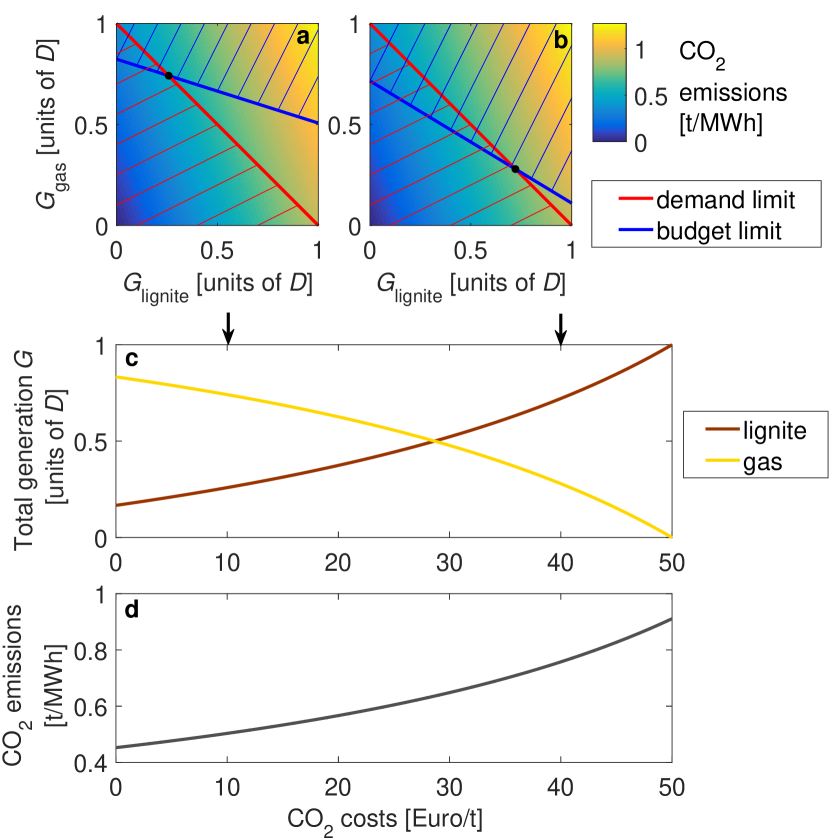
Let us first consider case A, whose structure is illustrated in Fig. 4a. The emission and reliability constraints exclude many possible combinations of and , leaving only a small feasible region in configuration space. Minimizing costs favors lignite, having low variable costs, over natural gas, having high variable costs. Thus, the optimal solution is found at the right-most point of the feasible region, which is given by the intersection of the demand line and the emission line.
Consider now a technological development, which could allow for emission reductions. Intuitively, one might expect that such a technology is extensively used if the development is cheap enough – but this expectation can be highly misleading. Assuming that the efficiency of natural gas-fired power plants can be improved without any additional costs, we observe a striking effect on the optimal solution shown in Fig. 4b. The specific emissions decrease such that the emission line moves to the right. Thus, the intersection point of the emissions and demand lines also moves to the right, resulting in a system optimum that contains more lignite and less natural gas. The technological improvement of gas-fired power plants essentially frees a fraction of the CO2 cap, which is not used for climate protection but for cost reduction favouring lignite. As a consequence, the share of gas in the energy mix decreases monotonically with the efficiency of gas-fired power plants (Fig. 4c). Increasing the efficiency of lignite-fired power plants also relieves the CO2 cap and thus leads to a reduced usage of gas-fired power plants, too.
Constrained optimization can thus lead to a paradoxical effect in energy systems planning: The improvement of a technology may impede its utilization. Such an effect could counter-act incentives for technological innovations and must be compensated by suitable policy measures. In particular, emission caps should be updated either directly or via price-feedback mechanisms. Similar effects are known in cap-and-trade schemes, where technological innovations to reduce emissions simply reduce the price of pollution permits, thus making it cheaper for higher emitters to pollute [53], see also the review [54]. This has led to declines in technological innovation for sulfur dioxide and nitrogen oxide cap-and-trade systems [55].
The paradoxical effects are even more apparent when emissions are minimized in the presence of a budget constraint (case B). Figure 5a illustrates the structure of the optimization problem – the system optimum is found at the intersection of the demand line and the budget line. An increase in effective CO2 costs via certificates or taxes [56, 57, 58, 59] has a dramatic effect as shown in Fig. 5b. The budget line moves downwards such that the intersection of budget and demand line moves to the bottom right in configuration space – the system optimum contains more lignite and less gas. In other words: The increase of CO2 costs consumes a part of the restricted budget. In order to compensate for this, expensive natural gas is replaced by cheap lignite.
The paradoxical consequences become most visible in Fig. 5c and d. Increasing CO2 costs in the presence of a budget constraint leads to a higher utilization of lignite and thus to higher CO2 emissions. In a real-world setting, such a paradoxical behavior could lead to a complete misdirection of the energy transition – but only in the presence of a strict budget constraint. In conclusion, a regulatory setting as described here should definitely be avoided (see Discussion).
The observed effect is reminiscent of Giffen’s paradox in microeconomics [34, 35]: The demand for an inferior good (here: lignite) increases with increasing prices. This is in sharp contrast to our everyday observations formalized in the law of demand that holds for normal goods. Indeed, empirical evidence for a Giffen-type behaviour in real markets has been strongly debated so far (see, e.g. [34, 60]).
3.2 Electricity Sector Model
The paradoxical effects introduced above become manifest in realistic energy system models. We first consider the electricity sector model PyPSA introduced in section 2.2. The operation of conventional generators, storage facilities and curtailment of renewable power sources is optimized given a time series for the electricity demand and renewable power availability, respecting power grid reliability constraints (see methods section 2.2 for details).
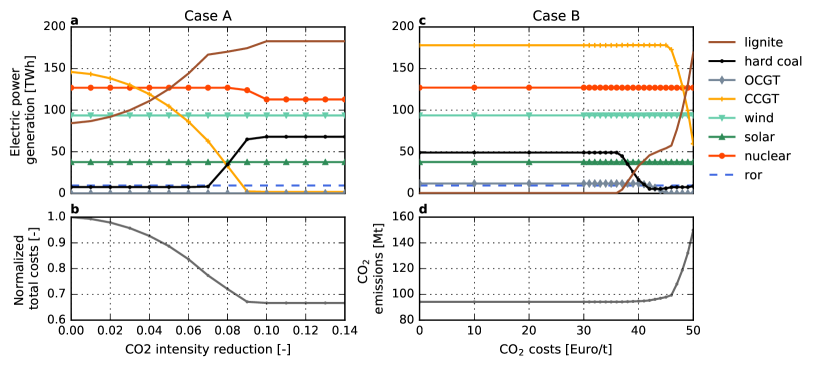
We first consider the minimization of total system costs in the presence of a strict cap for CO2 emissions (case A). The system optimum is shown in Fig. 6a and b as a function of the “CO2 intensity reduction”, where an intensity reduction of 0.1 corresponds to 10 % less CO2 emissions per MWhth for each technology, spread across the generation fleet.
We find that the utilization of natural gas (combined cycle gas turbine, CCGT) rapidly drops to zero when the CO2 intensity is reduced. First, gas is replaced by lignite, then by hard coal, until it is replaced completely for CO2 intensity reductions of approximately 9%. Remarkably, the share of nuclear energy also decreases slightly.
The detailed simulation of the electricity system thus confirms the paradoxical results outlined above: A reduction in the CO2 intensity frees a fraction of the emission cap, which is not used for climate protection, but for cost reduction. The minimization of system costs always favors fuels with lower variable costs (see Table 2 for the PyPSA costs), such that lignite and hard coal replace natural gas in the energy mix. Renewables, which have no variable costs, are not affected at all. In conclusion, a technological development reducing CO2 emissions can have quite unintended consequences in the electricity system.
We further simulate case B, where the total emissions are minimized in the presence of a fixed budget constraint. Optimization results are shown in Fig. 6c and d as a function of effective CO2 costs, implemented via taxes or certificates. We find that moderate CO2 costs up to 36 Euro/t have no effect on the system optimum. Increasing the costs further introduces a dramatic shift in the energy mix. First, cheap lignite replaces hard coal, then open cycle gas turbines (OCGT) and finally combined cycle gas turbines (CCGT) to meet the budget limit. For CO2 costs above 50 Euro/t the optimization problem becomes infeasible by model design – no solution can be found that comprises the given budget limit. As the variable costs for renewables are zero, they are not affected here. We thus confirm the Giffen-like behaviour outlined above: The increase of CO2 costs in the presence of a budget limit leads to a higher utilization of CO2-intense technologies.
Our results reveal the decisive role of constraints in energy systems optimization. Technological improvements in the presence of a CO2 cap (case A) can lead to a higher utilization of inferior technologies (such as lignite) if constraints (here: the CO2 cap) are not adjusted adequately. In contrast, when minimizing the CO2 emissions in the presence of a budget constraint (case B), increasing CO2 costs may paradoxically lead to an increase of actual CO2 emissions. This is because the system optimum is mainly determined by the budget and demand constraints and only a small feasible region is left in configuration space to minimize the objective function.
3.3 Integrated Energy System Model
Paradoxical effects are further analysed using the integrated energy system model IKARUS introduced in section 2.3. IKARUS is specially adapted to study the impact of national policy measures affecting the whole energy system such as budget limits, taxes or certificates. While the effects of strict pollutant caps have been discussed before [53, 55], we here focus on minimizing overall CO2 emissions with a given budget constraint (case B) and study cross-sectoral impacts of increasing effective CO2 prices in the following. We assume that these prices apply to the entire energy system, not just the electricity sector.
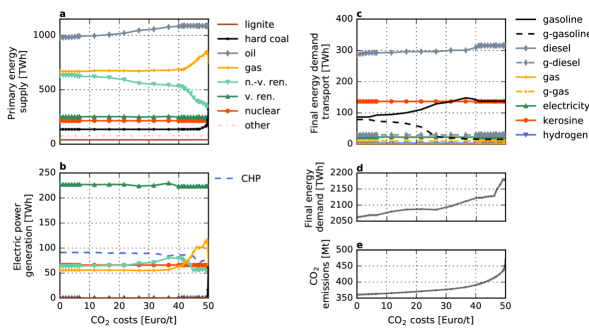
It is found that increasing CO2 prices leads to a decreasing usage of non-volatile renewables (here: biomass) in the primary energy supply, which are replaced by energy carriers with higher specific emissions such as gas, oil and eventually coal throughout different sectors (Fig. 7a). In the transport sector, synthetic fuels are replaced by conventional fossil fuels already for moderate CO2 prices (Fig. 7b). The electricity sector shows a row of shifts: first from combined heat-and-power (CHP) plants to non-volatile renewables, then from non-volatile renewables to natural gas, and finally from gas to hard coal. Notably, CHP power plants also change their fuel mix with increasing CO2 prices: They are predominantly fuelled by biomass and waste at lower prices and by waste, natural gas and hard coal at higher prices. The usage of volatile renewable energy sources and nuclear energy as well as process based fuel demand (e.g. due to steam demand of industry processes) are not significantly affected by CO2 prices, because they have no CO2 emissions or cannot be substituted easily (e.g. the steam demand in industry).
In addition to the usage of energy carriers, the efficiency of technologies plays a major role in the integrated energy system model IKARUS. CHP is a prime example as it enhances the efficient use of primary energy carriers by providing heat and electric power simultaneously. With increasing CO2 prices no budget is left for the implementation of expensive efficiency measures. Less efficient technologies have to be used such that total CO2 emissions increase (Fig. 7e).
Finally, both the substitution and the efficiency effects contribute to an increase in the final energy consumption and the total CO2 emissions with increasing CO2 prices (Fig. 7d and e) as reported before. Hence, our results confirm the decisive role of constraints in energy systems optimization revealed by the previous described elementary and electricity sector models.
4 Discussion
The realization of a sustainable, affordable and reliable energy supply is a major technological and political challenge. Techno-economic optimization models are central tools for the planning and analysis of future energy systems. Frequently, different energy policy targets are translated into one objective function and several constraints. In this paper, we have demonstrated several surprising optimization results arising from the interactions between these targets.
When system costs are minimized in the presence of a cap, efficiency gains may have counter-intuitive effects. An increase in efficiency frees a part of the cap, allowing cheap high-emission technologies to replace low-emission technologies. This mechanism could impede incentives for a technological development such that an adequate adjustment of the CO2 cap is be needed. These aspects should be kept in mind in the discussion about appropriate policy measures to reduce emissions, in particular in the decision for cap-and-trades versus taxes.
Even more striking results are observed when emissions are minimized in the presence of a budget constraint. Increasing CO2 prices can oust clean, but expensive technologies out of the system, and eventually lead to higher emissions. To our knowledge such a fixed budget is currently not implemented in any free energy market, but some forms of caps have been repeatedly demanded in political discussions: Energy price caps have been suggested in Austria [61, 62] and the United Kingdom [63], where they even appeared in the governing Conservative party’s 2017 election manifesto [64] and are likely to be implemented by the end of 2018 [65] (see appendix for exact quotes). Our results show that such a budget limit is incompatible with taxes or certificates, in the sense that the interference of both measures can drive the energy transition into an unwanted direction. Hence, more effective regulatory means should be applied.
We conclude that extreme care is necessary in the design and interpretation of energy systems optimization models as every constraint can have a decisive impact on the result. The transparency of such models must be improved [66, 67, 68] and the complex interactions of different regulatory measures implemented via caps or prices must be thoroughly analysed and respected in any policy advice.
Appendix
Here we give more details on the political claims for a (partial) limitation of the energy budget or electricity prices mentioned in the discussion:
Retail electricity prices were capped in California for several years, which contributed to the 2000/01 Western US Energy Crisis [69].
On the 26.11.2003, the vice president of the Wirtschaftskammer Österreich (Austrian chamber of commerce) claimed a ”Deckelung der Energiekosten in der Industrie”. The press release is available on the website of the Austrian Press agency APA at [61].
The president of the Austrian Industriellenvereinigung (Industry Association) claimed during a press conference on 8.11.2004 ”das Einziehen eines Gesamtdeckels für Energiekosten - inklusive Kosten für den Emissionshandel und der Energiesteuer - sowie der Ausbau des Leitungsnetzes und der Stromerzeugung in Österreich.” The original quote and a further discussion are available from the website of the Austrian Press agency APA at [62].
In 2013, the head of the British labour party Ed Miliband said that ”Labour would freeze gas and electricity bills for every home and business in the UK for 20 months if it wins the 2015 election”. The quote and the original video are available from the website of the British Broadcasting Corporation BBC, dated 24.9.2013, available online at [63].
In 2014, the prime minister of the German federal state Bavaria, Horst Seehofer, proposed an upper limit for the subsidies for renewable energy sources at eight Euro Cent per kWh: ”Etwa acht Cent wäre eine Zahl, über die man mal reden muss”. The original quotes and a further discussion are available from the website of the newspaper Sueddeutsche Zeitung, dated 11.3.2014, online at [70].
The British conservative party proposed an absolute tariff cap in its 2017 election manifesto: ”We will introduce a safeguard tariff cap that will extend the price protection currently in place for some vulnerable customers to more customers on the poorest value tariffs” [64]. The initiative of the Conservative party is supported by the British Parliament and thus likely to be implemented. A pre-legislative scrutiny of the draft Domestic Gas and Electricity (Tariff Cap) Bill by a committee of the House of Commons concludes: ”These repeated failures have led us to support the Government’s initiative to set a temporary absolute price cap on standard variable and default tariffs” [65].
Acknowledgments
We gratefully acknowledge support from the Helmholtz Association via the joint initiative “Energy System 2050 – A Contribution of the Research Field Energy”, the grant no. VH-NG-1025 to D.W. and grant no. VH-NG-1352 to T.B.
References
- IPCC [2014] IPCC, Climate Change 2014: Mitigation of Climate Change. Contribution of Working Group 3 to the Fifth Assessment Report of the Intergovernmental Panel on Climate Change, Cambridge University Press, Cambridge, United Kingdom, 2014.
- UNFCCC [2015] UNFCCC, Adoption of the Paris Agreement. Report No. FCCC/CP/2015/L.9/Rev.1, http://unfccc.int/resource/docs/2015/cop21/eng/l09r01.pdf, 2015.
- Rogelj, Joeri and Luderer, Gunnar and Pietzcker, Robert C and Kriegler, Elmar and Schaeffer, Michiel and Krey, Volker and Riahi, Keywan [2015] Rogelj, Joeri and Luderer, Gunnar and Pietzcker, Robert C and Kriegler, Elmar and Schaeffer, Michiel and Krey, Volker and Riahi, Keywan, Energy system transformations for limiting end-of-century warming to below 1.5∘C, Nature Climate Change 5 (2015) 519–527.
- Rogelj et al. [2016] J. Rogelj, M. Den Elzen, N. Höhne, T. Fransen, H. Fekete, H. Winkler, R. Schaeffer, F. Sha, K. Riahi, M. Meinshausen, Paris agreement climate proposals need a boost to keep warming well below 2∘C, Nature 534 (2016) 631–639.
- Rockström et al. [2017] J. Rockström, O. Gaffney, J. Rogelj, M. Meinshausen, N. Nakicenovic, H. J. Schellnhuber, A roadmap for rapid decarbonization, Science 355 (2017) 1269–1271.
- Rogelj et al. [2017] J. Rogelj, O. Fricko, M. Meinshausen, V. Krey, J. J. Zilliacus, K. Riahi, Understanding the origin of paris agreement emission uncertainties, Nature Communications 8 (2017) 15748.
- Jacobson and Delucchi [2011] M. Z. Jacobson, M. A. Delucchi, Providing all global energy with wind, water, and solar power, part i: Technologies, energy resources, quantities and areas of infrastructure, and materials, Energy policy 39 (2011) 1154–1169.
- Delucchi and Jacobson [2011] M. A. Delucchi, M. Z. Jacobson, Providing all global energy with wind, water, and solar power, Part II: Reliability, system and transmission costs, and policies, Energy Policy 39 (2011) 1170–1190.
- Chu and Majumdar [2012] S. Chu, A. Majumdar, Opportunities and challenges for a sustainable energy future, Nature 488 (2012) 294–303.
- Creutzig et al. [2017] F. Creutzig, P. Agoston, J. C. Goldschmidt, G. Luderer, G. Nemet, R. C. Pietzcker, The underestimated potential of solar energy to mitigate climate change, Nature Energy 2 (2017) 17140.
- R. Sims et al. [2011] R. Sims et al., Integration of renewable energy into present and future energy systems, in: O. Edenhofer et al. (Ed.), IPCC Special Report on Renewable Energy Sources and Climate Change Mitigation, Cambridge University Press, Cambridge, United Kingdom, 2011.
- Brummitt et al. [2013] C. D. Brummitt, P. D. Hines, I. Dobson, C. Moore, R. M. D’Souza, Transdisciplinary electric power grid science, Proceedings of the National Academy of Sciences 110 (2013) 12159–12159.
- Timme et al. [2015] M. Timme, L. Kocarev, D. Witthaut, Focus on networks, energy and the economy, New journal of physics 17 (2015) 110201.
- Schäfer et al. [2018] B. Schäfer, D. Witthaut, M. Timme, V. Latora, Dynamically induced cascading failures in power grids, Nature Communications 9 (2018) 1975.
- Sovacool [2016] B. K. Sovacool, Differing cultures of energy security: An international comparison of public perceptions, Renewable and Sustainable Energy Reviews 55 (2016) 811–822.
- Milan et al. [2013] P. Milan, M. Wächter, J. Peinke, Turbulent character of wind energy, Physical Review Letters 110 (2013) 138701.
- Olauson et al. [2016] J. Olauson, M. N. Ayob, M. Bergkvist, N. Carpman, V. Castellucci, A. Goude, D. Lingfors, R. Waters, J. Widén, Net load variability in nordic countries with a highly or fully renewable power system, Nature Energy 1 (2016) 16175.
- Schäfer et al. [2018] B. Schäfer, C. Beck, K. Aihara, D. Witthaut, M. Timme, Non-gaussian power grid frequency fluctuations characterized by Lévy-stable laws and superstatistics, Nature Energy 3 (2018) 119–126.
- Georgilakis [2008] P. S. Georgilakis, Technical challenges associated with the integration of wind power into power systems, Renewable and Sustainable Energy Reviews 12 (2008) 852–863.
- Rodriguez et al. [2014] R. A. Rodriguez, S. Becker, G. B. Andresen, D. Heide, M. Greiner, Transmission needs across a fully renewable European power system, Renewable Energy 63 (2014) 467–476.
- Wohland et al. [2018] J. Wohland, M. Reyers, C. Märker, D. Witthaut, Natural wind variability triggered drop in german redispatch volume and costs from 2015 to 2016, PloS one 13 (2018) e0190707.
- International Energy Agency [2017] International Energy Agency, Tracking Clean Energy Progress, https://www.iea.org/publications/freepublications/publication/tracking-clean-energy-progress-2017.html, 2017.
- Walsh et al. [2017] B. Walsh, P. Ciais, I. A. Janssens, J. Penuelas, K. Riahi, F. Rydzak, D. P. van Vuuren, M. Obersteiner, Pathways for balancing CO2 emissions and sinks, Nature Communications 8 (2017) 14856.
- da Graça Carvalho [2012] M. da Graça Carvalho, EU energy and climate change strategy, Energy 40 (2012) 19–22.
- European Commission [2015] European Commission, A framework strategy for a resilient energy union with a forward-looking climate change policy, https://eur-lex.europa.eu/legal-content/EN/TXT/?uri=COM:2015:80:FIN, 2015.
- World Energy Council [2016] World Energy Council, World energy trilemma – defining measures to accelerate the energy transition, https://www.worldenergy.org/wp-content/uploads/2016/05/World-Energy-Trilemma_full-report_2016_web.pdf, 2016.
- Pfenninger et al. [2014] S. Pfenninger, A. Hawkes, J. Keirstead, Energy systems modeling for twenty-first century energy challenges, Renewable and Sustainable Energy Reviews 33 (2014) 74 – 86.
- Jebaraj and Iniyan [2006] S. Jebaraj, S. Iniyan, A review of energy models, Renewable and Sustainable Energy Reviews 10 (2006) 281 – 311.
- Heinrichs et al. [2017] H. U. Heinrichs, D. Schumann, S. Vögele, K. Biß, H. Shamon, P. Markewitz, J. Többen, B. Gillessen, F. Gotzens, A. Ernst, Integrated assessment of a phase-out of coal-fired power plants in Germany, Energy 126 (2017) 285 – 305.
- Loulou and Labriet [2008] R. Loulou, M. Labriet, ETSAP-TIAM: the TIMES integrated assessment model part I: Model structure, Computational Management Science 5 (2008) 7–40.
- Howells et al. [2011] M. Howells, H. Rogner, N. Strachan, C. Heaps, H. Huntington, S. Kypreos, A. Hughes, S. Silveira, J. DeCarolis, M. Bazillian, et al., OSeMOSYS: the open source energy modeling system: an introduction to its ethos, structure and development, Energy Policy 39 (2011) 5850–5870.
- Heinrichs and Markewitz [2017] H. U. Heinrichs, P. Markewitz, Long-term impacts of a coal phase-out in Germany as part of a greenhouse gas mitigation strategy, Applied Energy 192 (2017) 234 – 246.
- Simoes et al. [2013] S. Simoes, W. Nijs, P. Ruiz Castello, A. Sgobbi, D. Radu, P. Bolat, C. Thiel, E. Peteves, The JRC-EU-TIMES model – assessing the long-term role of the SET Plan Energy technologies, http://dx.doi.org/10.2790/97596, 2013.
- Stigler [1947] G. J. Stigler, Notes on the history of the Giffen paradox, Journal of Political Economy 55 (1947) 152–156.
- Heijman and von Mouche [2002] W. Heijman, P. von Mouche, New Insights into the Theory of Giffen Goods, Springer, Heidelberg, 2002.
- Schumann [2017] D. Schumann, Public perception of energy system transformation in germany, Euro-Asian Journal of sustainable energy development policy 5 (2017) 33–56.
- Konstantin [2013] P. Konstantin, Praxisbuch Energiewirtschaft: Energieumwandlung, -transport und -beschaffung im liberalisierten Markt, VDI-Buch, Springer Berlin Heidelberg, 2013.
- Schröder et al. [2013] A. Schröder, F. Kunz, J. Meiss, R. Mendelevitch, C. von Hirschhausen, Current and prospective costs of electricity generation until 2050, Data Documentation, DIW 68, Deutsches Institut für Wirtschaftsforschung (DIW), Berlin, 2013.
- Hörsch et al. [2018] J. Hörsch, F. Hofmann, D. Schlachtberger, T. Brown, PyPSA-Eur: An open optimization model of the European transmission system, arXiv preprint arXiv:1806.01613 (2018).
- Brown et al. [2018a] T. Brown, J. Hörsch, D. Schlachtberger, PyPSA: Python for Power System Analysis, Journal of Open Research Software 6 (2018a) 4.
- Brown et al. [2018b] T. Brown, J. Hörsch, D. Schlachtberger, Python for Power System Analysis (PyPSA) Website, 2018b.
- European Network of Transmission System Operators for Electricity (2011) [ENTSO-E] European Network of Transmission System Operators for Electricity (ENTSO-E), Country-specific hourly load data, https://www.entsoe.eu/data/data-portal/consumption/, 2011.
- Open Power System Data [2017] Open Power System Data, Data Package Conventional power plants. Version 2017-07-07, https://data.open-power-system-data.org/conventional_power_plants/2017-07-07/, 2017.
- int [2017] ENTSO-E Interactive Transmission System Map, https://www.entsoe.eu/map/, 2017.
- Wiegmans [2016] B. Wiegmans, GridKit extract of ENTSO-E interactive map, https://doi.org/10.5281/zenodo.55853, 2016.
- Hörsch and Brown [2017] J. Hörsch, T. Brown, The role of spatial scale in joint optimisations of generation and transmission for European highly renewable scenarios, in: 2017 14th International Conference on the European Energy Market (EEM), pp. 1–7.
- Andresen et al. [2015] G. B. Andresen, A. A. Søndergaard, M. Greiner, Validation of Danish wind time series from a new global renewable energy atlas for energy system analysis, Energy 93 (2015) 1074 – 1088.
- Martinsen et al. [2006] D. Martinsen, V. Krey, P. Markewitz, S. Vögele, A time step energy process model for Germany – model structure and results, Energy Studies Review 14 (2006) 35.
- Linssen et al. [2017] J. Linssen, B. Gillessen, H. Heinrichs, W. Hennings, Electrification of commercial road transport – attainable effects and impacts on national energy supply systems, Energy Procedia 105 (2017) 2245 – 2252.
- Heinrichs et al. [2017] H. U. Heinrichs, J. Linssen, B. Gillessen, Climate policy beyond the European emissions trading system: Spotlight on the transport sector in germany, in: 2017 14th International Conference on the European Energy Market (EEM), pp. 1–6.
- International Energy Agency [2016] International Energy Agency, World Energy Outlook 2016, http://dx.doi.org/10.1787/weo-2016-en, 2016.
- European Energy Exchange (2018) [EEX] European Energy Exchange (EEX), Marktdaten: European Emission Allowances Auction, https://www.eex.com/de/marktdaten/umweltprodukte/auktionsmarkt/european-emission-allowances-auction, 2018.
- Kahn and Franceschi [2006] J. R. Kahn, D. Franceschi, Beyond Kyoto: A tax-based system for the global reduction of greenhouse gas emissions, Ecological Economics 58 (2006) 778 – 787.
- Fawcett et al. [2014] A. A. Fawcett, L. E. Clarke, S. Rausch, J. P. Weyant, Overview of EMF 24 policy scenarios., Energy Journal 35 (2014).
- Taylor [2012] M. R. Taylor, Innovation under cap-and-trade programs, Proceedings of the National Academy of Sciences 109 (2012) 4804–4809.
- Pezzey and Jotzo [2013] J. C. Pezzey, F. Jotzo, Carbon tax needs thresholds to reach its full potential, Nature Climate Change 3 (2013) 1008–1011.
- Bertram et al. [2015] C. Bertram, G. Luderer, R. C. Pietzcker, E. Schmid, E. Kriegler, O. Edenhofer, Complementing carbon prices with technology policies to keep climate targets within reach, Nature Climate Change 5 (2015) 235–239.
- Edenhofer et al. [2015] O. Edenhofer, M. Jakob, F. Creutzig, C. Flachsland, S. Fuss, M. Kowarsch, K. Lessmann, L. Mattauch, J. Siegmeier, J. C. Steckel, Closing the emission price gap, Global environmental change 31 (2015) 132–143.
- Cramton et al. [2017] P. Cramton, D. MacKay, A. Ockenfels, S. Stoft, Global Carbon Pricing: The Path to Climate Cooperation, MIT Press, 2017.
- Jensen and Miller [2008] R. T. Jensen, N. H. Miller, Giffen behavior and subsistence consumption, The American Economic Review 98 (2008) 1553–1577.
- Vice president of the Wirtschaftskammer Österreich (2003) [Austrian chamber of commerce] Vice president of the Wirtschaftskammer Österreich (Austrian chamber of commerce), Press release: Deckelung der Energiekosten in der Industrie, https://www.ots.at/presseaussendung/OTS_20031126_OTS0257/wkoe-vizepraesident-schenz-deckelung-der-energiekosten-in-der-industrie, 2003.
- President of the Industriellenvereinigung (2004) [Austrian Industry Association] President of the Industriellenvereinigung (Austrian Industry Association), https://www.ots.at/presseaussendung/OTS_20041108_OTS0091/industrie-leitbetriebe-brauchen-energiezukunft, 2004.
- Ed Miliband (2013) [head of the British labour party] Ed Miliband (head of the British labour party), http://www.bbc.com/news/uk-politics-24213366, 2013.
- The Conservative and Unionist Party, Manifesto 2017 [2017] The Conservative and Unionist Party, Manifesto 2017, Forward, together: Our plan for a stronger Britain and a prosperous future, https://www.conservatives.com/manifesto, 2017.
- House of Commons: Business, Energy and Industrial Strategy Committee [2018] House of Commons: Business, Energy and Industrial Strategy Committee, Pre-legislative scrutiny of the draft domestic gas and electricity (tariff cap) bill, https://publications.parliament.uk/pa/cm201719/cmselect/cmbeis/517/517.pdf, 2018.
- Pfenninger et al. [2018] S. Pfenninger, L. Hirth, I. Schlecht, E. Schmid, F. Wiese, T. Brown, C. Davis, M. Gidden, H. Heinrichs, C. Heuberger, S. Hilpert, U. Krien, C. Matke, A. Nebel, R. Morrison, B. Müller, G. Pleßmann, M. Reeg, J. C. Richstein, A. Shivakumar, I. Staffell, T. Tröndle, C. Wingenbach, Opening the black box of energy modelling: Strategies and lessons learned, Energy Strategy Reviews 19 (2018) 63 – 71.
- Pfenninger et al. [2017] S. Pfenninger, J. DeCarolis, L. Hirth, S. Quoilin, I. Staffell, The importance of open data and software: Is energy research lagging behind?, Energy Policy 101 (2017) 211–215.
- Pfenninger [2017] S. Pfenninger, Energy scientists must show their workings, Nature 542 (2017) 393.
- Sweeney [2013] J. L. Sweeney, California Electricity Crisis, Hoover Press, 2013.
- Horst Seehofer (2014) [Prime minister of the German federal state Bavaria] Horst Seehofer (Prime minister of the German federal state Bavaria), http://www.sueddeutsche.de/politik/energiewende-bayern-kontra-gabriel-1.1910036, 2014.