EUROPEAN ORGANIZATION FOR NUCLEAR RESEARCH
CERN-EP-2018-246
September 5, 2018
Revised version
November 22, 2018
First Observation and Study of the Decay
The NA48/2 Collaboration
Abstract
The NA48/2 experiment at CERN reports the first observation of the decay from an exposure of charged kaon decays recorded in 2003 –2004. A sample of 4919 candidates with 4.9% background contamination allows the determination of the branching ratio in the full kinematic region, . The study of the kinematic space shows evidence for a structure dependent contribution in agreement with predictions based on chiral perturbation theory. Several P- and CP-violating asymmetries are also evaluated.
Accepted for publication in Physics Letters B
The NA48/2 Collaboration
J.R. Batley,
G. Kalmus,
C. Lazzeroni 111Corresponding authors, email: brigitte.bloch-devaux@cern.ch, milena.misheva@cern.ch,222Deceased,
D.J. Munday 111Corresponding authors, email: brigitte.bloch-devaux@cern.ch, milena.misheva@cern.ch,
M.W. Slater 111Corresponding authors, email: brigitte.bloch-devaux@cern.ch, milena.misheva@cern.ch,
S.A. Wotton
Cavendish Laboratory, University of Cambridge, Cambridge, CB3 0HE, UK 333Funded by the UK Particle Physics and Astronomy Research Council, grant PPA/G/O/1999/00559
R. Arcidiacono 444Now at: Università degli Studi del Piemonte Orientale e Sezione dell’INFN di Torino, I-10125 Torino, Italy, G. Bocquet, N. Cabibbo 222Deceased, A. Ceccucci, D. Cundy 555Now at: Istituto di Cosmogeofisica del CNR di Torino, I-10133 Torino, Italy, V. Falaleev 666Now at: Joint Institute for Nuclear Research, 141980 Dubna (MO), Russia,
M. Fidecaro, L. Gatignon, A. Gonidec, W. Kubischta, A. Maier, A. Norton 777Now at: Dipartimento di Fisica e Scienze della Terra dell’Università e Sezione dell’INFN di Ferrara, I-44122 Ferrara, Italy,
M. Patel 888Now at: Department of Physics, Imperial College, London, SW7 2BW, UK, A. Peters
CERN, CH-1211 Genève 23, Switzerland
S. Balev 222Deceased, P.L. Frabetti, E. Gersabeck 999Now at: School of Physics and Astronomy, The University of Manchester, Manchester, M13 9PL, UK, E. Goudzovski 111Corresponding authors, email: brigitte.bloch-devaux@cern.ch, milena.misheva@cern.ch,222Deceased,101010Supported by ERC Starting Grant 336581, P. Hristov 111111Now at: CERN, CH-1211 Genève 23, Switzerland, V. Kekelidze, V. Kozhuharov 121212Now at: Faculty of Physics, University of Sofia “St. Kl. Ohridski”, BG-1164 Sofia, Bulgaria, funded by the Bulgarian National Science Fund under contract DID02-22,131313Also at: Laboratori Nazionali di Frascati, I-00044 Frascati, Italy, L. Litov 121212Now at: Faculty of Physics, University of Sofia “St. Kl. Ohridski”, BG-1164 Sofia, Bulgaria, funded by the Bulgarian National Science Fund under contract DID02-22, D. Madigozhin, M. Misheva 111Corresponding authors, email: brigitte.bloch-devaux@cern.ch, milena.misheva@cern.ch,141414Now at: Institute of Nuclear Research and Nuclear Energy of Bulgarian Academy of Science (INRNE-BAS), BG-1784 Sofia, Bulgaria, N. Molokanova, I. Polenkevich, Yu. Potrebenikov, S. Stoynev 151515Now at: Fermi National Accelerator Laboratory, Batavia, IL 60510, USA, A. Zinchenko 222Deceased
Joint Institute for Nuclear Research, 141980 Dubna (MO), Russia
E. Monnier 161616Now at: Centre de Physique des Particules de Marseille, IN2P3-CNRS, Université de la Méditerranée, F-13288 Marseille, France, E. Swallow 222Deceased, R. Winston 171717Now at: School of Natural Sciences, University of California, Merced, CA 95343, USA
The Enrico Fermi Institute, The University of Chicago,
Chicago, IL 60126, USA
P. Rubin 181818Now at: School of Physics, Astronomy and Computational Sciences, George Mason
University, Fairfax, VA 22030, USA,
A. Walker
Department of Physics and Astronomy, University of Edinburgh, Edinburgh, EH9 3JZ, UK
P. Dalpiaz, C. Damiani, M. Fiorini, M. Martini, F. Petrucci, M. Savrié, M. Scarpa, H. Wahl
Dipartimento di Fisica e Scienze della Terra dell’Università e
Sezione dell’INFN di Ferrara,
I-44122 Ferrara, Italy
W. Baldini, A. Cotta Ramusino, A. Gianoli
Sezione dell’INFN di Ferrara, I-44122 Ferrara, Italy
M. Calvetti, E. Celeghini, E. Iacopini, M. Lenti, G. Ruggiero 191919Now at: Physics Department, University of Lancaster, Lancaster, LA1 4YW, UK
Dipartimento di Fisica dell’Università e Sezione
dell’INFN di Firenze,
I-50125 Sesto Fiorentino, Italy
A. Bizzeti 202020Also at Dipartimento di Scienze Fisiche, Informatiche e Matematiche, Università di Modena e Reggio Emilia, I-41125 Modena, Italy, M. Veltri 212121Also at Istituto di Fisica, Università di Urbino, I-61029 Urbino, Italy
Sezione dell’INFN di Firenze, I-50019 Sesto Fiorentino, Italy
M. Behler, K. Eppard, M. Hita-Hochgesand, K. Kleinknecht, P. Marouelli, L. Masetti,
U. Moosbrugger, C. Morales Morales, B. Renk, M. Wache, R. Wanke, A. Winhart 111Corresponding authors, email: brigitte.bloch-devaux@cern.ch, milena.misheva@cern.ch
Institut für Physik, Universität Mainz, D-55099 Mainz, Germany 222222Funded by the German Federal Minister for Education and research under contract 05HK1UM1/1
D. Coward 232323Now at: SLAC, Stanford University, Menlo Park, CA 94025, USA, A. Dabrowski 111111Now at: CERN, CH-1211 Genève 23, Switzerland, T. Fonseca Martin, M. Shieh, M. Szleper 242424Now at: National Center for Nuclear Research, P-05-400 Świerk, Poland,
M. Velasco, M.D. Wood 232323Now at: SLAC, Stanford University, Menlo Park, CA 94025, USA
Department of Physics and Astronomy, Northwestern
University, Evanston, IL 60208, USA
G. Anzivino,
E. Imbergamo,
A. Nappi 222Deceased,
M. Piccini,
M. Raggi 252525Now at: Università di Roma “La Sapienza”, I-00185 Roma, Italy,
M. Valdata-Nappi
Dipartimento di Fisica dell’Università e
Sezione dell’INFN di Perugia,
I-06100 Perugia, Italy
P. Cenci, M. Pepe, M.C. Petrucci
Sezione dell’INFN di Perugia, I-06100 Perugia, Italy
F. Costantini, N. Doble, L. Fiorini 262626Now at: Instituto de Física Corpuscular IFIC, Universitat de València, E-46071 València, Spain, S. Giudici, G. Pierazzini 222Deceased, M. Sozzi, S. Venditti
Dipartimento di Fisica dell’Università e Sezione dell’INFN di Pisa, I-56100 Pisa, Italy
G. Collazuol 272727Now at: Dipartimento di Fisica dell’Università e Sezione dell’INFN di Padova, I-35131 Padova, Italy, L. DiLella 282828Now at: Dipartimento di Fisica dell’Università e Sezione dell’INFN di Pisa, I-56100 Pisa, Italy, G. Lamanna 282828Now at: Dipartimento di Fisica dell’Università e Sezione dell’INFN di Pisa, I-56100 Pisa, Italy, I. Mannelli, A. Michetti
Scuola Normale Superiore e Sezione dell’INFN di Pisa, I-56100 Pisa, Italy
C. Cerri, R. Fantechi
Sezione dell’INFN di Pisa, I-56100 Pisa, Italy
B. Bloch-Devaux 111Corresponding authors, email: brigitte.bloch-devaux@cern.ch, milena.misheva@cern.ch,292929Now at: Dipartimento di Fisica dell’Università di Torino, I-10125 Torino, Italy, C. Cheshkov 303030Now at: Institut de Physique Nucléaire de Lyon, IN2P3-CNRS, Université Lyon I, F-69622 Villeurbanne, France, J.B. Chèze, M. De Beer, J. Derré, G. Marel,
E. Mazzucato, B. Peyaud, B. Vallage
DSM/IRFU – CEA Saclay, F-91191 Gif-sur-Yvette, France
M. Holder, M. Ziolkowski
Fachbereich Physik, Universität Siegen, D-57068 Siegen, Germany 313131Funded by the German Federal Minister for Research and Technology (BMBF) under contract 056SI74
S. Bifani 111Corresponding authors, email: brigitte.bloch-devaux@cern.ch, milena.misheva@cern.ch, M. Clemencic 111111Now at: CERN, CH-1211 Genève 23, Switzerland, S. Goy Lopez 323232Now at: Centro de Investigaciones Energeticas Medioambientales y Tecnologicas, E-28040 Madrid, Spain
Dipartimento di Fisica dell’Università e
Sezione dell’INFN di Torino,
I-10125 Torino, Italy
C. Biino, N. Cartiglia, F. Marchetto
Sezione dell’INFN di Torino, I-10125 Torino, Italy
H. Dibon, M. Jeitler, M. Markytan, I. Mikulec, G. Neuhofer, L. Widhalm 222Deceased
Österreichische Akademie der Wissenschaften, Institut
für Hochenergiephysik,
A-10560 Wien, Austria 333333Funded by the Austrian Ministry for Traffic and
Research under the contract GZ 616.360/2-IV GZ 616.363/2-VIII, and
by the Fonds für Wissenschaft und Forschung FWF Nr. P08929-PHY
1 Introduction and theoretical framework
Kaon decays have played a major role in establishing the quark mixing flavour structure of the Standard Model [1]. Radiative kaon decays are of particular interest in testing models describing low-energy quantum chromodynamics (QCD) such as the chiral perturbation theory (ChPT), an effective field theory valid below a scale (1 GeV).
The radiative decay , never observed so far, proceeds through virtual photon exchange followed by internal conversion into an electron-positron pair, i.e. . The virtual can be produced by two different mechanisms: Inner Bremsstrahlung (IB) where the is emitted by one of the charged mesons in the initial or final state, and Direct Emission (DE) where the is radiated off at the weak vertex. Consequently, the differential decay rate consists of three terms: the dominant long-distance IB contribution, the DE component (electric E and magnetic M parts), and their interference. The interference term INT includes the different contributions, IB-E, IB-M and E-M. The IB-M and E-M terms are P-violating and cancel upon angular integration in the total rate.
There are few theoretical publications related to the mode [2, 3, 4] and no experimental observation. The authors of [3] predicted, on the basis of the NA48/2 measurement of the magnetic and electric terms involved in the decay [5], the branching ratios of IB, DE and INT components of the decay and posted recently a revised work [6] where the interference term is re-evaluated using more realistic inputs based on additional experimental results and fewer theoretical assumptions.
It is worth writing explicitly the various contributions to the squared amplitude of the decay [3]:
| (1) |
where are complex form factors and are kinematic expressions (as defined in [3]) which depend on the four-momenta of the system and the charged and neutral pions in the kaon rest frame. For convenience, one also writes:
| (2) |
The form factors include a strong phase corresponding to the S-wave and isospin 2 state of the dipion system. The complex form factors correspond to the electric part of DE and make use of the ChPT counterterms while corresponds to the magnetic part of DE and makes use of the counterterm . These form factors carry a strong phase corresponding to the P-wave and isospin 1 state of the dipion system.
Numerical values of the counterterms were estimated [6] using experimental measurements of form factors in the related modes , and .
2 Kaon beam line and detector
The NA48/2 experiment at the CERN SPS was specifically designed for charge asymmetry measurements in the decay modes [7]. Large samples of charged kaon decays were collected during the 2003–2004 data taking period. The experiment beam line was designed to deliver simultaneous narrow momentum band and beams originating from primary 400 GeV/ protons extracted from the CERN SPS and impinging on a beryllium target. Secondary unseparated hadron beams with central momenta of 60 GeV/ and a momentum band of 3.8% (rms) were selected and brought to a common beam axis by two systems of dipole magnets with zero total deflection (called “achromats”), focusing quadrupoles, muons sweepers and collimators. The fraction of beam kaons decaying in the 114 m long cylindrical evacuated tank was 22%.
The momenta of charged decay products were measured in a magnetic spectrometer, housed in a tank filled with helium at nearly atmospheric pressure. The spectrometer was composed of pairs of drift chambers (DCH) on each side of a dipole magnet providing a momentum kick MeV/ to charged particles in the horizontal plane. The momentum resolution achieved was % ( in GeV/).
A hodoscope (HOD) consisting of two planes of plastic scintillators, each segmented into 64 strip-shaped counters, followed the spectrometer and provided time measurements for charged particles with a resolution of 150 ps. Grouping the counters of each plane in eight subsets, the HOD surface was logically subdivided into 16 exclusive regions producing fast signals used to trigger the detector readout on charged track topologies.
Further downstream was a liquid krypton electromagnetic calorimeter (LKr), an almost homogeneous ionization chamber with an active volume of 7 m3, segmented transversally into 13248 projective cm2 cells with no longitudinal segmentation. The energies of photons and electrons were measured with resolutions %. The transverse positions of isolated showers were measured with a spatial resolution cm, and the shower time resolution was 2.5 ns ( in GeV). An iron/scintillator hadronic calorimeter and muon detectors were located further downstream. Neither of them was used in the present analysis.
A dedicated two-level trigger was used to collect decays into three charged tracks with high efficiency: at the first level (L1), events containing charged tracks were selected by requiring space and time coincidences of signals in the two HOD planes in at least two of the 16 exclusive regions; at the second level (L2), a farm of asynchronous microprocessors performed a fast track reconstruction and ran a vertex finding algorithm.
3 Data analysis
3.1 Measurement method
The decay rate is measured relative to the normalization decay collected concurrently with the same trigger logic. This method does not rely on an absolute kaon flux measurement. In the signal sample, the is identified through the mode . In the normalization sample, the is identified through the Dalitz mode . The ratio of partial rates (and branching ratios) is obtained as:
| (3) |
where are the numbers of signal and normalization candidates; are the numbers of background events in the signal and normalization samples; and are the acceptance and the trigger efficiency for the signal sample; and are those for the normalization sample.
The branching ratio of the normalization mode is and the ratio of partial rates is [9]. Acceptances are obtained from a detailed Monte Carlo (MC) simulation based on GEANT3 [10]. The simulation includes full detector geometry and material description, stray magnetic fields, DCH local inefficiencies and misalignment, LKr local inefficiencies, accurate simulation of the kaon beam line and variations of the above throughout the data-taking period.
Efficiencies of the L1 and L2 triggers are measured from downscaled control samples, recorded concurrently with the three-track trigger. The control trigger condition for the L1 efficiency measurement requires at least one coincidence of signals in the two planes of the HOD. The control trigger sample for the L2 efficiency measurement consists of L1 triggers recorded regardless of the L2 decision. The trigger decision is also available in the simulation for comparison.
3.2 Event reconstruction and selection
The standard NA48/2 software has been used including charged track, LKr energy cluster and three-track decay vertex reconstruction [7]. Fully reconstructed decays have been used to monitor the DCH alignment, the spectrometer field integral and the mean beam position at each DCH plane throughout the data taking.
Signal and normalization candidates are reconstructed from three tracks: two same-sign tracks and one opposite-charge track forming a common vertex in the fiducial decay volume, the vertex charge being therefore . The vertex time is defined as the average of the three HOD signal times associated to the tracks. The tracks are required to be in time within 5 ns of the vertex time. Their impact points are required to be within the geometrical acceptance of the drift chambers. In particular, the track distance to the monitored beam position in DCH1 plane is required to be larger than 12 cm. The track momenta are required to be in the range (2–60) and track-to-track distances at DCH1 to be larger than 2 cm to suppress photon conversions to pairs in the upstream material.
Configurations where the three considered tracks, extrapolated to the HOD front face, have their impact points in a single trigger region are rejected to avoid L1 inefficiencies of purely geometrical origin. Because of the different kinematics, this affects 2.3% of the signal sample and has a negligible effect on the normalization sample.
All vertices considered for further analysis are required to be reconstructed in a 98 m long fiducial volume, starting 2 m downstream of the last collimator exit, and within 3 cm from the beam axis.
Photon clusters matching the vertex time within ns are considered as photon candidates if their energy is in the range (3–60) GeV, their position is within the LKr geometrical acceptance and their distance to the nearest LKr inactive cell is larger than 2 cm. Photon four-momenta are reconstructed assuming they originate from the three-track vertex. Photon trajectories are required to intercept the DCH1 plane at a radial position larger than 11 cm to avoid possible interactions with the DCH flange resulting in a degraded energy measurement.
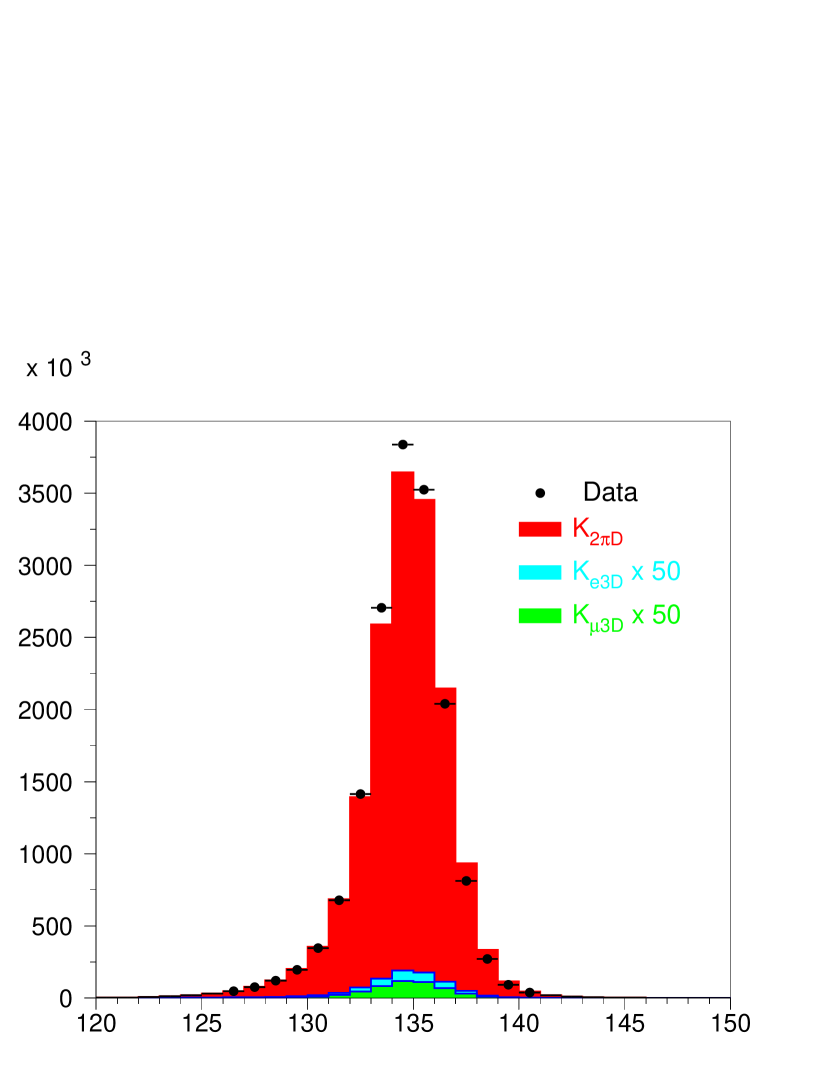
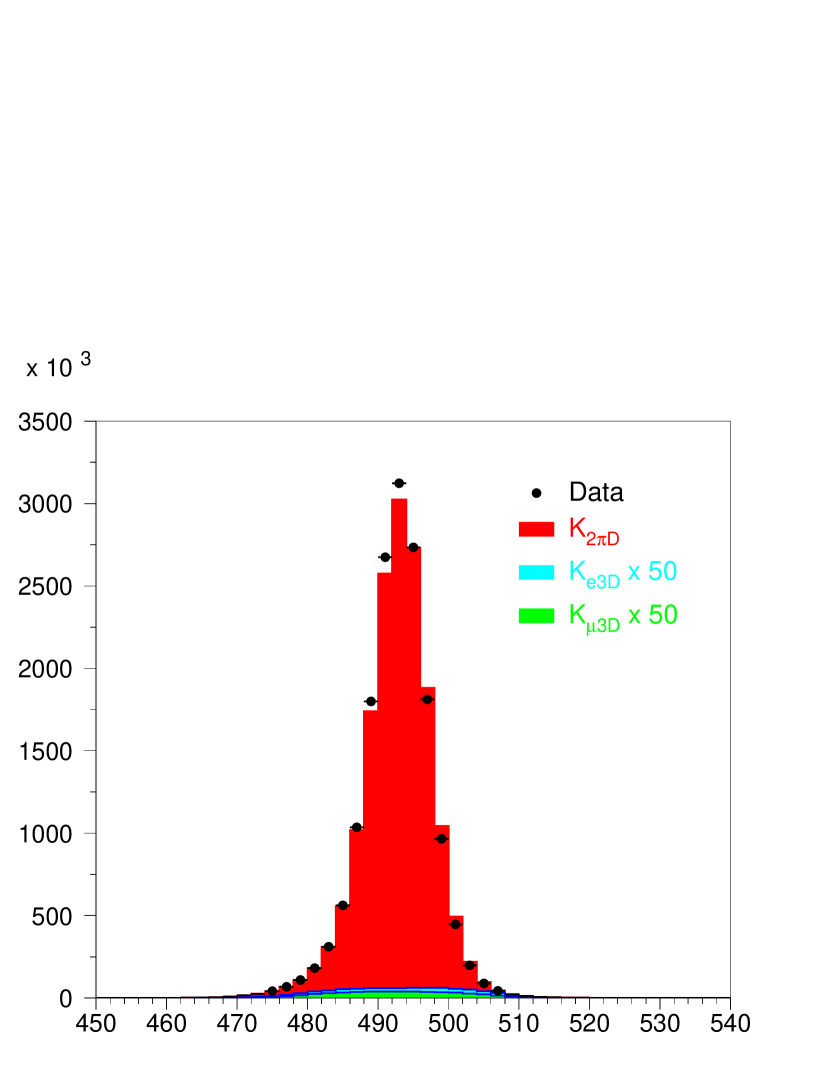
Signal and normalization modes differ in their final state by one photon, while satisfying similar kinematic constraints on the reconstructed and kaon masses, although with different resolutions because of different numbers of participating particles. The mass resolutions (Gaussian rms) obtained from the data agree with those from simulation and are found to be , and , for the normalization and signal modes, respectively.
Very loose requirements are applied to the reconstructed masses, required to be within 15 (45 ) from the nominal () mass [9], respectively, ensuring a minimal dependence of the selection on momentum or energy calibration effects, as well as on any resolution mismatches between data and simulation. A common constraint, taking into account the correlation between the reconstructed m and mK masses and defined as
| (4) |
contains more than 99% of the normalization events and about 96.5% of the signal events.
In both modes, the single track with its charge opposite to is considered to be an electron (positron). The remaining ambiguity for the two same-sign tracks is then solved by testing the two mass hypotheses against the full selection. When a particular mass assignment is considered, an extra requirement on the distance of any photon cluster to the track impact at the LKr front face is applied to guarantee photon shower isolation, avoiding potential overlap with other showers: the distance between the photon position and the electron and positron track impacts is required to be larger than 10 cm and the distance between the photon position and the pion track impact to be larger than 20 cm. This requirement is enforced only for track impacts within the LKr geometrical acceptance.
No upper limit on the number of tracks and clusters is set, all three-track vertices being considered and combined with any photon cluster under the two possible mass hypotheses until one combination satisfies either of the following selections (normalization or signal) below, the event being rejected otherwise. If both mass combinations are accepted, the one with the tighter constraint of Eq. (4) is kept.
Normalization selection
The candidate is reconstructed from a pair of electron and positron tracks and a photon originating from the three-track vertex. The kaon candidate is reconstructed from the system.
The consistency of the final state with a kaon decay along the beam axis is checked further by considering the energy-weighted coordinates of the centre of gravity (COG) of the particles at the LKr front plane computed from the photon position and the track extrapolations obtained from track parameters measured before the magnet (undeviated trajectories). The radial distance of the COG to the nominal beam position is required to be smaller than 2 cm. The pion momentum is required to be larger than 10 and the total momentum of the system to be in the beam momentum range (54–66) . The mass is required to be larger than 10 to ensure good agreement between data and simulation. A sample of 16316690 candidates satisfies the normalization selection criteria.
Signal selection
The candidate is reconstructed from two photons originating from the three-track vertex. The kaon candidate is reconstructed from the system. The two photon clusters are required to be separated by more than 10 cm at the LKr front plane to avoid shower overlap. The event COG coordinates are then obtained including the two photons and the three charged tracks, and subjected to the same requirement as above. The total momentum of the system is required to be in the beam momentum range (54–66) . The mass is required to be larger than 3 .
Two main sources of background contribute to the signal final state: () where one of the photons is lost (or merged with another particle), and (), where the radiative photon and the Dalitz decay photon mimic a decay. Suppression of the background events is achieved by requiring the squared mass of the system to be greater than 0.12 , exploiting the larger phase space available in the signal mode. This cut alone rejects 94% of the simulated events and 1% of the IB signal. To reject the background, each of the two possible masses is required to be more than 7 away from the nominal mass (corresponding to about of the mass resolution). A sample of 4919 candidates satisfies the signal selection criteria.
3.3 Background evaluation
The background processes contributing to the normalization mode () are semi-leptonic decays followed by a Dalitz decay of the : () and (), collectively denoted , where the decay is correctly reconstructed but the lepton () is erroneously attributed the mass. The acceptances of such processes in the normalization selection are () and obtained from large simulated samples.
For each background process, the number of events is estimated relative to the number of observed events in the normalization mode using the acceptances in the normalization selection and the world average branching ratios [9]:
| (5) |
where the trigger efficiencies cancel to first order due to the similar topologies.
The number of background events in the signal selection is estimated relative to the number of observed events in the normalization selection and is obtained as in Eq. (5), using the acceptances in the signal selection, both ():
| (6) |
| (7) |
Note the factor of two in Eq. (6) due to the two mesons in the mode. An order of magnitude smaller contribution from is also considered. In all contributions both background and normalization branching ratios include the Dalitz decay partial rate whose value and uncertainty cancel in the estimation.
4 Branching ratio measurement
Candidates and background
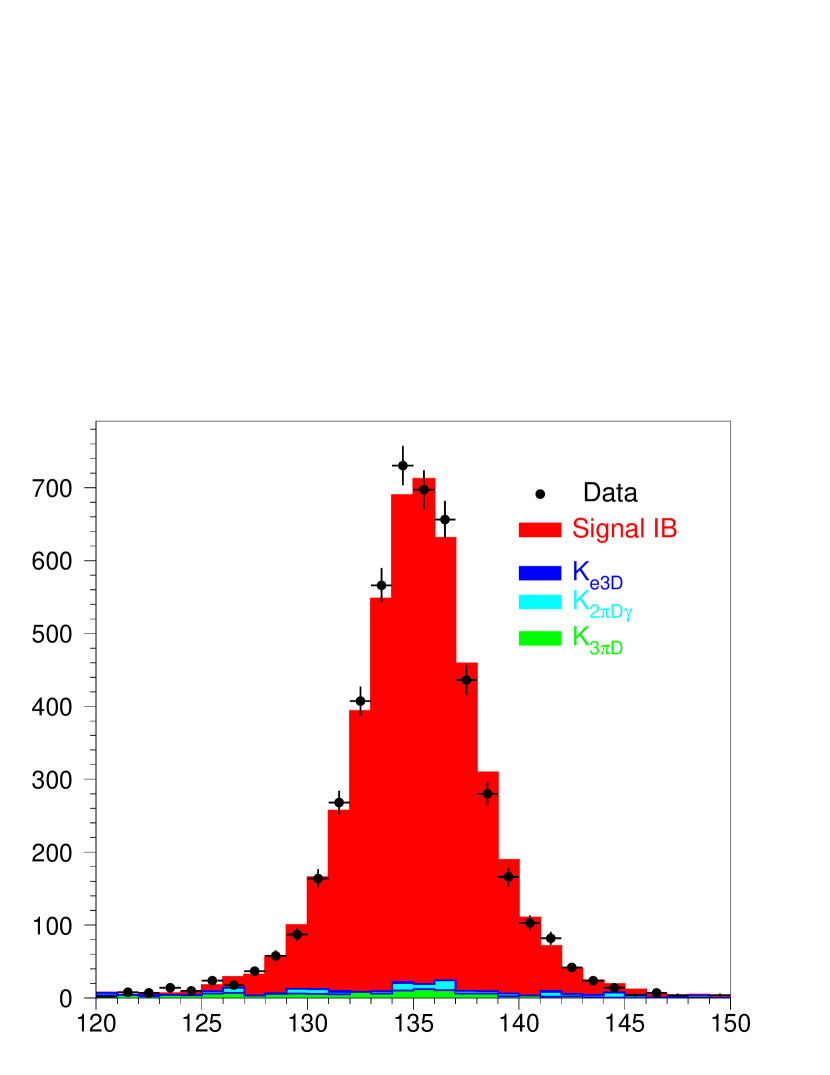
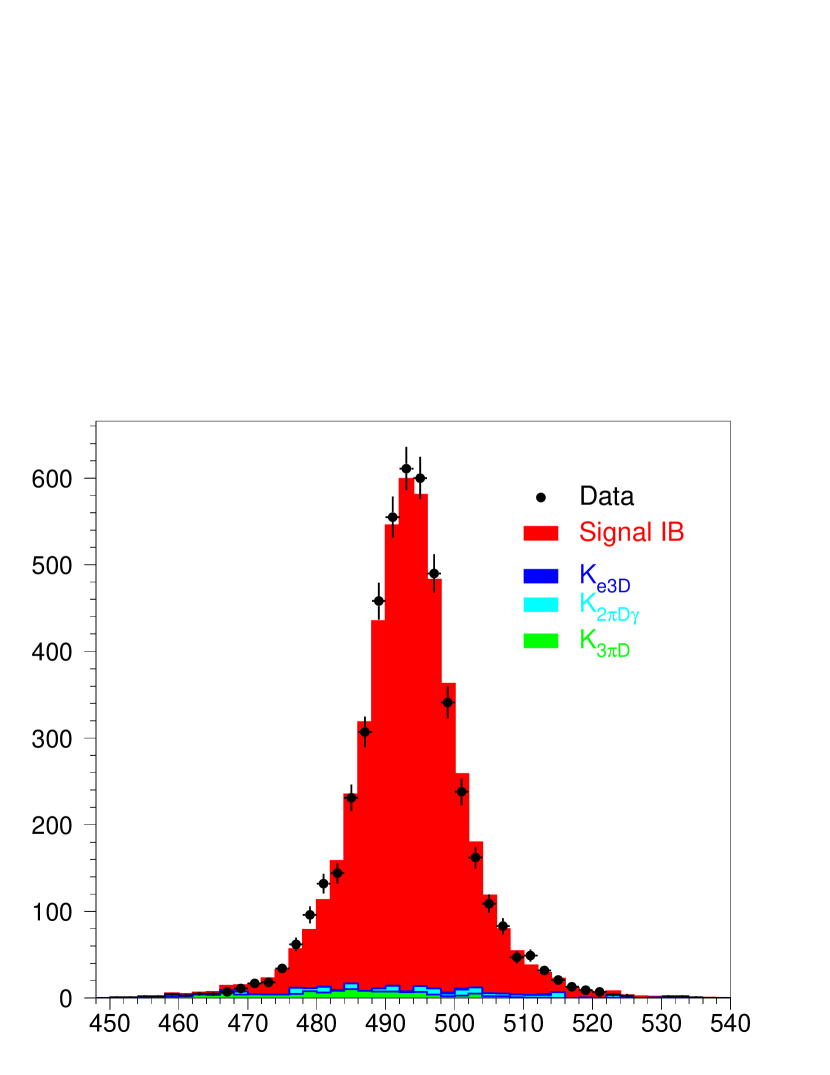
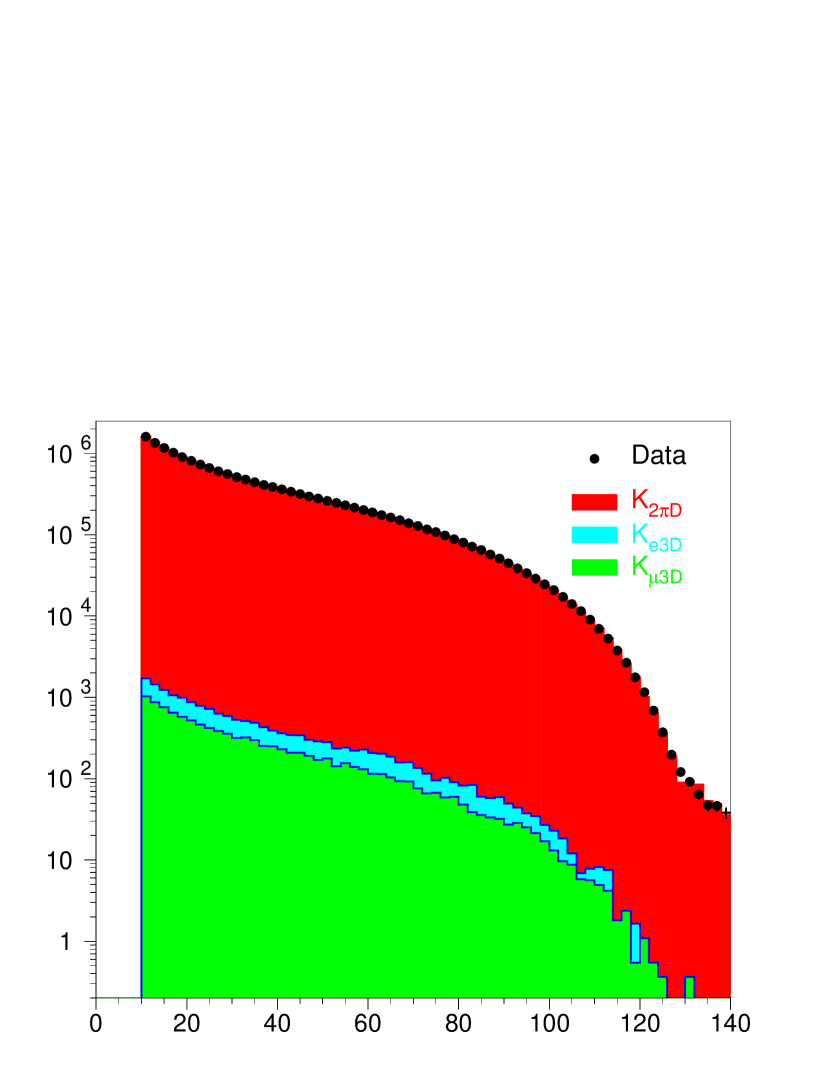
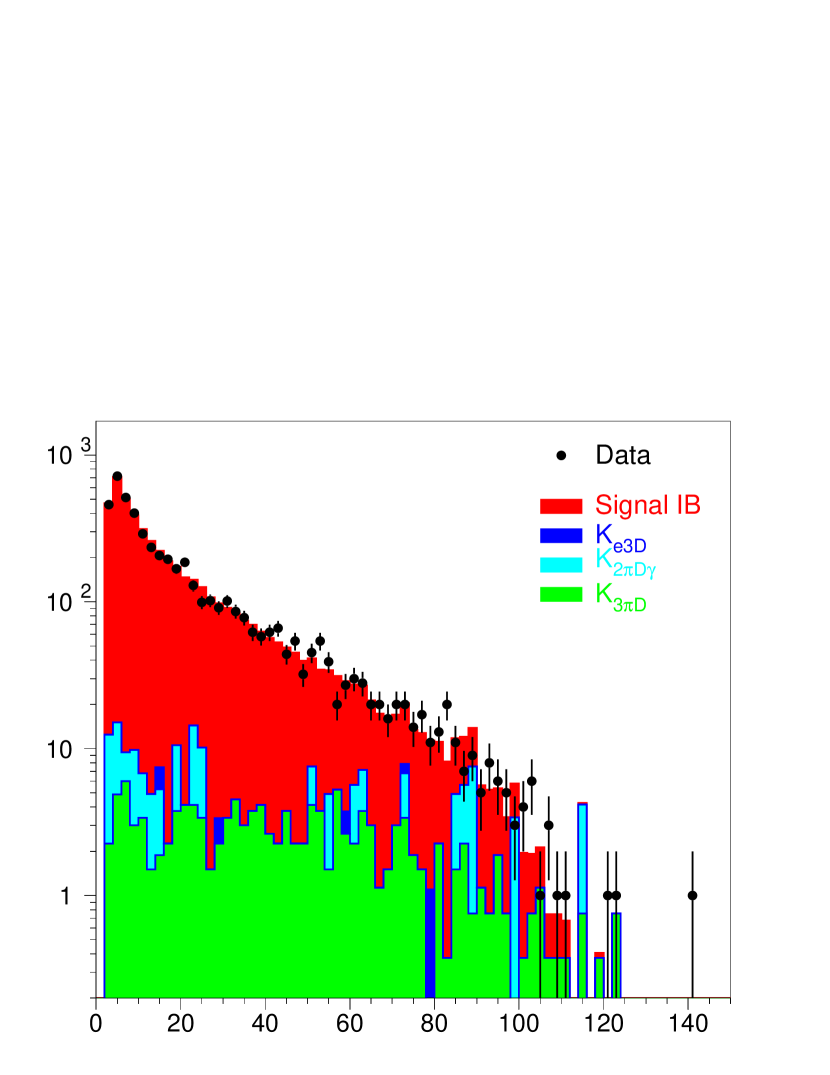
Samples of candidates and 4919 signal candidates have been selected from a subset of a kaon decay exposure in 2003–2004. The background estimates from simulation amount to () events and () events in the normalization mode, corresponding to a total relative background contribution of 0.11%. In the signal mode, they amount to () events from , () events from and () from , adding up to a relative background contribution of (4.9 0.4)%. The reconstructed and () mass distributions are displayed in Figure 1 (Figure 2) for the selected normalization (signal) candidates. Background and normalization (signal) simulations, scaled to the number of observed candidates, show a good agreement with the data distributions.
Acceptances
Because the selection acceptance is not uniform across the phase space, its overall value depends on the dynamics of the considered process. The acceptance (3.981%) is computed using the simulation of according to [11] followed by decay according to the most recent “Prague” radiative decay calculation [12].
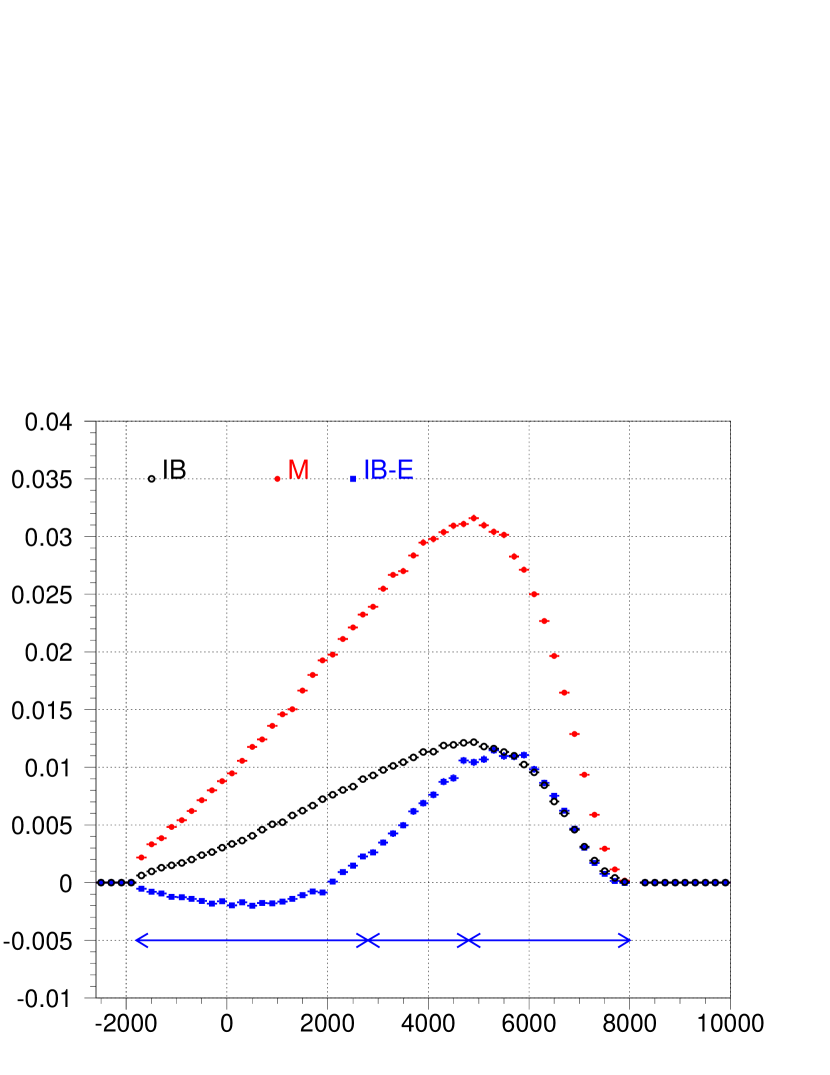
The MC samples for the different signal contributions IB, DE and INT have been generated separately according to the theoretical description given in [3, 6]: the DE contribution consists mainly of the magnetic M term, with the E term expected to be fifteen times lower; the INT term includes only the electric interference IB-E, as the other interference terms IB-M and E-M do not contribute to the total rate in the limit of full angular integration (Section 1). Particular care has been taken in the generation of the IB-E term which contributes constructively or destructively to the differential rate depending on the kinematic space region considered. This property is illustrated in Figure 3-left. Radiative effects are implemented using the PHOTOS package [13].
Global acceptances are obtained for each of the three main components of the signal process: IB %, M % and IB-E %. The signal acceptance is then obtained from a weighted average of the single-component acceptances, using as weights, , their relative contributions to the total rate with respect to IB computed in [3, 6]:
| (8) |
where and are equal to 1/71 and respectively. The resulting signal acceptance is obtained as %.
Both normalization and signal acceptances are obtained with respect to the full kinematic range.

Trigger efficiencies
Trigger efficiencies are measured from control data samples for the normalization mode (L1: %, L2: %) and cross-checked against the simulated estimations (L1: %, L2: %) which provide also an accurate description of their time variations due to local and temporary inefficiencies of the HOD or DCHs. Due to the low statistics of the signal candidate sample, it is not possible to obtain the trigger efficiencies from the downscaled control samples. Trigger efficiencies for the signal candidates are therefore estimated from the simulated samples (L1: %, L2: %) and not affected by otherwise large statistical uncertainties. The full trigger efficiency in each selection is obtained as the product of L1 and L2 efficiencies that are based on different detectors and therefore uncorrelated.
Systematic uncertainties
The statistical uncertainties on acceptance and trigger efficiency values are accounted as part of the systematic uncertainties.
The control of the geometrical acceptances is evaluated by considering three exclusive regions of the decay longitudinal position (shown in Figure 3-right) with different acceptances and background conditions for both signal and normalization channels. The difference between the statistical combination of the three values and the global value is quoted as systematic uncertainty.
The control of the acceptance dependence with time and kaon charge is quantified by considering four exclusive measurements (2003 and 2004 data sets, and decays) and quoting as systematic uncertainty the difference between the statistical combination of the four values and the global value.
An evaluation of the background control level is obtained by tightening the constraint of Eq. (4) to reduce the background to signal contribution from 4.9% to 3% while decreasing the signal acceptance by a relative fraction of 8%. The quoted uncertainty covers also the effect of the residual disagreement between data and simulated reconstructed masses.
Trigger efficiencies obtained from simulation are used in the calculation. The difference between the measured and simulated efficiencies of the normalization candidates is considered as a systematic uncertainty.
The model dependence of the signal acceptance is investigated by varying in turn each input () within its theoretical uncertainty estimate. The resulting variations in acceptance are added in quadrature to obtain the overall contribution to systematics.
According to the authors of the PHOTOS package [14], the uncertainty on the photon emission implementation cannot exceed 10% of the full effect (here relative in the signal mode), which is quoted as systematic uncertainty. In the normalization mode, in the absence of any prescription from the authors of the “Prague” decay implementation, 10% of the relative difference between the PHOTOS and “Prague” acceptances is conservatively assigned as a systematic uncertainty and added quadratically to the signal PHOTOS uncertainty. The agreement between data and simulation can be judged from the distributions of Figure 4.
External errors stem from relative errors on () and on /.
Table 1 summarizes the considered sources of uncertainty.
| Source | |
|---|---|
| 1.426 | |
| 0.416 | |
| 0.025 | |
| negl. | |
| Total statistical | 1.486 |
| (MC statistics) | 0.171 |
| (MC statistics) | 0.051 |
| ) (MC statistics) | 0.023 |
| ) (MC statistics) | 0.007 |
| Acceptance geometry control | 0.083 |
| Acceptance time variation control | 0.064 |
| Background control | 0.280 |
| Trigger efficiency (systematics) | 0.400 |
| Model dependence | 0.285 |
| Radiative effects | 0.490 |
| Total systematic | 0.777 |
| () | 0.387 |
| 2.946 | |
| Total external | 2.971 |
Result
The final result is obtained as:
| (9) |
where the statistical error is dominated by the signal statistics, the systematic error by the radiative effects and the external error by the branching ratio uncertainty.
This value can be compared to the predictions from [3, 6]: for IB only, when including all DE and INT terms. The obtained value is compatible with both predictions within the experimental errors. However it should be noted that none of the above predictions includes any radiative or isospin breaking effects.
5 Kinematic space study
The current data statistics does not allow a precise enough measurement to quantify the contribution of the DE magnetic term M to the total decay rate (expected to be about 1%). However, the authors of [3, 6] have pointed out that the contributions of IB, magnetic M, and interference IB-E terms have different distributions in the Dalitz plot (T, E) for different ranges of values, where T, E and are the charged pion kinetic energy and the virtual photon energy in the kaon rest frame, and the mass squared, respectively. The differences remain relevant even after the analysis selection acceptance is applied. A method based on the population of 3d-boxes in the kinematic space (, T, E) is used to determine the relative fraction of each component that would add up to reproduce the data sample population. The data 3d-space is first split into N1 slices along , then each slice is split into N2 slices along T and then into N3 E slices, all with equal populations. The result is a grid of N1 N2 N3 exclusive 3d-boxes of variable size but identical population. The background contributions and the various simulated signal components are distributed according to the data grid definition, each resulting in a set of 3d-boxes of unequal population. To account for the potentially different sizes of the simulation samples, scale factors and are defined as the ratios of the IB to the M and IB to the IB-E simulated sample sizes.
To obtain the fractions (M)/IB and (IB-E)/IB reproducing the data, a estimator is minimized:
| (10) |
where is the data population (error) and the expected population (error) in box . The denominator of each term is dominated by the number of data events , the same in each box. The expected number of events in box is computed as:
| (11) |
where is a global scale factor to guarantee that the sum of the simulated events and background contributions is normalized to the total number of data candidates. At the end of the minimization, the obtained values of and can be related to the relative contributions (M)/IB and (IB-E)/IB by :
| (12) |
The method has no sizeable dependence on the precise grid structure as long as the granularity ensures sensitivity to the population variation within the resolution (at least 3 slices and 5 or 6 slices along the two other variables) and large enough statistics per box to consider Gaussian errors. The grid configuration has been employed and the results are obtained with a probability of 19% for a value of 98.2/87 degrees of freedom and a correlation . The obtained value (M)/IB = is consistent with the predicted value from [3], , obtained using the experimental measurement of . The (IB-E)/IB value of shows that there is no sensitivity to this contribution within the current data statistics and agrees with the value from [6], , obtained using experimental inputs to values. The external errors on the predicted values stem from the uncertainties of the measurements used as input in the evaluations.
6 Asymmetry investigations
Electroweak (or beyond Standard Model) phases change sign under charge conjugation when switching from to , unlike the strong phase that governs the final state interaction of the pion system. These phases can be investigated through asymmetries between and partial rates.
The simplest CP-violating asymmetry is the charge asymmetry between and partial rates integrated over the whole phase space:
| (13) |
The value of can be related to the interference IB-E term and is proportional to , where is a possible CP-violating phase appearing in the form factors in addition (subtraction) to the strong phase (Section 1). The asymmetry is obtained from the statistically independent measurements of and branching ratios, that take into account the possible biases introduced by the detector acceptances. The values
| (14) |
lead to , where the error is statistical only, as the systematic and external errors cancel in the ratio. This value is consistent with zero and is translated to a single-sided limit:
| (15) |
Other asymmetries are defined in [3] using the so-called Cabibbo-Maksymowicz [15] variables111For decays, the variables are the squared invariant dipion and dilepton masses, the angle of the () in the dipion (dilepton) rest frame with respect to the flight direction of the dipion (dilepton) in the rest frame, the angle between the dipion and dilepton planes in the kaon rest frame. to describe the kinematic space of the decay and selecting particular integration regions of the angular variable:
| (16) |
| (17) |
These asymmetries can be obtained by combining the branching ratios measured in various parts of the variable space. Defining sectors of the space between 0 and as , , and , and combining them as statistically independent sector sums () and () one can obtain the above asymmetries.
The integral has the interesting property of subtracting the contribution of sector sum from the contribution of sector sum . The interference term IB-M (Section 1) equally populates sectors and when positive and depopulates sectors and when negative. The asymmetry is then related to the interference IB-M term and is proportional to , where is a possible CP-violating phase appearing in the form factor (Section 1). The interference IB-M term has not been generated in the simulation as it is not expected to contribute significantly to the total rate. However it has been checked that the whole range of the variable is always considered in the acceptance calculation, apart for the region (MeV/ excluded from the signal selection. The CP asymmetries defined in Eq. (16, 17) are measured, although to a limited precision given the current data statistics, as:
| (18) |
All asymmetries are consistent with zero, single-sided upper limits can be set as
| (19) |
Following another prescription of [3], a long-distance P-violating asymmetry defined as
| (20) |
can be obtained from the asymmetry between sector sums and when considering or alone, and combined if found consistent. The asymmetry is proportional to [3] and . A precise measurement would allow a check of the sign of and a measurement of .
Our data lead to and both consistent with zero. The combined value is . The errors are statistical only as both systematic and external uncertainties cancel in the ratios. This value can be translated into a single-sided upper limit:
| (21) |
7 Results and conclusion
The data sample recorded by the NA48/2 experiment in 2003–2004 has been analyzed, searching for the unobserved decay mode in an exposure of kaon decays. A sample of 4919 decay candidates with 4.9% background has been identified, resulting in the first observation of this decay mode. The branching ratio has been measured relative to the mode followed by a Dalitz decay and found to be , in agreement with predictions from ChPT.
Despite the limited statistics available, a study of the kinematic space of the decay has been performed to extract information on the fraction of magnetic (M) and interference (IB-E) contributions with respect to inner bremsstrahlung (IB). The relative contribution, (M)/IB = , is found consistent with the theoretical expectation of . The relative IB-E contribution, (IB-E)/IB = , is also in agreement with the prediction of but with limited significance due to the lack of data statistics in the high region.
Several CP-violating asymmetries and a long-distance P-violating asymmetry have been evaluated and found to be consistent with zero, leading to upper limits at 90% CL.
If larger data statistics becomes available (for example at the NA62 experiment), more detailed studies of the kinematic space will allow for an improved evaluation of the DE term contribution. A study of the P-violating asymmetry could bring information on the sign of the DE magnetic term and on the strong phase involved in the final state interaction of the two pions.
Acknowledgements
We gratefully acknowledge the CERN SPS accelerator and beam line staff for the excellent performance of the beam and the technical staff of the participating institutes for their efforts in the maintenance and operation of the detector, and data processing. We thank M. Koval for making the “Prague” radiative Dalitz decay code available in the NA48/2 simulation software. Discussions with G. D’Ambrosio and O. Catà were most stimulating in clarifying the impact of interference terms on our measurement.
References
- [1] V. Cirigliano, G. Ecker, H. Neufeld, A. Pich and J. Portolés, Rev. Mod. Phys. 84 (2012) 399.
- [2] H. Pichl, Eur. Phys. J. C 20 (2001) 371.
- [3] L. Cappiello, O. Catà, G. D’Ambrosio and D.N. Gao, Eur. Phys. J. C 72 (2012) 1872.
- [4] S.R. Gevorkyan and M.H. Misheva, Eur. Phys. J. C 74 (2014) 2860.
- [5] J.R. Batley et al. [NA48/2 Collaboration], Eur. Phys. J. C 68 (2010) 75.
- [6] L. Cappiello, O. Catà and G. D’Ambrosio, Eur. Phys. J. C 78 (2018) 265.
- [7] J.R. Batley et al. [NA48/2 Collaboration], Eur. Phys. J. C 52 (2007) 875.
- [8] V. Fanti et al. [NA48 Collaboration], Nucl. Instrum. Methods A 574 (2007) 443.
- [9] M. Tanabashi et al. (Particle Data Group), Phys. Rev. D 98 (2018) 030001.
- [10] GEANT3 Detector Description & Simulation Tool, CERN Program Library W5013 (1994).
- [11] C. Gatti, Eur. Phys. J. C 45 (2006) 417.
- [12] T. Husek, K. Kampf and J. Novotný, Phys. Rev. D 92 (2015) 054027.
- [13] E. Barberio and Z. Wa̧s, Comput. Phys. Commun. 79 (1994) 291.
- [14] Qingjun Xu, Z. Wa̧s, Proceedings of Science, PoS (RADCOR2009) (2009) 071.
- [15] N. Cabibbo and A. Maksymowicz, Phys. Rev. 137 (1965) B438.