Broadband Spectrum of the X-ray Binary M33 X-6 from NuSTAR and Swift-XRT Data: An Extragalactic Z-Source?
Abstract
We present the results of our study of the X-ray spectrum for the source X-6 in the nearby galaxy M33 obtained for the first time at energies above 10 keV from the data of the NuSTAR orbital telescope. The archival Swift-XRT data for energy coverage below 3 keV have been used, which has allowed the spectrum of M33 X-6 to be constructed in the wide energy range 0.3–20 keV. The spectrum of the source is well described by the model of an optically and geometrically thick accretion disk with a maximum temperature of keV and an inner radius of km (where is the unknown disk inclination angle with respect to the observer). There is also evidence for the presence of an additional hard component in the spectrum. The X-ray luminosity of M33 X-6 measured for the first time in the wide energy range 0.3–20 keV is erg s-1, with the luminosity in the hard 10–20 keV X-ray band being % of the source’s total luminosity. The results obtained suggest that X-6 may be a -source, i.e., an X-ray binary with subcritical accretion onto a weakly magnetized neutron star.
1 Introduction
The first detailed observations of nearby galaxies carried out onboard the Einstein observatory (Giacconi et al., 1979) revealed luminous X-ray sources unrelated to the activity in galactic nuclei characteristic for Seyfert galaxies. Seventeen X-ray sources were detected in the nearby spiral galaxy M33 (Triangle) among which there are a luminous central source with a luminosity of erg s-1named X-8 (the ordinal number in the list in right ascension) and several other sources in the disk and spiral arms of the galaxy with a luminosity of – erg s-1 (Long et al., 1981; Markert and Rallis, 1983; Trinchieri et al., 1988). In addition to point sources, an intense extended emission was detected. A ROSAT survey of the galaxy M33 expanded the list of detected sources to 57 (Schulman and Bregman, 1995; Long et al., 1996) and showed that the extended emission is consistent with the spiral structure of the galaxy closer to its central region. Subsequently, using the archival ROSAT data, Haberl and Pietsch (2001) presented a catalog of 184 sources within 50 arcmin of the M33 central region. Succeeding surveys of M33 onboard the modern Chandra and XMM-Newton observatories revealed hundreds of X-ray sources, gradually resolving the extended emission into separate sources in the disk and spiral arms of the galaxy (Pietsch et al., 2004; Misanovic et al., 2006; Plucinsky et al., 2008; Tullmann et al., 2011).
| Obs # | Obs Id | Date | Exposure | FPMA count | FPMB count |
|---|---|---|---|---|---|
| ks | rate, 10-2 s-1 | rate, 10-2 s-1 | |||
| 1 | 50310001002 | 2017-03-04 | 108 | 2.54 0.08 | 2.76 0.07 |
| 2 | 50310001004 | 2017-07-21 | 99 | 2.96 0.09 | 3.13 0.09 |
The NuSTAR observatory conducted a survey of the galaxy M33 at energies above 10 keV with an angular resolution previously inaccessible for these energies. The observations were performed within the framework of a “legacy survey” whose data are open for the astrophysical community111https://www.nustar.caltech.edu/page/legacy_surveys. Thus, it has become possible to carry out a spectral analysis of M33 sources in the hard X-ray band for the first time. For example, Krivonos et al. (2018) has studied the broadband spectrum of the luminous central source M33 X-8 for the first time, whose luminosity ( erg s-1) allows it to be attributed to the class of ultraluminous X-ray sources. It turned out that the spectrum could be described as the sum of a standard accretion disk (Shakura and Sunyaev, 1973) with a temperature of 1 keV and a hard power-law continuum with a high slope () extending at least to 20 keV. Thus, the ultraluminous X-ray source M33 X-8 turned out to be similar in its spectral properties to the most luminous (– erg s-1) and very few X-ray binaries in our Galaxy observed in the so-called very high state. In such objects we may deal with the accretion of matter onto a stellar-mass black hole with a rate that is a significant fraction of the critical one. A further expansion of the sample of well-studied high-luminosity X-ray binaries is needed to test this and alternative hypotheses.
The object of research in this paper, the X–ray source M33 X-6 is the second brightest one after X–8 in the galaxy M33 (Trinchieri et al., 1988), which allowed high-quality spectral data up to 20 KeV to be obtained with the NuSTAR telescope. X–ray observations at energies of the standard 2–10 keV X–ray band show that the source is an X–ray binary emitting approximately at the Eddington luminosity for a neutron star (and an appreciable fraction of the Eddington luminosity for a stellar-mass black hole). On the whole, the spectrum of the source is satisfactorily described by the model of an accretion disk with a temperature of 1–2 keV, but there is evidence for an excess emission at energies above 8– 10 keV ((Tullmann et al., 2011)). Unfortunately, as yet no optical counterpart of the X-ray source M33 X-6 has been detected, despite the fact that the corresponding field of the galaxy M33 is not very crowded (Tullmann et al., 2011).
The distance to the galaxy M33 was measured by several independent methods, but the discrepancy between various measurements reaches (see, e.g., U et al., 2009). In this paper, to estimate the luminosity of M33 X-6, we used the distance of 817 kpc (Freedman et al., 2001) previously used to calculate the luminosities of sources from the M33 survey based on Chandra data (Plucinsky et al., 2008; Tullmann et al., 2011).
2 OBSERVATIONAL DATA
2.1 NuSTAR
The observations of M33 X-6 were carried during a survey of the galaxy M33 by the orbital Nuclear Spectroscopic Telescope Array (NuSTAR, Harrison et al., 2013) at two epochs: in the spring and summer of 2017 (see Table 1). NuSTAR is the first grazing-incidence telescope operating at energies above 10 keV with the working energy range 3–79 keV. The telescope is equipped with two independent mirror systems, often referred as FPMA and FPMB. The total exposure time for M33 X-6 was 207 ks.
The lists of photons were preprocessed with the standard nupipeline software of the HEASOFT 6.22222https://heasarc.nasa.gov/lheasoft/ package. As a result, filtered lists of photons were obtained. Subsequently, we extracted the source’s spectra in a circle with a radius of and the spectrum of background counts in a ring with the nuproducts utility. To satisfy the criterion for applicability of the statistic, the source’s spectra were additionally binned with the condition that at least 30 counts were contained in one bin.
A preliminary analysis showed that the source’s spectrum is dominated by the background at energies above 20 keV. For this reason, we did not use the spectral data above this energy in the subsequent analysis. Figure 1 shows the spectrum of M33 X-6 in the energy range 3–20 keV from the spring observations (epoch 1) fitted by a simple power-law model phabspegpwrl with the model definition in the energy range 3–10 keV. Note that the NuSTAR spectral data are not sensitive enough to the line-of-sight absorption measurement due to the sharp drop in effective area at energies below 5 keV. Therefore, we use the average absorption toward the galaxy M33 = 1.1 см-2 from Kalberla et al. (2005) for all of the NuSTAR spectra. Fitting the model to the data led to an estimate of the power-law slope and the 3–10 keV flux erg cm-2 s-1. According to the goodness-of-fit criterion /d.o.f. = 1.43/170 (d.o.f. means the number of degrees of freedom), the power-law model describes the data poorly, which manifests itself as large-amplitude variations in the residuals (Fig. 1, left).
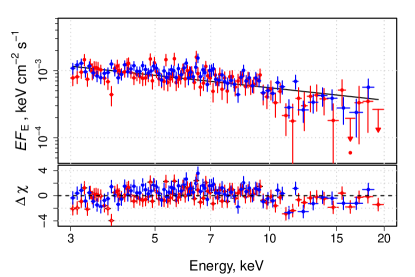
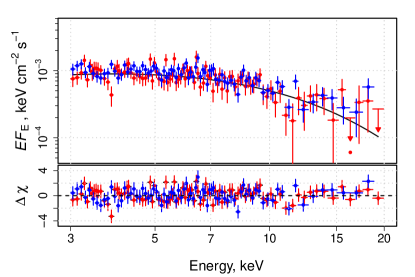
It can be seen from the results obtained that there is a modest cutoff at high energies in the spectrum. We attempted to describe the spectrum by a power-law model with an exponential cutoff phabscutoffpl (Fig. 1, right), which improved noticeably the quality of the fit (/d.o.f.=1.08/168). Table 2 contains the parameters of the best fit by this model for two epochs of 2017 observations. Note that the cross-normalization constant means the FPMB/FPMA cross-calibration. The model parameters and the observed flux from the source for the two epochs agree well between themselves. This allows us to conclude that there is no strong variability of M33 X-6 on 2017 and to combine the data into a single spectrum.
| Obs Id | aaThe absorbed (observed) 3–20 keV flux from the source. | Cutoff | FluxaaThe absorbed (observed) 3–20 keV flux from the source., | bbFor individual observations the coefficient C means the relative normalization between the FPMA and FPMB observations. | , |
|---|---|---|---|---|---|
| energy, keV | erg cm-2 s-1 | ||||
| 50310001002 | 1.1 | 4.32 | 1.81 | 1.12 | 1.08, 181.49/168 |
| 50310001004 | 0.7 0.4 | 3.92 | 1.75 | 1.05 | 0.83, 157.39/189 |
| Combined | 0.9 0.3 | 4.07 | 1.82 | 0.95 | 0.97, 351.88/361 |
2.2 Swift-XRT
To extend the spectral data to energies below 3 keV, we analyzed the archival data of the Neil Gehrels observatory (Swift-XRT, Gehrels et al., 2004). We selected the XRT observations in which M33 X-6 was displaced from the optical axis by no more than (see Table 3), which rules out a strong distortion of the point spread function (see Moretti et al., 2005). The derived data sample effectively includes two epochs of observations, 2007–2009 and 2015–2016, with a total exposure time of 38 ks, which allows a high quality spectrum to be obtained for a sufficiently bright source (which M33 X-6 is). Using the Swift-XRT data processing software provided by the UK Swift Science Data Centre333http://www.swift.ac.uk, we obtained data for our spectral analysis. In order for the counting statistics to be applicable when analyzing the data (cstat в xspec), the Swift-XRT spectra were additionally binned by 3 and 7 counts in each bin for the data collection 1–10 and 11, respectively. By analogy with the analysis of the NuSTAR data, we fitted the individual Swift-XRT spectra by the simple power-law model with line-of-sight absorption phabspowerlaw. The parameters of this model are given in Table 4.
| Obs # | Obs ID | Date | Exposure, s | Angular offset | Count rate |
|---|---|---|---|---|---|
| from optical axis, ′ | s-1 | ||||
| 1 | 00031041001 | 2007-12-26 | 2923 | 2.35 | 4.3 0.4 |
| 2 | 00031327001 | 2009-01-20 | 4737 | 2.63 | 5.8 0.4 |
| 3 | 00031327002 | 2009-01-28 | 3646 | 0.48 | 3.6 0.3 |
| 4 | 00031327003 | 2009-02-10 | 4513 | 2.14 | 4.9 0.3 |
| 5 | 00031327004 | 2009-02-24 | 5250 | 2.01 | 6.2 0.3 |
| 6 | 00034202001 | 2015-12-01 | 4737 | 2.63 | 5.4 0.7 |
| 7 | 00034205001 | 2015-12-03 | 2990 | 2.61 | 5.6 0.4 |
| 8 | 00034205002 | 2015-12-07 | 2693 | 1.62 | 5.9 0.5 |
| 9 | 00034205003 | 2015-12-09 | 2981 | 1.98 | 5.3 0.4 |
| 10 | 00034205004 | 2016-06-10 | 2933 | 4.36 | 5.9 0.5 |
| 11 | 00034205005 | 2016-06-15 | 990 | 3.79 | 5.4 0.7 |
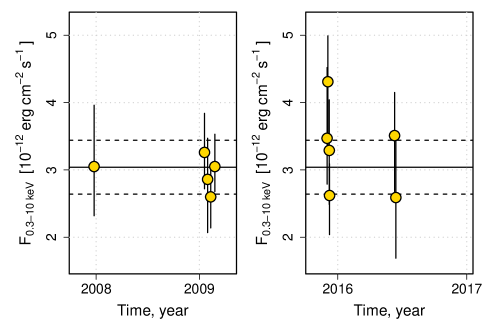
The parameters of the best fit to the spectra of M33 X-6 by the power-law model agree well between themselves. Figure 2 shows the source’s X-ray light curve from which it can be seen that there was no noticeable variability in the period of observations 2007–2016. This, as with the NuSTAR data, allows us to combine the Swift-XRT data into a single spectrum. This spectrum constructed in the energy range 0.3-–8 keV is well fitted (/d.o.f.=0.98/277) by a power-law model with a spectral index , observed flux erg cm-2 s-1 (0.3–10 keV), and line-of-sight absorption cm-2. The absorption column density estimate agrees with the column density of interstellar matter in our Galaxy in this direction (Kalberla et al., 2005).
| Obs # | FluxaaThe absorbed 0.3–10 keV flux., | /d.o.f. | ||
|---|---|---|---|---|
| cm-2 | erg cm-2 s-1 | |||
| 1 | 1.38 | 0.09 | 3.05 | 1.12/14 |
| 2 | 1.62 | 0.15 | 3.26 | 1.28/34 |
| 3 | 1.11 | 0.03 | 2.86 | 0.77/15 |
| 4 | 1.77 | 0.19 | 2.60 | 0.93/27 |
| 5 | 1.75 | 0.16 | 3.05 | 1.24/41 |
| 6 | 1.45 | 0.12 | 3.47 | 0.84/22 |
| 7 | 0.90 | 0.01 | 4.31 | 0.93/20 |
| 8 | 1.52 | 0.09 | 3.29 | 1.00/19 |
| 9 | 1.70 | 0.15 | 2.62 | 0.92/19 |
| 10 | 1.30 | 0.03 | 3.51 | 1.20/21 |
| 11 | 1.79 | 0.13 | 2.59 | 0.86/17 |
2.3 Broadband Spectrum
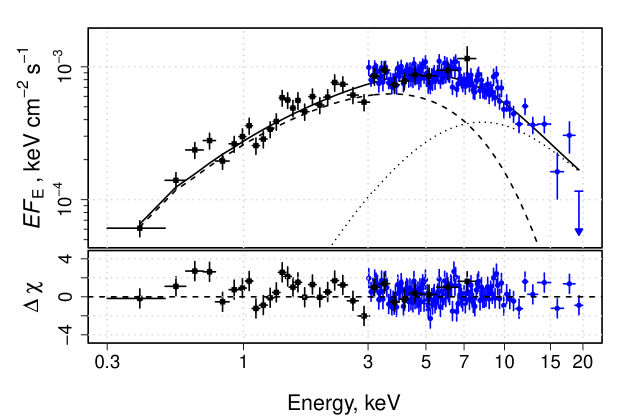
Figure 3 shows M33 X-6 broadband spectrum from 0.3 to 20 keV that was obtained by combining the NuSTAR (3–20 keV) and Swift-XRT (0.3–10 keV) data. The spectrum was fitted by a powerlaw model with an exponential cutoff and absorption. Table 5 presents the parameters of the optimal model.
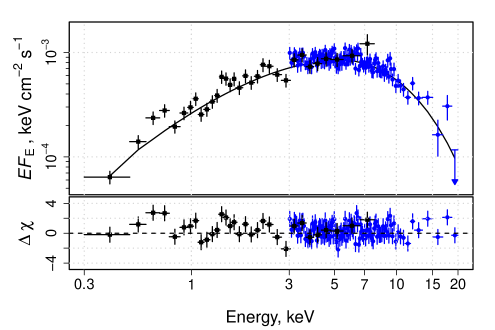
We also estimated the absorbed and unabsorbed fluxes from the source in various energy ranges (Table 5); the absorbed flux agrees with the unabsorbed one, within the measurement error limits, due to weak absorption at energies 3.0–20 keV. Assuming the distance to the object to be 817 kpc, we can estimate its luminosity at various energies: erg s-1 and erg s-1. Consequently, the source emits at the Eddington limit in the case of a neutron star and an appreciable fraction of the Eddington limit in the case of a black hole as a compact object.
As has been shown above in Sections 2.1 and 2.2, the source exhibited no strong variability over several years according to the Swift-XRT data and during 2017 according to the NuSTAR observations. The relative normalization coefficient between the Swift-XRT and NuSTAR data is , which agrees with the expected discrepancy of 10% (Madsen et al. (2015)). Since the source was not highly variable, below we fix the relative normalization between Swift-XRT and NuSTAR at unity.
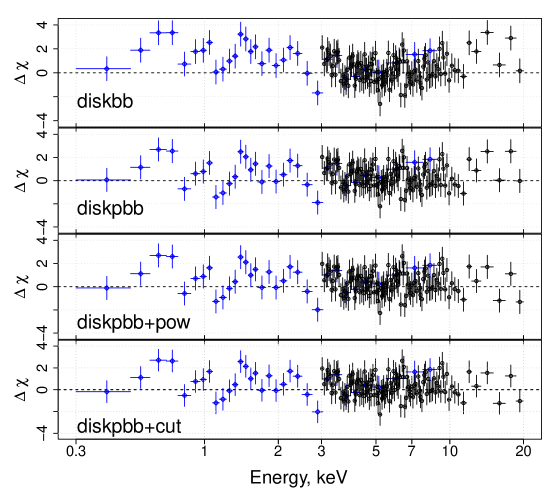
Then, we attempted to fit the broadband spectrum of M33 X-6 by other simple, but more physically motivated models that are commonly used in describing the spectra of X-ray binaries: phabsdiskbb – the standard multi-temperature accretion disk blackbody model (Shakura and Sunyaev, 1973); phabsdiskpbb – the modified accretion disk model (Mineshige et al., 1994), in which the slope of the power-law temperature distribution over the disk is a free parameter ( in the case of a standard disk); phabs(diskpbb+pow) – the disk model with an additional power-law component; and phabs(diskpbb+cutoffpl) – a similar model with a possible power-law continuum cutoff at high energies. Table 6 gives the parameters of the optimal models, while Fig. 4 shows the statistical residuals for each model, respectively.
| Parameter | Units | Value |
|---|---|---|
| cm-2 | 0.20 | |
| 0.6 | ||
| keV | 3.5 | |
| Flux, 0.3–10 keV | ||
| (absorbed) | erg cm-2 s-1 | 2.53 |
| (unabsorbed) | erg cm-2 s-1 | 2.57 |
| Flux, 3–20 keV | ||
| (absorbed) | erg cm-2 s-1 | 1.74 |
| (unabsorbed) | erg cm-2 s-1 | 1.74 |
| Flux, 0.3–20 keV | ||
| (absorbed) | erg cm-2 s-1 | |
| (unabsorbed) | erg cm-2 s-1 | |
| , | 0.99, 635.13/641 | |
is a cross-correlation constant between Swift-XRT и NuSTAR observations.
The first model describes poorly the data (), leaving a strong excess of photons at energies above 10 keV. The second model improves significantly the fit () with a temperature profile , but a noticeable data excess at high energies is still present. Adding a power-law component to the disk model does not change dramatically the statistic ( when reducing the number of degrees of freedom by 2), but on the third panel in Fig. 4 it can be seen how the excess of photons in the right part of the spectrum became smaller. The model consisting of disk emission and a power-law continuum with an exponential cutoff describes satisfactorily the data, restricting the cutoff at energy 8 keV, but it does not improve the statistic compared to the model without an exponential cutoff.
| Parameter | Units | Value |
|---|---|---|
| Model 1: phabsdiskbb | ||
| cm-2 | ||
| keV | 2.18 | |
| 10-3 | 5.6 | |
| km | 6.1 | |
| , | 1.05, 672.28/642 | |
| Model 2: phabsdiskpbb | ||
| cm-2 | 0.6 | |
| keV | 2.43 | |
| 0.64 | ||
| 10-3 | 2.4 | |
| km | 4.0 | |
| , | 1.00, 640.17/641 | |
| Model 3: phabs(diskpbb+pow) | ||
| sm-2 | 0.4 | |
| keV | 2.23 | |
| 0.67 | ||
| 10-3 | 3.5 | |
| km | 4.8 | |
| -0.12 | ||
| 10-7 | 2.9 | |
| , | 0.99, 632.49/639 | |
| Model 4: phabs(diskpbb+cutoffpl) | ||
| см-2 | 0.39 | |
| keV | 2.16 | |
| 0.68 | ||
| 10-3 | 4.3 | |
| km | 5.4 | |
| -0.58 | ||
| Cutoff energy | keV | 8.1 |
| 10-7 | 7.78 | |
| , | 0.99, 632.16/638 | |
The inner radius of the accretion disk determined by modeling the spectrum turns out to be km. Such a small radius suggests that the relativistic compact component in this binary can be a neutron star rather than a black hole, although there is a large uncertainty in the disk inclination angle with respect to the observer. In the case of a neutron star the measured X-ray luminosity of M33 X-6 erg s-1, implies that accretion occurs approximately with the critical rate.
Next, we considered the model in which the component (compTT, Titarchuk, 1994) associated with Comptonization in a cloud of hot electrons was added to the thermal accretion disk emission (diskpbb); for simplicity, the temperature of the incident photons for Comptonization was taken to be equal to the temperature of the disk at its inner boundary. This model describes the data as well (=0.99/638, Fig. 5) and models 4 and 5 considered above; the optical depth of the hot corona turns out to be approximately equal to unity, while the electron temperature of the corona is keV (Table 7).
3 Discussion and conclusions
In this paper we have constructed a broadband (0.3–20 keV) spectrum of the X-ray source M33 X-6 in the nearby galaxy M33 for the first time from the Swift-XRT (0.3–10 keV) and NuSTAR (3–20 keV) data.
| Parameter | Units | Value |
|---|---|---|
| Model 5: phabs(diskpbb+compTT) | ||
| см-2 | 0.4 0.1 | |
| keV | 1.65 | |
| 0.68 | ||
| 10-2 | 1.00 | |
| km | 8.2 | |
| keV | 12 | |
| 1.1 | ||
| , | 0.99, 632.28/638 | |
The spectrum is satisfactorily described by the modified accretion disk model diskpbb with a slope of the power-law temperature distribution in the disk , a temperature at the inner disk boundary keV, and an inner disk radius km. The quality of the fit to the data can be slightly improved by adding a hard component to the modified accretion disk model. A simple power-law component (with a slope ), a powerlaw component with an exponential cutoff at energy keV, or an accretion disk Comptonization model in a hot corona with a temperature keV and an optical depth can be used as the latter with equal success. The measured total X-ray luminosity (0.3–20 keV) of the source is erg s-1 from which about is accounted for by the hard 10––20 keV X-ray band.
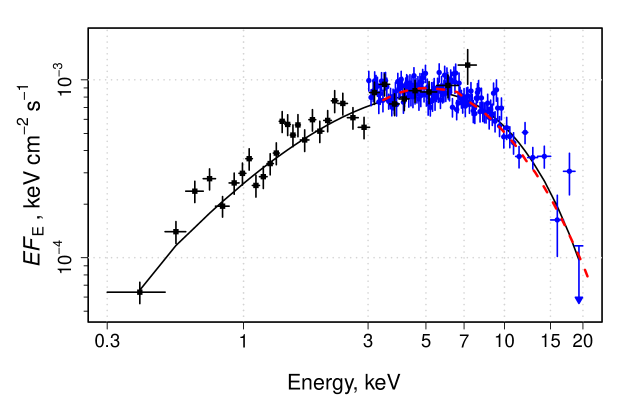
The set of characteristics listed above provides strong evidence that accretion onto a neutron star with a rate approximately equal to the critical one may occur in the binary M33 X-6. Similar X-ray spectra and luminosities have long been observed in our Galaxy for a number of low-mass highluminosity binaries, the so-called -sources (see Hasinger and van der Klis, 1989). Indeed, as shown in Fig. 6, our spectrum of M33 X-6 is very similar, for example, to the spectrum of the well-studied -source XTE J1701–462 in one of its spectral states (Revnivtsev et al., 2013). However, it should be noted that the spectra of Z-sources vary noticeably both from source to source and from observation to observation for individual objects (see, e.g., Lin et al. 2009; Revnivtsev et al. 2013). It is believed that in objects of this type we deal with subcritical accretion onto a weakly magnetized neutron star. The X-ray spectrum of -sources is usually described by a combination of soft accretion disk emission and hard neutron star boundary layer emission Revnivtsev et al. (2013); Gilfanov et al. (2003), which can be fitted by a power law with a cutoff or Comptonization, as was done in this paper. Thus, the source M33 X-6 being discussed here can become one of the first candidates for -sources outside our Galaxy (and its companions). Previously, Barnard et sl. (2003) detected spectral properties and variability for the source RX J0042.6+4115 in the galaxy M31 characteristic for -sources.
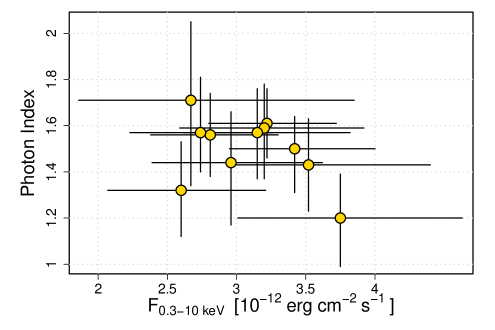
However, as has been noted in Subsection 2.2, the observed X-ray flux from M33 X-6 exhibits no strong variability (e.g., Tullmann et al., 2011), which is atypical for X-ray binaries (see, e.g., McClintock and Remillard, 2006) and Z-sources, in particular (Homan et al., 2007). In searching for possible changes in the spectral hardness of M33 X-6, we fitted the data by a power law with fixed photoabsorption cm-2. As follows from Fig. 7, where the photon index is plotted against the observed flux, no pronounced changes in the spectral state were found. However, the errors in the spectral slope and X-ray flux are very large, because the exposures of the Swift-XRT observations used are short. We are going to perform a more detailed study of the M33 X-6 variability in our succeeding paper using additional data from other X-ray telescopes.
ACKNOWLEDGMENTS
The results presented in this paper were obtained with the Neil Gehrels (Swift) and NuSTAR orbital observatories. This work was supported by the Russian Science Foundation (project no. 14-12-01315).
References
- Barnard et sl. (2003) 1. Barnard R., Kolb U., Osborne J.P., Astronomy and Astrophysics, 411, p.553-557 (2003)
- Gilfanov et al. (2003) 2. Gilfanov, M.; Revnivtsev, M.; Molkov, S., Astronomy and Astrophysics, 410 (2003)
- Giacconi et al. (1979) 3. Giacconi R., Branduardi G., Briel U., Epstein A., Fabricant D., Feigelson E., Forman W., Gorenstein P., et al., Astrophys. J. 230, 540 (1979).
- Gehrels et al. (2004) 4. Gehrels N., Chincarini G., Giommi P., Mason K. O., Nousek J. A., Wells A. A., White N. E., Barthelmy S. D., et al., Astrophys. J. 611, 1005 (2004).
- Kalberla et al. (2005) 5. Kalberla P. M. W., Burton W. B., Hartmann D., Arnal E. M., Bajaja E., Morras R. and Pöppel W. G. L., Astron. Astrophys. 440, 775 (2005).
- Krivonos et al. (2018) 5.Krivonos R. , Sazonov S., Tsygankov S. S. and Poutanen J., , MNRAS 480, 2357 (2018).
- Long et al. (1981) 6. Long K. S., Dodorico S., Charles P. A. and Dopita M. A., Astrophys. J. 246, L61 (1981).
- Lin et al. (2009) 7. Lin Dacheng, Remillard Ronald A., Homan Jeroen, The Astrophysical Journal, 696, 2, (2009).
- Long et al. (1996) 8. Long K. S., Charles P. A., Blair W. P. and Gordon S. M., Astrophys. J. 466, 750 (1996).
- Madsen et al. (2015) 9. Madsen K. K., Harrison F. A., Markwardt C. B., An Hongjun, Grefenstette Brian W., Bachetti Matteo, Miyasaka Hiromasa, Kitaguchi Takao et al., ApJS 220, 8M (2015).
- McClintock and Remillard (2006) 10. McClintock J. and Remillard R., Compact Stellar X-ray Sources, ed. W. H. G. Lewin & M. van der Klis, Cambridge Univ. Press, 157 (2006).
- Mineshige et al. (1994) 11. Mineshige S., Hirano A., Kitamoto S., Yamada T. T., and Fukue J., Astrophys. J. 426, 308M (1994).
- Markert and Rallis (1983) 12. Markert T. H., and Rallis A. D., Astrophys. J. 275, 571 (1983).
- Misanovic et al. (2006) 13. Misanovic Z., Pietsch W., Haberl F., Ehle M., Hatzidimitriou D. and Trinchieri G., Astron. Astrophys. 448, 1247 (2006).
- Moretti et al. (2005) 14. Moretti A., Campana S., Mineo T., Romano Patrizia, Abbey A. F., Angelini L., Beardmore A., Burkert W., et al., UV, X-Ray, and Gamma-Ray Space Instrumentation for Astronomy XIV 5898, 360M (2005).
- Plucinsky et al. (2008) 15. Plucinsky Paul P., Williams Benjamin, Long Knox S., J. Gaetz Terrance, Sasaki Manami, Pietsch Wolfgang, Tüllmann Ralph, Smith Randall K, et al., Astrophys. J. Suppl. Ser. 174, 366 (2008).
- Pietsch et al. (2004) 16. Pietsch W., Misanovic Z., Haberl F., Hatzidimitriou D., Ehle M. and Trinchieri G., Astron. Astrophys. 426, 11 (2001).
- Revnivtsev et al. (2013) 17. Revnivtsev Mikhail G., Suleimanov Valery F., Poutanen Juri, Monthly Notices of the Royal Astronomical Society, 434, 3, (2013).
- Titarchuk (1994) 18. Titarchuk L., Astrophys. J. 434, 570T (1994).
- Trinchieri et al. (1988) 19. Trinchieri G., Fabbiano G., Peres G., Astrophys. J. 325, 531 (1988).
- Tullmann et al. (2011) 20. Tüllmann R., Gaetz T. J., Plucinsky P. P., Kuntz K. D., Williams B. F., Pietsch W., Haberl F., Long K. S., et.al., Astrophys. J. Suppl. Ser. 193, 31 (2011).
- Freedman et al. (2001) 21. Freedman Wendy L., Madore Barry F., Gibson Brad K., Ferrarese Laura, Kelson Daniel D., Sakai Shoko, Mould Jeremy R., Kennicutt Robert C., Jr., et al., Astrophys. J. 553, 47 (2001).
- Haberl and Pietsch (2001) 22. Haberl F. and Pietsch W., Astrophys. J. 373, 438 (2001).
- Hasinger and van der Klis (1989) 23. Hasinger G., van der Klis M., Astron. Astrophys., 225, 79 (1989)
- Harrison et al. (2013) 24. Harrison Fiona A., Craig William W., Christensen Finn E., Hailey Charles J., Zhang William W., Boggs Steven E., Stern Daniel, Cook W. Rick, et al., Astrophys. J. Suppl. Ser. 770, 103 (2013).
- Homan et al. (2007) 25. Homan Jeroen, Michiel van der Klis, Wijnands Rudy, Belloni Tomaso, Fender Rob, Klein-Wolt Marc, Casella Piergiorgio, Méndez Mariano, Gallo Elena, Lewin Walter H. G., Gehrels Neil, The Astrophysical Journal, 656, 1 (2013)
- Shakura and Sunyaev (1973) 26. Shakura N. I., Sunyaev R. A., Astron. Astrophys. 24, 337 (1973).
- Schulman and Bregman (1995) 27. Schulman E., Bregman J. N., Astrophys. J. 441, 568 (1995).
- U et al. (2009) 28. U Vivian, Urbaneja Miguel A., Kudritzki Rolf-Peter, Jacobs Bradley A., Bresolin Fabio, Przybilla Norbert, Astrophys. J. 704, 1120 (2009).