One thousand days of SN 2015bn: HST imaging shows a light curve flattening consistent with magnetar predictions
Abstract
We present the first observations of a Type I superluminous supernova (SLSN) at days after maximum light. We observed SN 2015bn using the Hubble Space Telescope Advanced Camera for Surveys in the F475W, F625W and F775W filters at 721 days and 1068 days. SN 2015bn is clearly detected and resolved from its compact host, allowing reliable photometry. A galaxy template constructed from these data further enables us to isolate the SLSN flux in deep ground-based imaging. We measure a light curve decline rate at days of mag (100 d)-1, much shallower than the earlier evolution, and slower than previous SLSNe (at any phase) or the decay rate of 56Co. Neither additional radioactive isotopes nor a light echo can consistently account for the slow decline. A spectrum at 1083 days shows the same [O I] 6300 and [Ca II] 7300 lines as seen at days, with no new features to indicate strong circumstellar interaction. Radio limits with the Very Large Array rule out an extended wind for mass-loss rates M⊙ yr-1 (where is the wind velocity in units of 10 km s-1). The optical light curve is consistent with , which we show is expected for magnetar spin-down with inefficient trapping; furthermore, the evolution matches predictions from earlier magnetar model fits. The opacity to magnetar radiation is constrained at cm2 g-1, consistent with photon-matter pair-production over a broad GeV–TeV range. This suggests the magnetar spectral energy distribution, and hence the ‘missing energy’ leaking from the ejecta, may peak in this range.
1 Introduction
Hydrogen-poor superluminous supernovae (Type I SLSNe; here simply SLSNe) are a rare class of massive star explosions with typical peak absolute magnitudes mag (Quimby et al., 2011; Chomiuk et al., 2011). Despite intense observational and theoretical study, the energy source underlying their light curves has remained uncertain (e.g. Moriya et al., 2018).
Normal stripped envelope SNe are powered by M⊙ of synthesized 56Ni (e.g. Drout et al., 2011), whereas SLSNe would require several solar masses if that was the primary energy source. Such a large 56Ni mass conflicts with the early light curves (Nicholl et al., 2013), late-time limits (Blanchard et al., 2018), and with spectra (Dessart et al., 2012; Jerkstrand et al., 2017; Nicholl et al., 2018), but a number of SLSNe do fade at a rate that resembles the decay of 56Co, the daughter nucleus of 56Ni (Gal-Yam et al., 2009; De Cia et al., 2017).
The most popular model for SLSNe is the spin-down of a millisecond magnetar with magnetic field G (Kasen & Bildsten, 2010). While this reproduces most SLSN observables (Inserra et al., 2013; Nicholl et al., 2017), a ‘smoking gun’ has proven elusive; thus competing models, such as ejecta interacting with a circumstellar medium (CSM), remain competitive. It was hoped that a magnetar engine could drive an X-ray breakout months after the explosion (Metzger et al., 2014), but this has not been detected (Margutti et al., 2017; Inserra et al., 2017), and more recent (and realistic) models predict that breakouts should be rare (Margalit et al., 2018).
A more robust test for the magnetar engine comes from the late-time light curve. The spin-down luminosity ultimately follows a power-law, , so eventually the decline should become shallower than 56Co decay, which follows an exponential (half-life days). While many SLSN light curves have been observed to flatten at late times, the spin-down rate can remain within a factor of a few of 56Co decay for hundreds of days (Inserra et al., 2013; Moriya et al., 2017), and most SLSNe are too distant to follow to such late phases.
In this Letter, we report the first detections of a Type I SLSN at days after maximum light. SN 2015bn is a slowly-evolving SLSN at , and has been extensively studied at earlier times (Nicholl et al., 2016a, b; Inserra et al., 2016; Jerkstrand et al., 2017; Leloudas et al., 2017). New imaging with the Hubble Space Telescope (HST) and Magellan reveals a marked flattening in the light curve after days, consistent with a power law, and a decline rate that is now significantly slower than 56Co decay. Spectroscopy and radio follow-up show no signs of circumstellar interaction. After eliminating several other possibilities, we argue that this is best interpreted as the signature of a magnetar engine.
2 Observations
2.1 Optical imaging
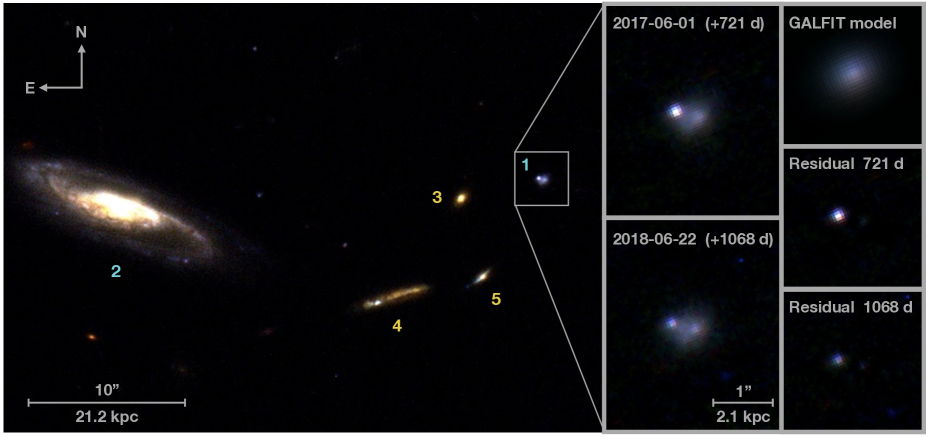
We imaged SN 2015bn using the HST Advanced Camera for Surveys Wide Field Channel111Program IDs: 14743,15252; PI: Nicholl on 2017-06-01.4 and 2018-06-22.3 (all dates in UT), corresponding to 721 and 1068 days after maximum light in the rest-frame of SN 2015bn. Visits consisted of one orbit per filter in F475W, F625W and F775W, corresponding closely to , and bands, where we expect most of the strong emission lines (Nicholl et al., 2016b; Jerkstrand et al., 2017; Nicholl et al., 2018). Each image contained four dithers in a standard box pattern.
We retrieved the fully processed and drizzled images from the Mikulski Archive for Space Telescopes. Figure 1 shows the combined three-colour images. SN 2015bn is clearly visible as a point source superimposed on its host galaxy. We removed the host using a galaxy model constructed with galfit (Peng et al., 2002), fitting a Sérsic profile while masking the pixels that were clearly dominated by SN 2015bn. There were no significant differences between the fits obtained in the individual epochs. Subtracting the model from the HST images resulted in a clean SN detection with minimal galaxy residuals, as shown in Figure 1. We then performed point-spread function (PSF) photometry with daophot, and applied standard zeropoints222http://www.stsci.edu/hst/acs/analysis/zeropoints. We verified that the zeropoints were consistent between the two epochs (to within mag) using 16 stars from the Pan-STARRS Data Release 1 catalog (Flewelling et al., 2016).
We obtained ground-based imaging on 2017-02-01.3 and 2018-03-18.7 using the Low Dispersion Survey Spectrograph 3 (LDSS3) on the 6.5-m Magellan Clay telescope. Each observation consisted of 10300 s dithered -band exposures, which we reduced in pyraf. From the ground, SN 2015bn appears entirely blended with its (much brighter) host. Subtracting the galfit model derived from the HST data, after convolving to the ground-based resolution using hotpants333https://github.com/acbecker/hotpants, we isolated the SN light and performed PSF photometry, determining the zeropoints using the Pan-STARRS catalog.
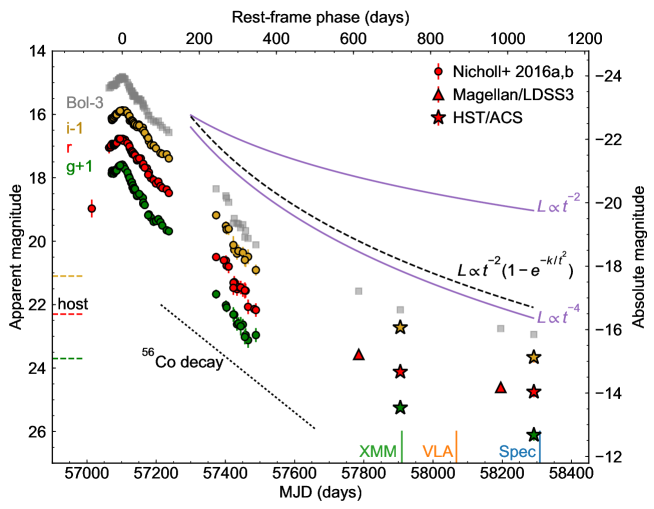
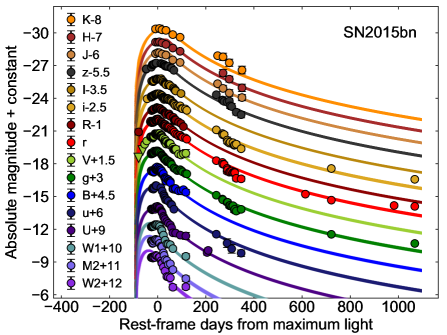
Our photometry is plotted in Figure 2, along with earlier data from Nicholl et al. (2016a, b). The latest points are fainter than the peak by a factor , but a flattening in the light curve beyond days is immediately apparent. The new data have been submitted to the Open Supernova Catalog (Guillochon et al., 2017).
2.2 SN spectroscopy
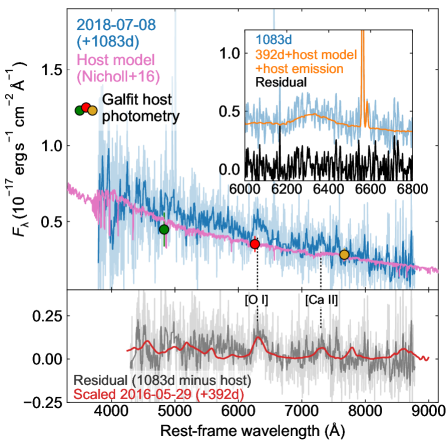
We observed SN 2015bn spectroscopically on 2018-07-08.9 (1083 rest-frame days after maximum) using LDSS3. The data were reduced in pyraf, with flux calibration achieved using a standard star. The spectrum is shown in Figure 3. The mean airmass during the observation was 1.6, and the spectrum redwards of Å is contaminated by noise residuals from sky subtraction.
Although the spectrum is dominated by the host, the strongest emission lines from SN 2015bn appear to be visible above the galaxy light. We subtract a model for the host continuum (Nicholl et al., 2016a), and compare to the most recent prior spectrum (at 392 days after maximum; Nicholl et al., 2016b), scaled to match the latest HST observations. We find that the broad feature at 6300 Å is consistent with predictions for [O I] 6300, while a tentative feature at 7300 Å matches [Ca II] 7300. This indicates that the lines have changed little, despite a gap of 691 days. Our new spectrum likely represents the oldest spectroscopic detection with respect to explosion for any SLSN: the normalized phase is in the terminology of Nicholl et al. (2018), where days is the decline timescale of the light curve.
2.3 Galaxy spectroscopy
We also obtained spectra of three galaxies that apparently neighbour SN 2015bn (labelled 3–5 in Figure 1). We find they are a background group at unrelated to SN 2015bn. The bright () spiral galaxy (2) has a spectrum from the Sloan Digital Sky Survey Data Release 7 (Abazajian et al., 2009) that indicates , similar to SN 2015bn.
The relative line-of-sight velocity between this galaxy and the SN host is km s-1, while their projected separation is kpc. These values are similar to the Magellanic Clouds relative to the Milky Way, and the absolute magnitude (), physical size, star-formation rate and metallicity of the host (Nicholl et al., 2016a) are all similar to the SMC. Thus the host and its bright neighbour appear to be a close analogue of the MW-SMC system.
Chen et al. (2017) found that the host of one SLSN, LSQ14mo, was in a likely interacting system with a projected separation of 15 kpc, and proposed that this could increase the likelihood of SLSNe by triggering vigorous star formation. The brightest and bluest pixels in our HST images, likely corresponding to the highest star-formation rate, actually appear to be on the other side of the galaxy, though we cannot exclude comparable star-formation at the position of SN 2015bn until the SLSN has completely faded.
2.4 Radio observations
We observed SN 2015bn using the Karl G. Jansky Very Large Array (VLA) in B configuration, on 2017-11-10 (867 rest-frame days after maximum)444Program ID: 17B-164; PI: Nicholl. SN 2015bn was not detected to limiting flux densities of 48 Jy in K band (21.8 GHz) and 63 Jy in Ka band (33.5 GHz).
3 Analysis
The principal discovery from our observations is the shallow light curve beyond 500 days. The mean slope in between the HST epochs is mag (100 d)-1. Integrating the flux over these bands yields a similar pseudobolometric decline of mag (100 d)-1. This is the slowest decline rate measured for any hydrogen-poor SLSN, and is significantly slower than the 1.43 mag (100 d)-1 during the first 400 days (Nicholl et al., 2016b), and the 56Co decay rate of 0.98 mag (100 d)-1.
Since few SLSNe have deep observations at this phase, it is possible that others reach a similarly slow decline; however, the only other SLSN with photometry at a comparable phase, PTF10nmn, did not show a change in slope up to days (De Cia et al., 2017). The light curve of PS1-14bj appeared to reach to a slope flatter than 56Co by around 400 days (Lunnan et al., 2016), but further monitoring was not available to confirm this. We now examine possible causes of the flattening in SN 2015bn.
3.1 Light echo?
Light echoes occur when light emitted earlier in the SN evolution is reflected into our line of sight by nearby dust sheets, giving an apparent luminosity boost after a light travel time. For nearby SNe, this is readily identifiable through a change in the spatial emission profile, but at the distance of SN 2015bn, 1 light year corresponds to only arcseconds. An echo beginning years after explosion could roughly match the late-time brightness if it was magnitudes fainter than the light curve peak. Lunnan et al. (2018) recently detected the first light echo in a H-poor SLSN, iPTF16eh, via a Mg II resonance line.
There are several issues with interpreting the behaviour of SN 2015bn as an echo. First, the luminosity of an echo is expected to evolve as (e.g Graur et al., 2018), which is flatter than what we observe. Second, the spectrum is consistent with a typical SLSN nebular spectrum, whereas an echo should contain features from earlier phases, when the SN was brighter. However, we caution that the spectrum is noisy and dominated by host galaxy light.
Finally, dust is more efficient in reflecting blue light, which changes the observed colours. We measure at 1068 days, which is consistent with the colour at 300 days () but not with the peak (). A similar finding applies to and . We therefore conclude that an echo cannot explain the slow evolution.
3.2 Radioactive isotopes?
Follow-up of nearby SNe at days has revealed evidence for the decay chain 57NiCoFe, in both core-collapse (Seitenzahl et al., 2014) and Type Ia SNe (Shappee et al., 2017; Graur et al., 2018). While the relative abundance of 57Ni is typically low (57Ni/56Ni ), the long lifetime of 57Co (half-life days) means that it eventually comes to dominate over 56Co.
The decay slope for 57Co is 0.28 mag (100 d)-1, which is comparable to our light curve, but still somewhat faster. A small contribution from the slower reaction 55FeMn (half-life days) could help to mitigate this. Seitenzahl et al. (2014) also looked for signatures of 60Co and 44Ti in SN 1987A, but the half-lives of these species are too long (5–60 years) to be relevant to SN 2015bn yet.
The more significant problem for this scenario is that the pseudobolometric luminosity of SN 2015bn at 900 days is erg s-1, i.e. 400–4000 times greater than SNe Ia at the same phase (Graur et al., 2018). The required 57Co mass is M⊙. We are not aware of any explosion model capable of producing this; even the most massive pair-instability models from Heger & Woosley (2002) synthesize an order of magnitude less 57Co (while making 40 M⊙ of 56Co). For a solar ratio of 57Co/56Co (Lodders, 2003), the implied 56Co mass would be M⊙.
3.3 Circumstellar interaction?
Assuming a velocity of km s-1 (Nicholl et al., 2016a, b), the ejecta expand to a radius cm within 1000 days, and the fastest ejecta likely reach cm. Yan et al. (2017) found that up to % of SLSNe encounter hydrogen-rich CSM at cm, as indicated by the sudden appearance of broad hydrogen emission lines in their spectra, while Lunnan et al. (2018) identified a circumstellar shell at cm around iPTF16eh from its light echo. Thus interaction with a massive CSM at a similar radius could be a plausible luminosity source for SN 2015bn.
However, none of the interacting events in Yan et al. (2017) showed a shallow light curve resembling SN 2015bn, though the interaction in those events occurred much earlier (100–250 days) when the SLSNe were orders of magnitude brighter. Chen et al. (2018) recently studied SN 2017ens, another SLSN that developed strong and broad H emission at days, finding its light curve was essentially flat at this phase.
We examine the H region of our spectrum in Figure 3. We subtract a model consisting of the scaled 392-day spectrum and a linear host continuum, and fit the H and [N II] lines with Gaussian profiles. A satisfactory fit is obtained with the width fixed at the instrumental resolution; i.e. the lines are unresolved, and no broad component is present above the level of the noise. The flux in H is erg s-1 cm-2, consistent with host emission (Nicholl et al., 2016a).
While H is generally the strongest line in SNe interacting with hydrogen-rich material, interaction with hydrogen-free material is more difficult to exclude. Ben-Ami et al. (2014) detected narrow [O I] emission from SN 2010mb, and proposed it was a signature of interaction. We do not observe this line in SN 2015bn to a limit of erg s-1, which is times fainter than the line in SN 2010mb up to one year after explosion. A possible caveat is that this line is only predicted to be strong at densities g cm-3.
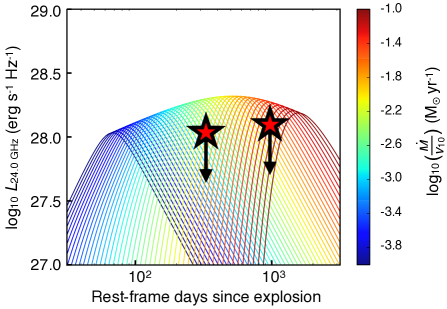
Late-onset interaction in other events has been interpreted as a collision with a detached shell, but a slow decline could also result from an extended dense wind. Figure 4 shows predicted radio emission for SNe interacting with winds of different densities (Kamble et al., 2016), which we compare to our VLA limit and an earlier limit from Nicholl et al. (2016a). Parameterising the wind mass-loss rate as , where is the wind velocity in units of 10 km s-1, the combined limits at 1–3 years rule out winds with M⊙ yr-1. For a typical Wolf-Rayet wind velocity km s-1, this corresponds to M⊙ yr-1, excluding a wind significantly more dense than those from SN Ic progenitors (e.g. Berger et al., 2002; Soderberg et al., 2006; Drout et al., 2015).
Comparing to models for the optical luminosity from Nicholl et al. (2016a), this rules out most of the parameter space where the light curve peak can be powered by interaction with a dense wind, and also disfavours this as the primary late-time power source.
3.4 Magnetar spin-down?
The most popular model for SLSNe is a magnetar engine. At late times the engine power decays as ; a standard magnetic dipole has . A long-standing prediction is that SLSNe should eventually track this power-law. While many SLSN light curves have been observed to flatten with time, late observations have generally been either similar to 56Co decay (Inserra et al., 2013) or of insufficient signal-to-noise ratio (Lunnan et al., 2016) to make strong statements.
In Figure 2, we plot representative curves for and . The best-fitting power-law at 200–1100 days has , steeper than a standard dipole. However, it is expected that the energy available from spin-down is not completely thermalized at late-times; assuming this energy is injected primarily as high-energy photons, the optical depth in the expanding ejecta decreases with time as (Wang et al., 2015; Chen et al., 2015). Including this ‘leakage’ term gives
| (1) |
where is the trapping coefficient, and are the mass and velocity of the ejecta and is the opacity to high-energy photons. The second equality comes from a Taylor expansion applicable at late times. Thus a realistic power-law is not , but rather , close to what we observe.
We model the full light curve of SN 2015bn using mosfit (Guillochon et al., 2018). SN 2015bn has previously been fit using this code and a magnetar model by Nicholl et al. (2017), who describe the methodology. The result is shown in Figure 5. Given that new data comprise only of the total light curve points, it is unsurprising that the fit is unchanged with respect to Nicholl et al. (2017). We find a spin period , magnetic field , and ejecta mass . More interesting is that the best fit to the first 400 days gave a reasonably accurate prediction of the evolution at days. The model matches the data at 721 days, and agrees to better than a factor two at 1083 days, though the later data appear systematically above the fit. The previous modelling suggested cm2 g-1, which we confirm here.
3.4.1 Is there a ‘missing energy problem’?
The requirement for inefficient trapping has important implications. Our model implies that by days the engine is injecting erg s-1, but only a few percent is thermalised, indicating a large fraction of ‘missing energy’ escaping. Bhirombhakdi et al. (2018) imaged SN 2015bn in soft X-rays at 725 days. They detected no flux at 0.3–10 keV to a limit of erg s-1 prompting them to conclude that of the magnetar input escapes in this range. The energy does not escape in the radio either; using our derived parameters from mosfit, Margalit et al. (2018) predict that the ejecta will remain optically thick to free-free absorption at GHz for approximately 10 years, consistent with our VLA non-detections.
Metzger et al. (2014) describe how the magnetar should inflate a nebula of energetic particles and radiation. When the nebula is initially ‘compact’, photon-photon pair creation gives a relatively flat spectral energy distribution (SED) with an upper cut-off at MeV. Using their equation 13 and our parameters from mosfit, we find a dimensionless compactness parameter by maximum light and at the timescales we probe here. At low compactness, the SED cut-off moves up to the GeV-TeV range. The dominant opacity is then from photon-matter pair creation, which has an opacity cm2 g-1 over many orders of magnitude in energy (Zdziarski & Svensson, 1989). The fact that the value of inferred from optical data agrees with this range may provide indirect evidence that the magnetar SED is peaking in high-energy gamma-rays, and that the escape of this radiation is the source of missing energy. Renault-Tinacci et al. (2018) searched for GeV leakage from SLSNe with Fermi, but their limits were not deep enough to detect erg s-1, leaving open this possibility.
3.5 Freeze-out?
The mechanisms discussed in sections 3.2–3.4 assume that energy deposition is instantaneous. However, if the heat source is coupled to the ejecta through ionization and recombination, this assumption holds only if the recombination timescale is shorter than the heating timescale, which may not be true at late times when the ejecta density is low. This process of ‘freeze-out’ can result in a light curve tracking the recombination rate instead of the heating rate (Fransson & Kozma, 1993; Fransson & Jerkstrand, 2015).
Following Kerzendorf et al. (2017) and Graur et al. (2018), we parameterize freezeout as a luminosity source that evolves as (i.e. in proportion to the density, assuming constant expansion). Graur et al. (2018) define as the time when freezeout accounts for half of the emission. If freezeout dominates by days, we find days. This is much earlier than in SN 1987A and a number of nearby SNe Ia, for which the timescales are typically days (Fransson & Kozma, 1993; Graur et al., 2018). It therefore seems unlikely that freezeout alone can account for the flattening, but more detailed modelling is required here.
4 Discussion and conclusions
We have presented optical imaging, spectroscopy and deep radio limits for SN 2015bn at days after maximum light. HST images enabled us to localise the faint SN within its compact host, and reliably extract its flux. We found a significant flattening in the light curve, which is now much slower than 56Co decay, while the spectrum remains consistent with previous observations at days.
We showed that the spectrum, colours and decline rate were inconsistent with a light echo. The luminosity, erg s-1, is too large for slowly-decaying radioactive isotopes like 57Co; the required M⊙ far exceeds any physical model of which we are aware. Late-time circumstellar interaction is a more plausible mechanism to slow the light curve, however neither the spectrum nor radio data indicate interaction. In particular, SN 2015bn lacks the broad H seen in other SLSNe that interact at late times (Yan et al., 2017).
The light curve shape can be reproduced with a power-law, , which we show is expected for a magnetar engine with incomplete trapping. In fact, the same magnetar parameters inferred from earlier data naturally predict an evolution in reasonable agreement with our observations. Our fit suggests that only a few percent of the erg s-1 input is thermalised at this phase, suggesting significant luminosity from leakage at other wavelengths. However, our radio data, and soft X-ray data from Bhirombhakdi et al. (2018), have yielded non-detections. The opacity to magnetar input inferred from our light curve modelling, cm2 g-1, suggests a harder spectrum, likely concentrated at MeV, which may be where the missing energy is escaping.
While SN 2015bn is the first SLSN observed to reach a decline much shallower than 56Co decay, there is a recent example of a SN Ic, iPTF15dtg, exhibiting similar behaviour. Taddia et al. (2018) interpreted this as a signature of magnetar powering. We note that the nebular spectrum of iPTF15dtg closely resembles SN 2015bn, and shows several features, such as prominent O I 7774 and [O III] 5007, which are more characteristic of SLSNe than normal SNe Ic (Milisavljevic et al., 2013; Nicholl et al., 2016b, 2018).
The strength of any [O III] emission in our latest spectrum is difficult to establish given the low S/N, however it is clearly weaker than the line we identify as [O I]. This is interesting given that (Chevalier & Fransson, 1992) find that in a pulsar-energised SN at this phase, [O III] should often be the strongest line. Following their discussion, the high ratio of [O I]/[O III] could indicate a large ejecta mass, such that the highly-ionised region does not extend too far in mass coordinate (Metzger et al., 2014), and/or significant clumping (a density enhancement ), which can boost the [O I] emission (see also Jerkstrand et al., 2017).
The latest photometry of SN 2015bn, at 1068 days, is slightly brighter than the predictions of the basic magnetar model. While we caution that this is based on only two epochs, such an effect could be interpreted as evidence that the power-law is not exactly , e.g. Metzger et al. (2018) have shown that accretion onto a magnetar can alter its spin-down. Alternatively, low-level interaction may be a factor, perhaps connected to earlier undulations in the light curve (Nicholl et al., 2016a; Inserra et al., 2017). Finally, we cannot exclude a small contribution from freezeout effects.
Obtaining observations of additional nearby SLSNe at days will be required to determine if the slow decline observed in SN 2015bn is ubiquitous, and whether it is indeed the long-awaited smoking gun for the magnetar. The closest events may hold further promise for detecting leakage of the input energy, and directly probing the engine SED; we suggest such searches should focus on hard X-rays and gamma-rays.
References
- Abazajian et al. (2009) Abazajian, K. N., Adelman-McCarthy, J. K., Agüeros, M. A., et al. 2009, ApJS, 182, 543
- Berger et al. (2002) Berger, E., Kulkarni, S., & Chevalier, R. 2002, ApJ, 577, L5
- Ben-Ami et al. (2014) Ben-Ami, S., Gal-Yam, A., Mazzali, P. A., et al. 2014, ApJ, 785, 37
- Bhirombhakdi et al. (2018) Bhirombhakdi, M., Chornock, R., Margutti, R., Nicholl, M., Metzger, B. D., Berger, E., Margalit, B., Milisavljevic, D., & 2018, arXiv:1809.02760
- Blanchard et al. (2018) Blanchard, P. K., Nicholl, M., Berger, E., et al. 2018, ApJ, 865, 9
- Chen et al. (2015) Chen, T.-W., Smartt, S. J., Jerkstrand, A., et al. 2015, MNRAS, 452, 1567
- Chen et al. (2017) Chen, T.-W., Nicholl, M., Smartt, S., et al. 2017, Astronomy & Astrophysics, 602, A9
- Chen et al. (2018) Chen, T.-W., Inserra, C., Fraser, M., et al. 2018, arXiv:1808.04382
- Chevalier & Fransson (1992) Chevalier, R. A., & Fransson, C. 1992, ApJ, 395, 540
- Chomiuk et al. (2011) Chomiuk, L., Chornock, R., Soderberg, A., et al. 2011, ApJ, 743, 114
- De Cia et al. (2017) De Cia, A., Gal-Yam, A., Rubin, A., et al. 2018, ApJ, 860, 100
- Dessart et al. (2012) Dessart, L., Hillier, D. J., Waldman, R., Livne, E., & Blondin, S. 2012, MNRAS, 426, L76
- Drout et al. (2015) Drout, M., Milisavljevic, D., Parrent, J., et al. 2016, ApJ, 821, 57
- Drout et al. (2011) Drout, M. R., Soderberg, A. M., Gal-Yam, A., et al. 2011, ApJ, 741, 97
- Flewelling et al. (2016) Flewelling, H., Magnier, E., Chambers, K., et al. 2016, arXiv:1612.05243
- Fransson & Jerkstrand (2015) Fransson, C., & Jerkstrand, A. 2015, ApJ, 814, L2
- Fransson & Kozma (1993) Fransson, C., & Kozma, C. 1993, ApJ, 408, L25
- Gal-Yam et al. (2009) Gal-Yam, A., Mazzali, P., Ofek, E., et al. 2009, Nature, 462, 624
- Graur et al. (2018) Graur, O., Zurek, D. R., Rest, A., et al. 2018, ApJ, 859, 79
- Guillochon et al. (2017) Guillochon, J., Parrent, J., Kelley, L. K., & Margutti, R. 2017, ApJ, 835, 64
- Guillochon et al. (2018) Guillochon, J., Nicholl, M., Villar, V. A., et al. 2018, ApJS, 236, 6
- Heger & Woosley (2002) Heger, A., & Woosley, S. 2002, ApJ, 567, 532
- Inserra et al. (2016) Inserra, C., Bulla, M., Sim, S., & Smartt, S. 2016, ApJ, 831, 79
- Inserra et al. (2013) Inserra, C., Smartt, S., Jerkstrand, A., et al. 2013, ApJ, 770, 128
- Inserra et al. (2017) Inserra, C., Nicholl, M., Chen, T.-W., et al. 2017, MNRAS, 468, 4642
- Jerkstrand et al. (2017) Jerkstrand, A., Smartt, S. J., Inserra, C., et al. 2017, ApJ, 835, 13
- Kamble et al. (2016) Kamble, A., Margutti, R., Soderberg, A. M., et al. 2016, ApJ, 818, 111
- Kasen & Bildsten (2010) Kasen, D., & Bildsten, L. 2010, ApJ, 717, 245
- Kerzendorf et al. (2017) Kerzendorf, W., McCully, C., Taubenberger, S., et al. 2017, MNRAS, 472, 2534
- Leloudas et al. (2017) Leloudas, G., Maund, J. R., Gal-Yam, A., et al. 2017, ApJ, 837, L14
- Lodders (2003) Lodders, K. 2003, ApJ, 591, 1220
- Lunnan et al. (2016) Lunnan, R., Chornock, R., Berger, E., et al. 2016, ApJ, 831, 144
- Lunnan et al. (2018) Lunnan, R., Fransson, C., Vreeswijk, P., et al. 2018, arXiv:1808.04887
- Lunnan et al. (2018) Lunnan, R., Chornock, R., Berger, E., et al. 2018, ApJ, 852, 81
- Margalit et al. (2018) Margalit, B., Metzger, B. D., Berger, E., et al. 2018, MNRAS, 481, 2406
- Margutti et al. (2017) Margutti, R., Chornock, R., Metzger, B., et al. 2018, ApJ, 864, 45
- Metzger et al. (2018) Metzger, B. D., Beniamini, P., & Giannios, D. 2018, ApJ, 857, 95
- Metzger et al. (2014) Metzger, B. D., Vurm, I., Hascoët, R., & Beloborodov, A. M. 2014, MNRAS, 437, 703
- Milisavljevic et al. (2013) Milisavljevic, D., Soderberg, A. M., Margutti, R., et al. 2013, ApJ, 770, L38
- Moriya et al. (2017) Moriya, T. J., Chen, T.-W., & Langer, N. 2017, ApJ, 835, 177
- Moriya et al. (2018) Moriya, T. J., Sorokina, E. I., & Chevalier, R. A. 2018, Space Science Reviews, 214, 59
- Nicholl et al. (2018) Nicholl, M., Berger, E., Blanchard, P. K., Gomez, S., & Chornock, R. 2018, arXiv:1808.00510
- Nicholl et al. (2017) Nicholl, M., Guillochon, J., & Berger, E. 2017, ApJ, 850, 55
- Nicholl et al. (2013) Nicholl, M., Smartt, S. J., Jerkstrand, A., et al. 2013, Nature, 502, 346
- Nicholl et al. (2016a) Nicholl, M., Berger, E., Smartt, S. J., et al. 2016a, ApJ, 826, 39
- Nicholl et al. (2016b) Nicholl, M., Berger, E., Margutti, R., et al. 2016b, ApJ, 828, L18
- Peng et al. (2002) Peng, C. Y., Ho, L. C., Impey, C. D., & Rix, H.-W. 2002, AJ, 124, 266
- Quimby et al. (2011) Quimby, R. M., Kulkarni, S., Kasliwal, M. M., et al. 2011, Nature, 474, 487
- Renault-Tinacci et al. (2018) Renault-Tinacci, N., Kotera, K., Neronov, A., & Ando, S. 2018, A&A, 611, A45
- Seitenzahl et al. (2014) Seitenzahl, I. R., Timmes, F., & Magkotsios, G. 2014, ApJ, 792, 10
- Shappee et al. (2017) Shappee, B., Stanek, K., Kochanek, C., & Garnavich, P. 2017, ApJ, 841, 48
- Soderberg et al. (2006) Soderberg, A. M., Chevalier, R. A., Kulkarni, S. R., & Frail, D. A. 2006, ApJ, 651, 1005
- Taddia et al. (2018) Taddia, F., Sollerman, J., Fremling, C., et al. 2018, arXiv:1806.10000
- Wang et al. (2015) Wang, S., Wang, L., Dai, Z., & Wu, X. 2015, ApJ, 799, 107
- Yan et al. (2017) Yan, L., Lunnan, R., Perley, D., et al. 2017, ApJ, 848, 6
- Zdziarski & Svensson (1989) Zdziarski, A. A., & Svensson, R. 1989, ApJ, 344, 551