The turbulent pressure support in galaxy clusters revisited
Abstract
Due to their late formation in cosmic history, clusters of galaxies are not fully in hydrostatic equilibrium and the gravitational pull of their mass at a given radius is expected not to be entirely balanced by the thermal gas pressure. Turbulence may supply additional pressure, and recent (X-ray and SZ) hydrostatic mass reconstructions claim a pressure support of of the total pressure at . In this work we show that, after carefully disentangling bulk from small-scale turbulent motions in high-resolution simulations of galaxy clusters, we can constrain which fraction of the gas kinetic energy effectively provides pressure support in the cluster’s gravitational potential. While the ubiquitous presence of radial inflows in the cluster can lead to significant bias in the estimate of the non-thermal pressure support, we report that only a part of this energy effectively acts as a source of pressure, providing a support of the order of of the total pressure at .
keywords:
galaxy: clusters, general – methods: numerical – intergalactic medium – large-scale structure of Universe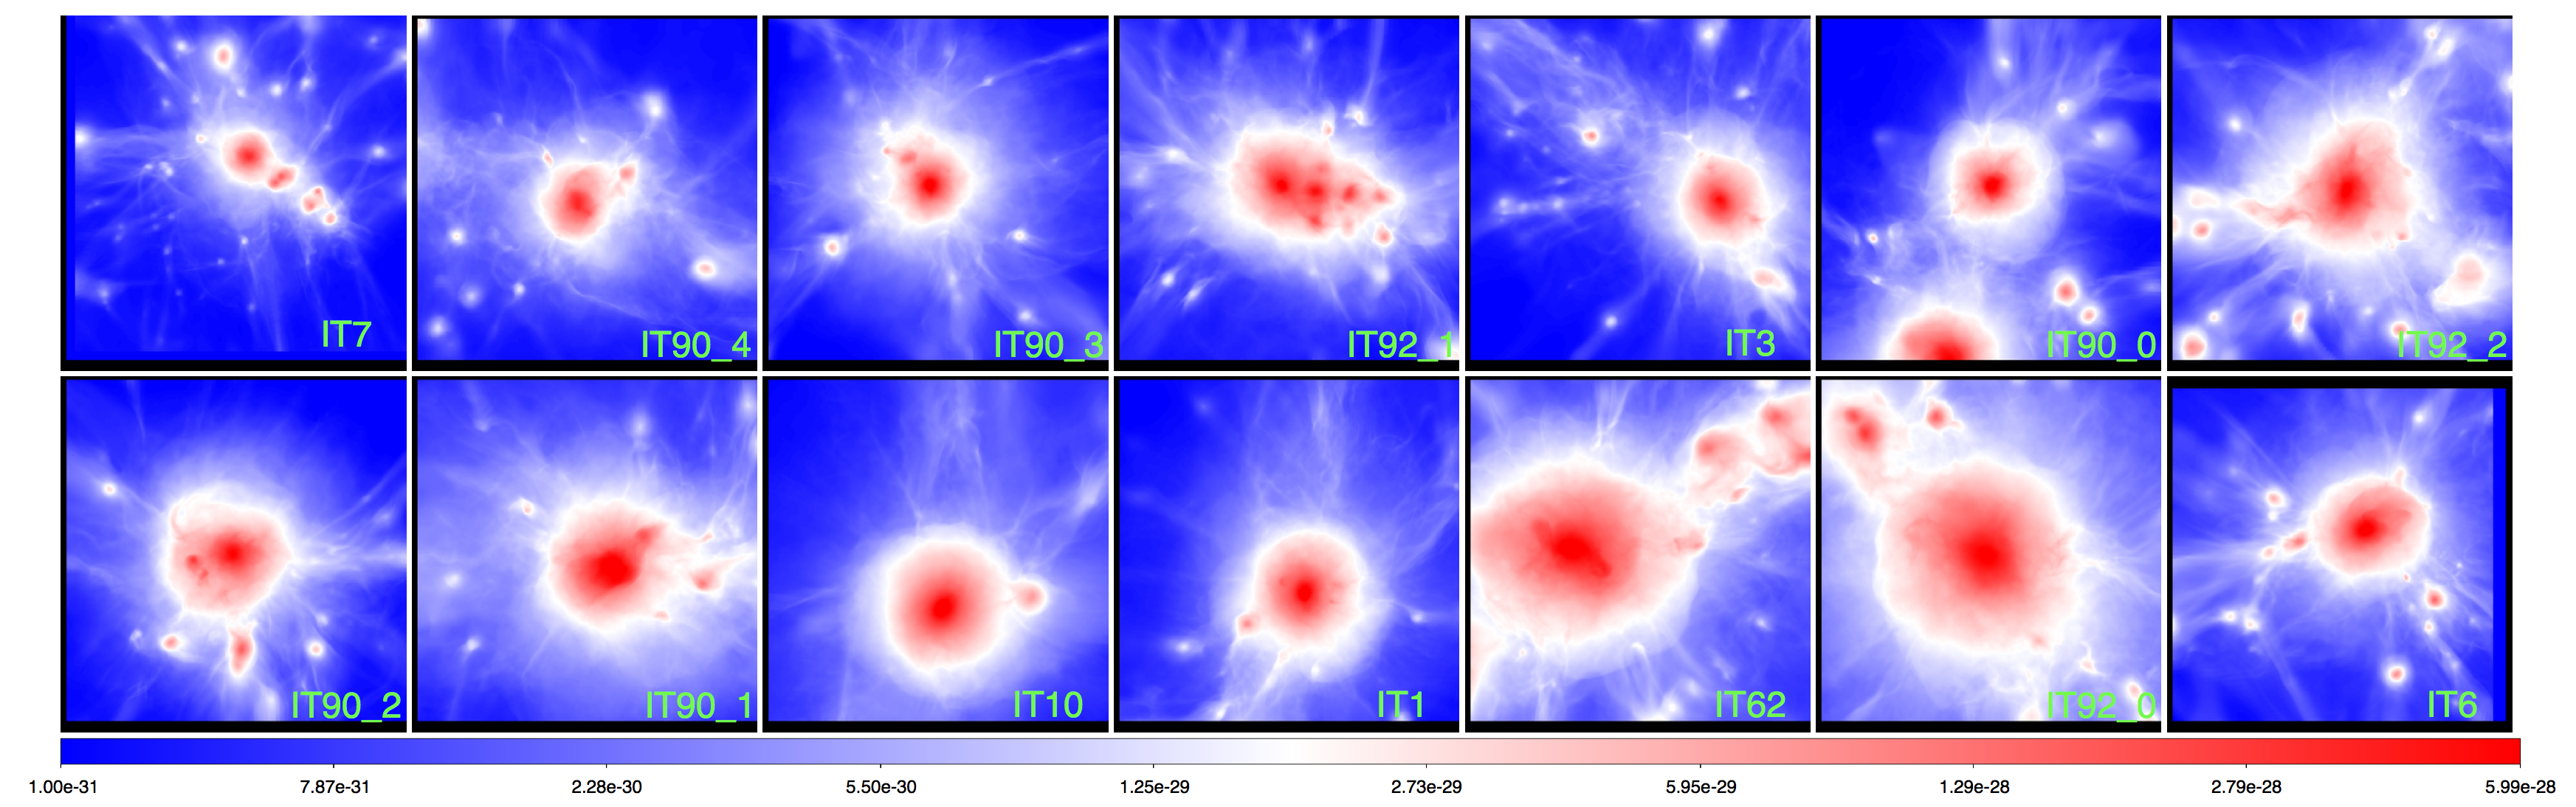
1 Introduction
The origin and evolution of turbulence induced by the formation of large-scale structure has been studied with hydrodynamical simulations for more than a decade (e.g. Dolag et al., 2005; Lau et al., 2009; Vazza et al., 2011; Miniati, 2014; Gaspari et al., 2014). Turbulence arises from the continuous stirring associated with the growth of clusters, for example, via the injection and amplification of vorticity by shock waves (e.g. Ryu et al., 2008; Porter et al., 2015; Vazza et al., 2017) and ram pressure stripping (e.g. Subramanian et al., 2006; Cassano & Brunetti, 2005; Roediger & Brüggen, 2007). Moreover, winds from star-burst galaxies, outflows from active galactic nuclei stir the intracluster medium (ICM), especially in cluster cores (e.g., Brüggen et al., 2005; Gaspari et al., 2011).
However, direct measurements of turbulent gas motions in the ICM are rare. The Hitomi satellite managed to detect root-mean square velocities in the (fairly relaxed) Perseus cluster of on (e.g. Hitomi Collaboration et al., 2016; ZuHone et al., 2018). Highly resolved X-ray surface brightness fluctuations in clusters were interpreted as indications of moderate density fluctuations induced by the turbulent shaking of the ICM (e.g. Schuecker et al., 2004; Churazov et al., 2012; Gaspari et al., 2014; Zhuravleva et al., 2014). Moreover, hints of a correlation between X-ray surface brightness fluctuations and diffuse radio emission have recently been found (Eckert et al., 2017b; Bonafede et al., 2018). This can be taken as evidence that the turbulence to which the X-ray surface brightness fluctuations bear testament powers the diffuse radio emission via turbulent re-acceleration (e.g. Brunetti & Lazarian, 2011). Finally, the mass modeling of several galaxy clusters based on X-ray profiles suggested the presence of non-negligible non-thermal pressure support potentially associated with ICM turbulence (Morandi et al., 2011; Parrish et al., 2012; Fusco-Femiano & Lapi, 2018; Ota et al., 2018). Assessing the budget of turbulence in the ICM is key to correctly measure the mass of galaxy clusters. For clusters that have not been disturbed by a recent merger, the ICM should be in hydrostatic balance, meaning that the gravitational pull of the gas is balanced by the total pressure gradient. The determination of density and temperature via X-ray observations can be used to measure the cluster’s total gravitational mass. To address this issue, cosmological simulations have been used to constrain the level of turbulent pressure support that contributes to systematic errors in the hydrostatic mass estimates (e.g., Kay et al., 2004; Faltenbacher et al., 2005; Rasia et al., 2006; Hallman et al., 2006; Nagai et al., 2007), which in turn may complicate the determination of cosmological parameters from galaxy clusters (e.g. and ).
Recently, Eckert et al. (2018) have systematically analysed the hydrostatic mass bias in a sample of 14 galaxy clusters observed with the large XMM program X-COP (Eckert et al., 2017a), providing evidence of an overall small level of non-thermal pressure support at and of order of the total pressure. This non-thermal pressure contribution was found to be a factor below the expectations from most simulations (e.g. Lau et al., 2009; Vazza et al., 2011; Nelson et al., 2014; Biffi et al., 2016).
In this paper we will revisit the measurement of non-thermal pressure produced by gas motions in the ICM. Using recent high-resolution, Eulerian simulations of galaxy clusters, we show that the hydrostatic mass bias suggested by joint X-ray and SZ observations can be related to the fraction of the total gas kinetic energy that effectively act as a source of pressure support, after distinguishing cleanly between isotropic turbulent velocities and bulk motions.
The paper is structured as follows: in Sec. 2.1 we describe our cluster sample and our recipes to isolate turbulent motions in the simulated ICM; in Sec. 3 we give our results from the analysis of our sample and in Sec. 4 we discuss the limitations of our analysis and its implications for the interpretation of observations.
2 Methods
2.1 The Itasca Simulated Cluster sample
We used the ”Itasca Simulated Clusters” sample (ISC) for this project 111http://cosmosimfrazza.myfreesites.net/isc-project. , i.e. a set of 14 galaxy clusters in the mass range simulated at uniformly high spatial resolution with Adaptive Mesh Refinement and the Piecewise Parabolic method in the ENZO (Bryan et al., 2014). Our simulations are non-radiative and assume the WMAP7 CDM cosmology (Komatsu et al., 2011), with , , , Hubble parameter , and a primordial index of . For each cluster, we generated two levels of nested grids as initial conditions (each with cells and dark matter particles and covering and , respectively). At run time, we imposed two additional levels of static mesh refinement in the subvolume around each cluster, down to . More information on the ISC sample are found in Vazza et al. (2017) and Wittor et al. (2017).
2.2 Identifying turbulence in the ICM
Several filtering techniques to identify turbulence in the complex ICM velocity fields have been developed over the years (e.g. Dolag et al., 2005; Iapichino & Niemeyer, 2008; Vazza et al., 2012; Miniati, 2014). Here we rely on a combined set of methods, applied in post-processing, following Vazza et al. (2017). Our main steps are:
-
•
multi-scale filtering of turbulence: We applied the iterative, multi-scale velocity filter from Vazza et al. (2012), in which local mean (density weighted) velocity field for each cell, , is iteratively computed (separately for each velocity component) within a domain of radius, . The small-scale residual velocity fluctuations are computed as for an increasing domain radius, until the relative change in between iterations falls below a 1% tolerance. The iterations can also be stopped if a shock stronger than our fiducial (see next item) enters the domain, as in Vazza et al. (2017). The resulting gives our fiducial estimate for the turbulent velocity magnitude for eddies of size . Then the combination estimates the dissipation rate of kinetic energy per unit mass, according to Kolmogorov theory (scale invariant by construction). We remark that even if the stencil of cells used by our filter to constrain the local velocity field increases in an isotropic way, the algorithm can still detect anisotropic velocity structures, given its low tolerance (), i.e. the filter does not bias the reconstructed small-scale fields to be isotropic (see Sec. 3). On the other hand, if steep velocity gradients are present, a fraction of the associated energy may be mis-identified as turbulent, as it mimics a velocity structure increasing as a function of scale. However, based on the tests in Vazza et al. (2012) (Sec. 2.1), this small effect is expected not to be a relevant source of error, under realistic ICM conditions. We note that in the forthcoming analysis, all quoted rms turbulent velocities must be referred to their specific scale, , which is typically for the range of masses analysed here, even if a distribution of turbulent scales is present in every cluster (e.g. Vazza et al., 2012, 2017).
-
•
shock identification: Shocks are identified based on the 3D velocity jumps across cells . The shock centre is given by the minimum in the 3D velocity divergence and the shock’s Mach number is constructed by combining the three velocity jumps from the Rankine-Hugoniot conditions in one dimension (see Vazza et al., 2009, for more details). shocks are excised from our analysis (i.e. we avoid computing thermal and non-thermal pressure in such cells) in order to limit the contribution from velocity fluctuations related to shock-induced velocity fluctuations. We set , higher than in our previous work () because here we focus on cluster outskirts, where the fraction of transonic motions driven by accretion is larger than near the centre.
-
•
clump excision: Dense clumps associated with infalling structures can introduce a bias in the estimate of the local velocity field, as they correlate with large (and mostly laminar) bulk motions in the ICM. Observationally, clumps are generally masked when they are detectable in X-rays, and we follow a procedure for this similar to Zhuravleva et al. (2013) and Roncarelli et al. (2013), masking the densest cells (considering the gas density) at each radius from the cluster center. As for cells, we do not use these cells to compute the ratio of non-thermal to total gas pressure in our clusters, which is also in line with what has been done in the X-ray analysis by Eckert et al. (2018), which serves as a comparison in the next Section.
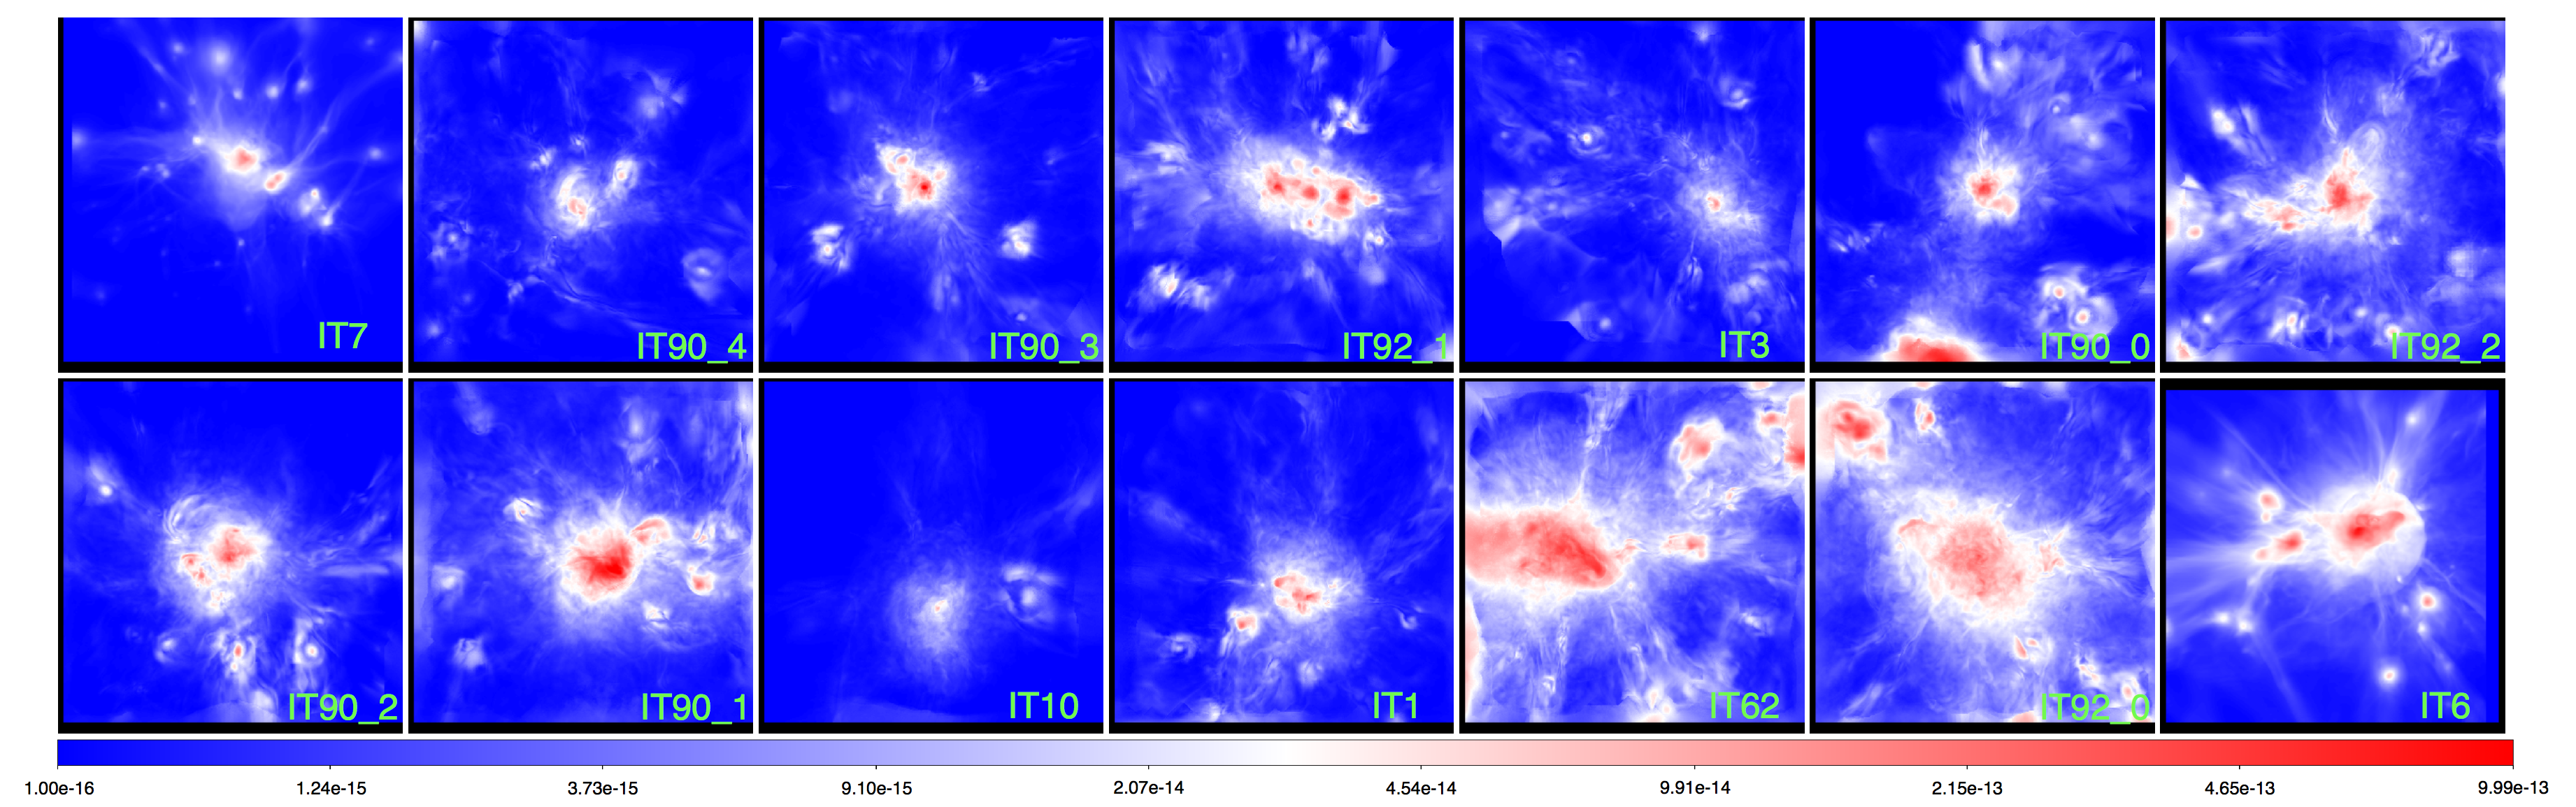
In order to obtain the turbulent gas velocity, the above procedure is performed for each cluster at . The projected turbulent pressure for all clusters in the ISC sample is shown in the lower panels of Fig. 1. The ratio between the turbulent pressure and the total pressure within each cell is thus:
| (1) |
where the gas density, the mean molecular mass per electron and is the gas temperature. is a numerical coefficient that can be either if we only restrict to the radial velocity component at each radius, or if we simply assume an isotropic velocity dispersion at each radius. The resulting profile of non-thermal pressure ratio is thus:
| (2) |
in which the summation refers to all cells within each radial shell after the excision of shocks and clumps.
In the following, we will refer to the small-scale filtered, clump excised and shock masked velocity field as to the ”turbulent” velocity , and to the clump-excised only velocity field as to the ”unfiltered” velocity.
3 Results
Previous ICM simulations have proven that the turbulent pressure support from gas motions is increasingly anisotropic (and dominated by radial motions) away from the cluster centers Lau et al. (2009). It has also been shown that that the pressure support from large-scale rotational motions is generally small in clusters (Fang et al., 2009; Suto et al., 2013; Lau et al., 2013; Nelson et al., 2014). This stems from the fact that the pressure scale height is in general smaller than the cluster core radius ( for the masses explored here), meaning that outside of cluster cores regular gas motions along the radius are dissipated into smaller-scale turbulent motions, as directly measured in the simulated ICM.
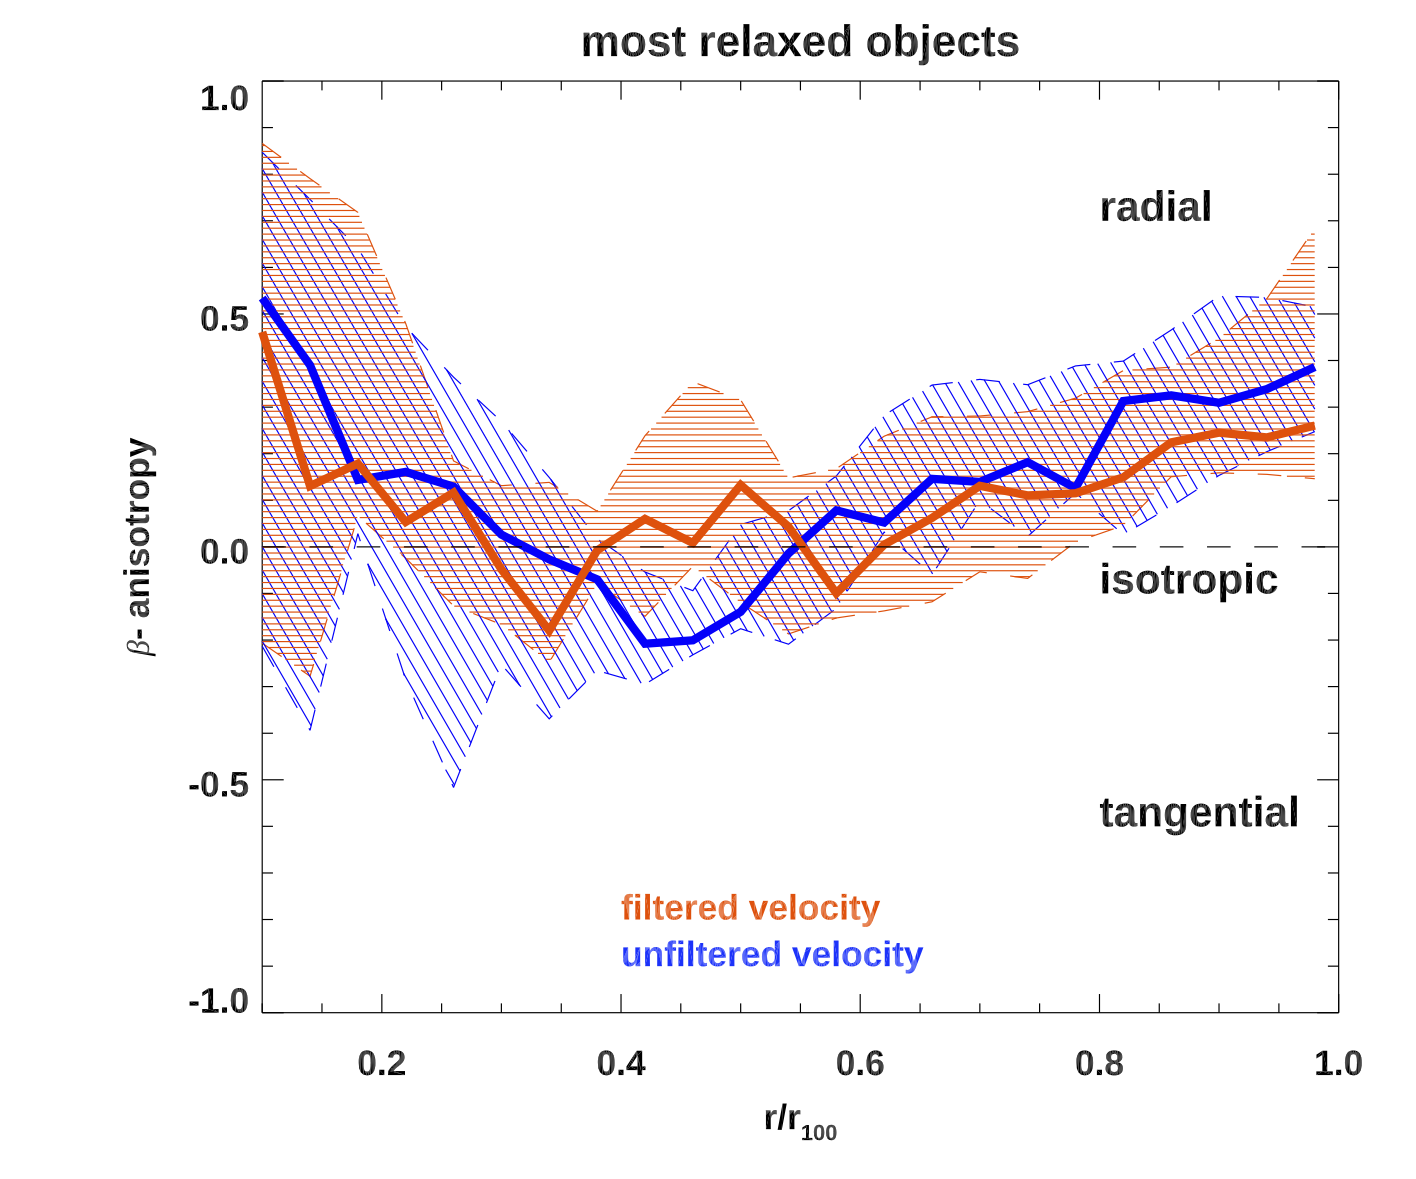
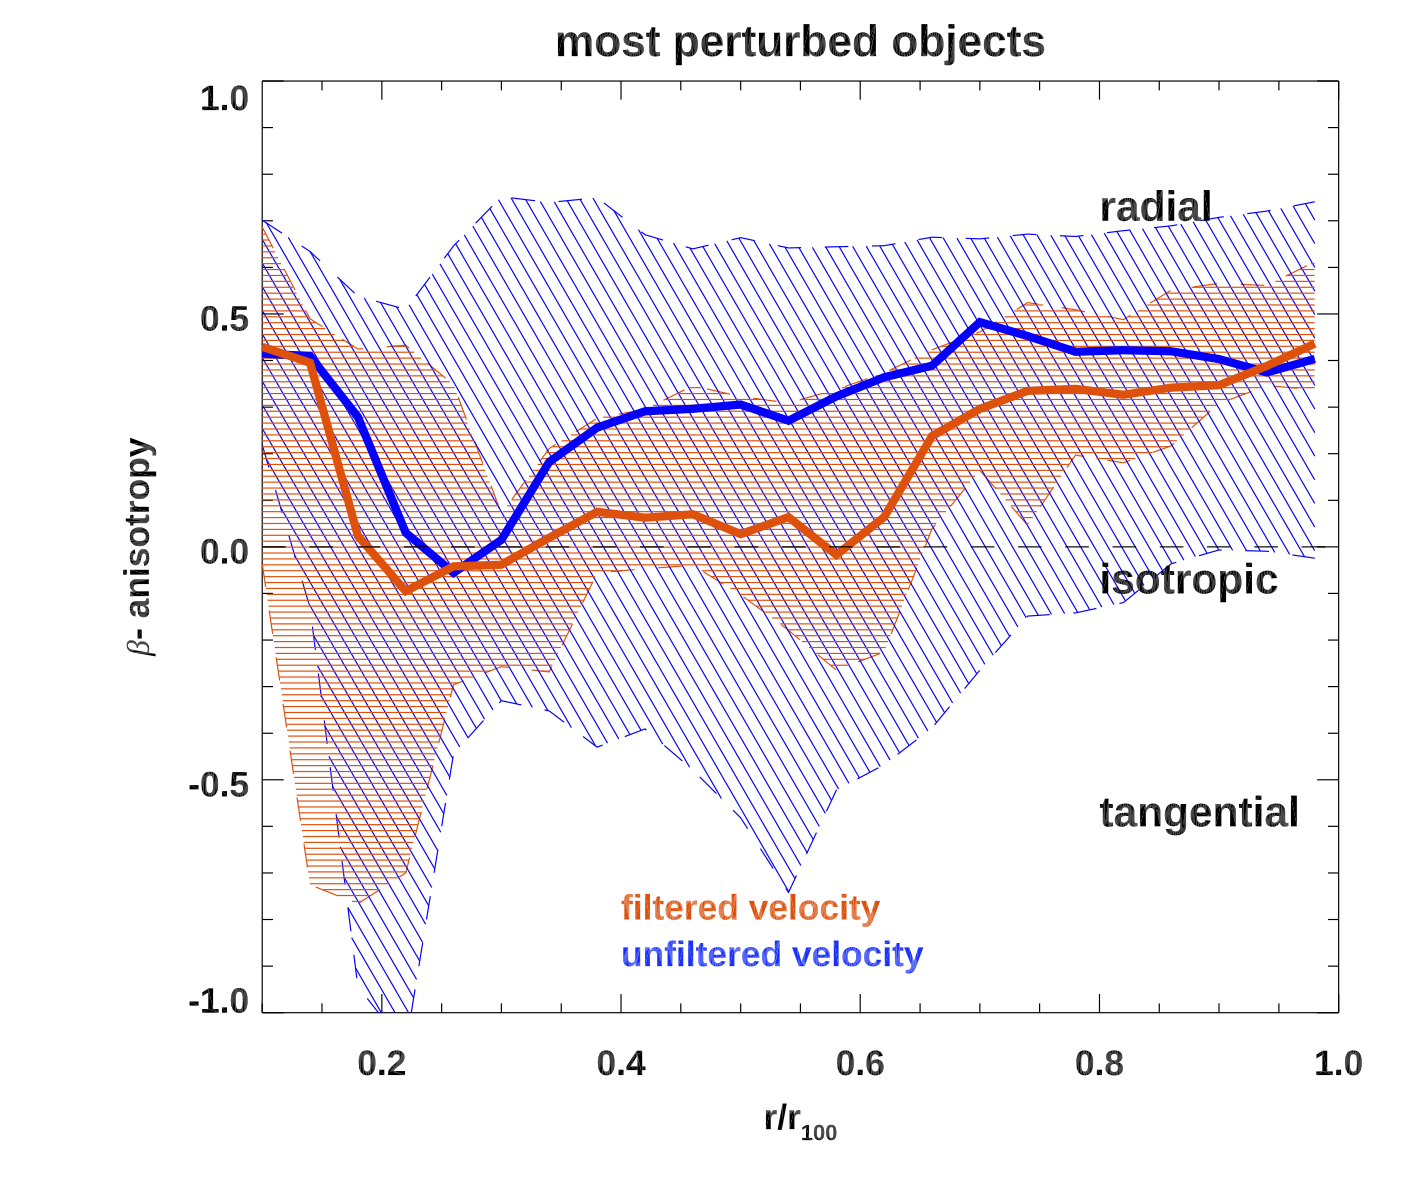
The level of anisotropy of gas motions is usually characterized through the anisotropic parameter ( and are the gas velocity dispersion in the radial and tangential direction to the cluster centre, respectively), hence in general a velocity dispersion in the radial direction is representative of the true local turbulent pressure only if .
Fig. 2 shows the (density-weighted) profiles of for the five most perturbed and the five most relaxed clusters in our sample, with ranking based on their morphological parameter (averaged over the three lines of sight). This parameter quantifies the shift of the X-ray centroid as a function of cluster radius (e.g. Mohr et al., 1993), which is here measured on bolometric X-ray maps for simplicity. In this analysis, we rely on the parameter instead of other morphological parameter such as the concentration parameter, , or the power ratio, , as we know that is the parameter that best correlates with the non-thermal pressure at large cluster radii (Angelinelli et al, in preparation). Fig. 2 shows that our filtering approach reduces the scatter in significantly, in particular for perturbed clusters. The filtering of velocity also reduces the anisotropy in the range compared to the unfiltered velocity field, even if an excess of radial bias even at small scale remain in the outermost accretion regions.
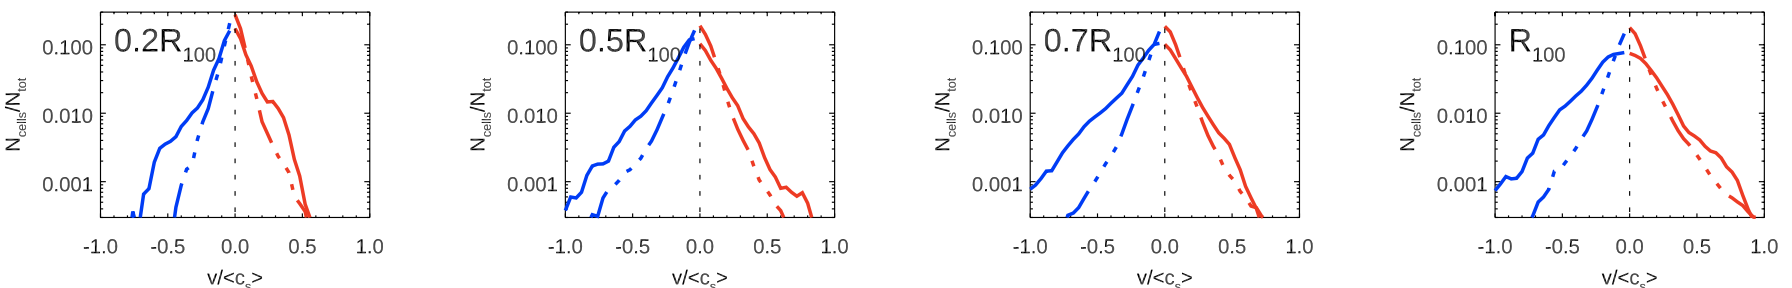
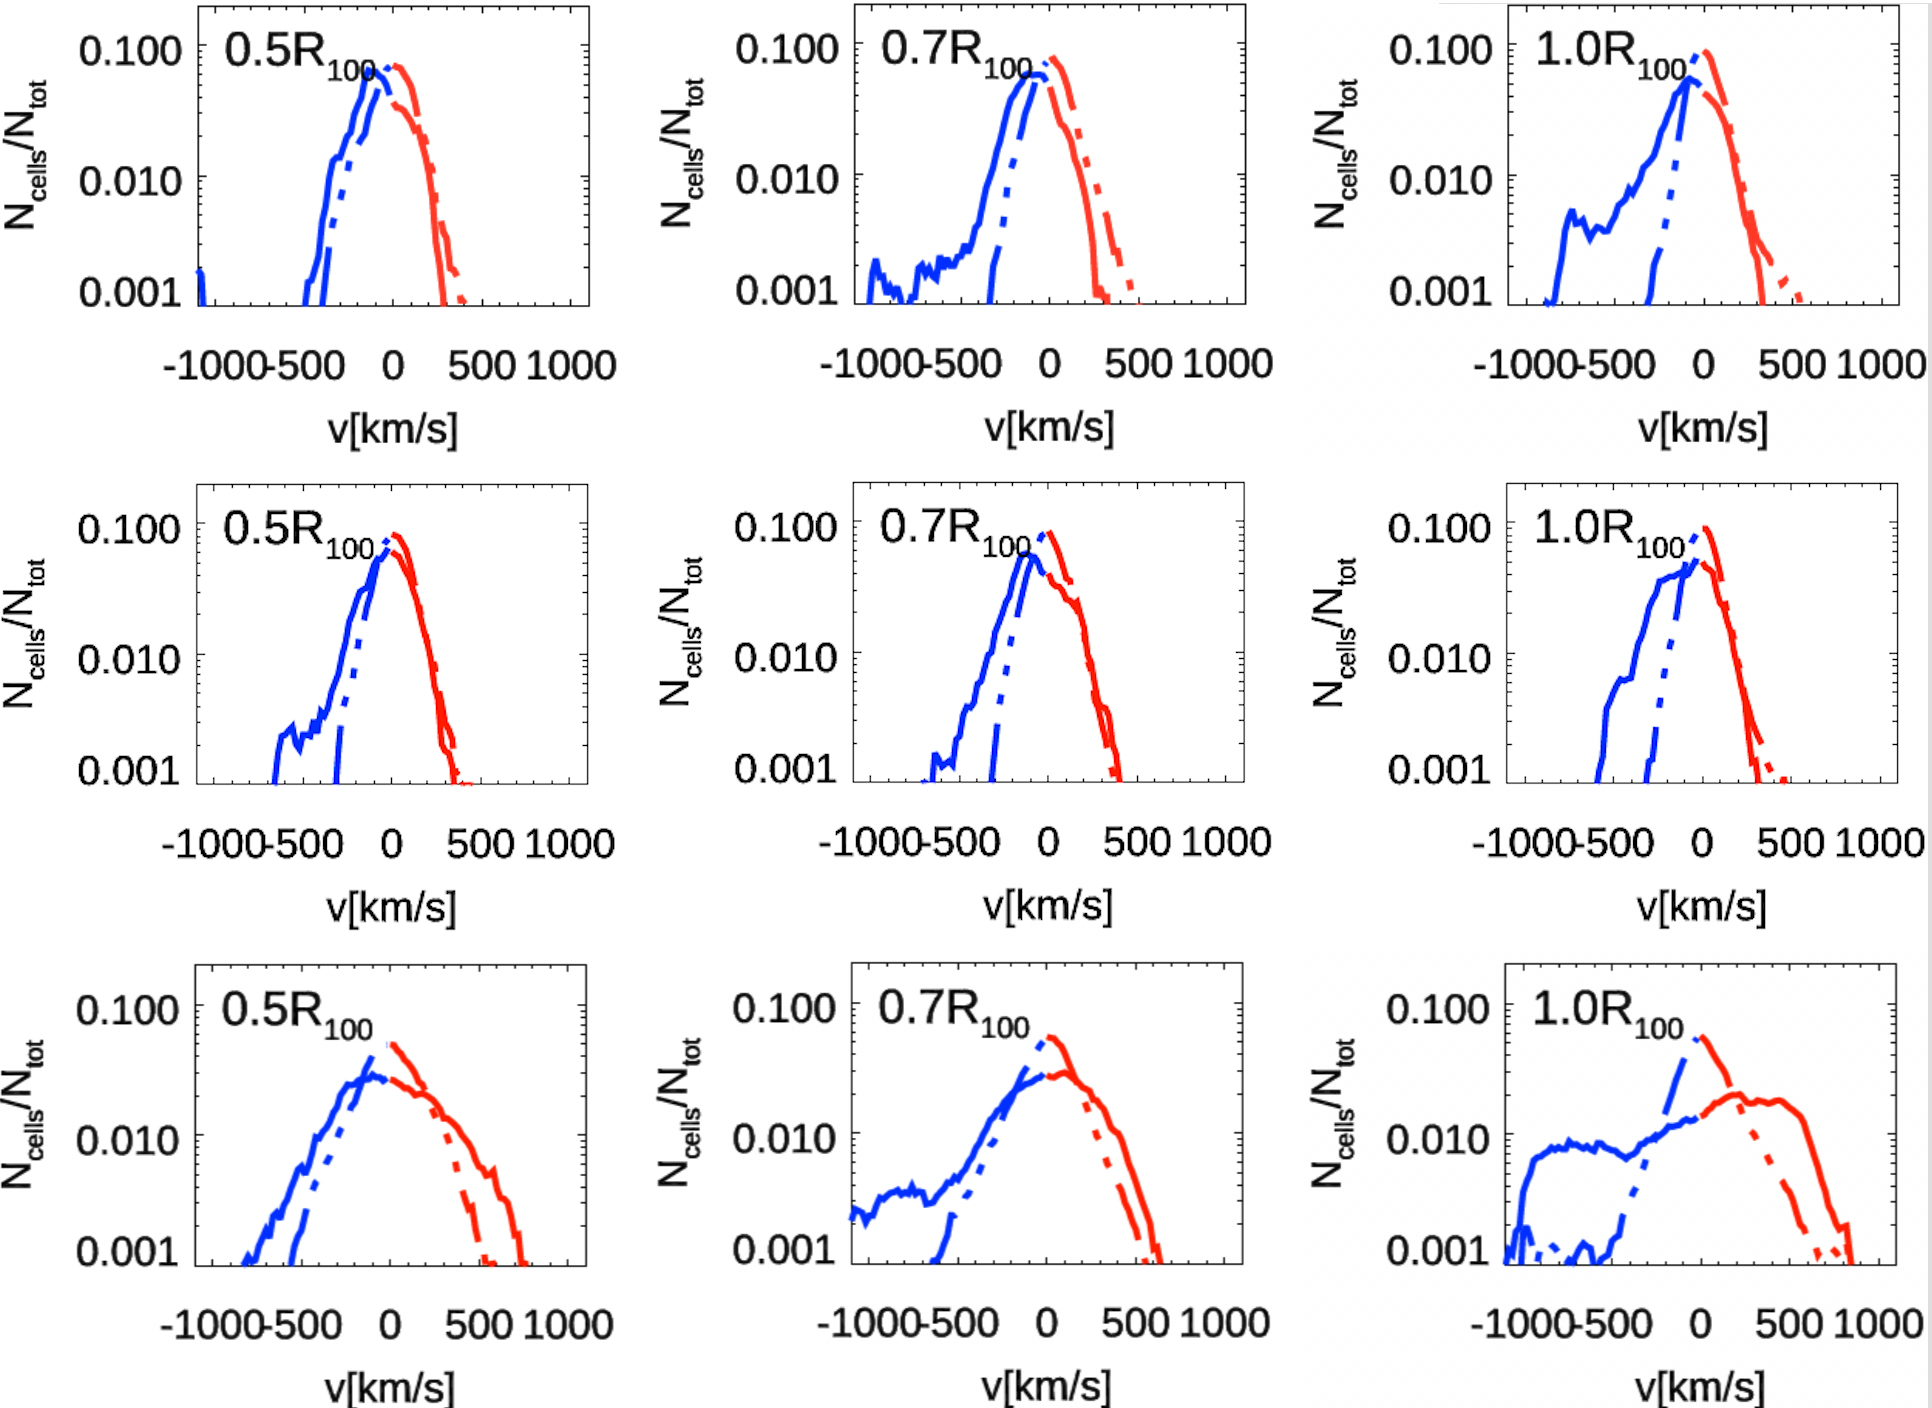
At certain fixed radii (, , and times the of each cluster) we measured the distribution of total (i.e. unfiltered) and filtered radial (centred on the cluster) velocities. The excision of the densest cells within each radial shell is performed on both total and turbulent velocities to remove the effect of single dense clumps. Fig. 3 shows the distribution of the radial velocity components averaged across all clusters, where we normalized the velocity to the average sound speed within each radial shell, measured within , in order to take account for the different masses across the sample. The unfiltered radial velocity field systematically displays a large degree of asymmetry towards the ”blue-shifted” part of the distribution (), meaning that in most clusters there is a preference for radial motions pointing towards the cluster center, which is also confirmed by the fact that we measure is at most radii in our clusters (not shown). The effective kinetic pressure component that is caused by laminar inflows clearly reduces the pressure support over what is needed for hydrostatic equilibrium. This kinetic pressure acts in the direction of the gravitational force of the host cluster, and it effectively pushes gas inwards, opposite to an isotropic pressure component. However, the small-scale filtered velocity displays a more marked symmetry at each radius, indicating that the velocity fields extracted in such a way are indeed fairly symmetric in the radial direction and thus act as a true non-thermal pressure component, at least on the scales reconstructed by our analysis.
At the radii that are presently best probed by X-ray observations, e.g. and (e.g. Eckert et al., 2018), the ”blue-shifted”, inward component of the velocity field shows an excess of the order of a factor compared to the symmetric small-scale filtered component. Even larger discrepancies between the filtered and non-filtered distribution of velocities are found in specific objects, with an increased departure from a Gaussian distribution of radial velocity components in perturbed objects. If we incorrectly assume instead that rms of the unfiltered velocity at each radius stems from a symmetric Gaussian distribution, then the associated would be overestimated. This could explain the systematic overestimate of the non-thermal pressure support reported by most cosmological simulations to date.
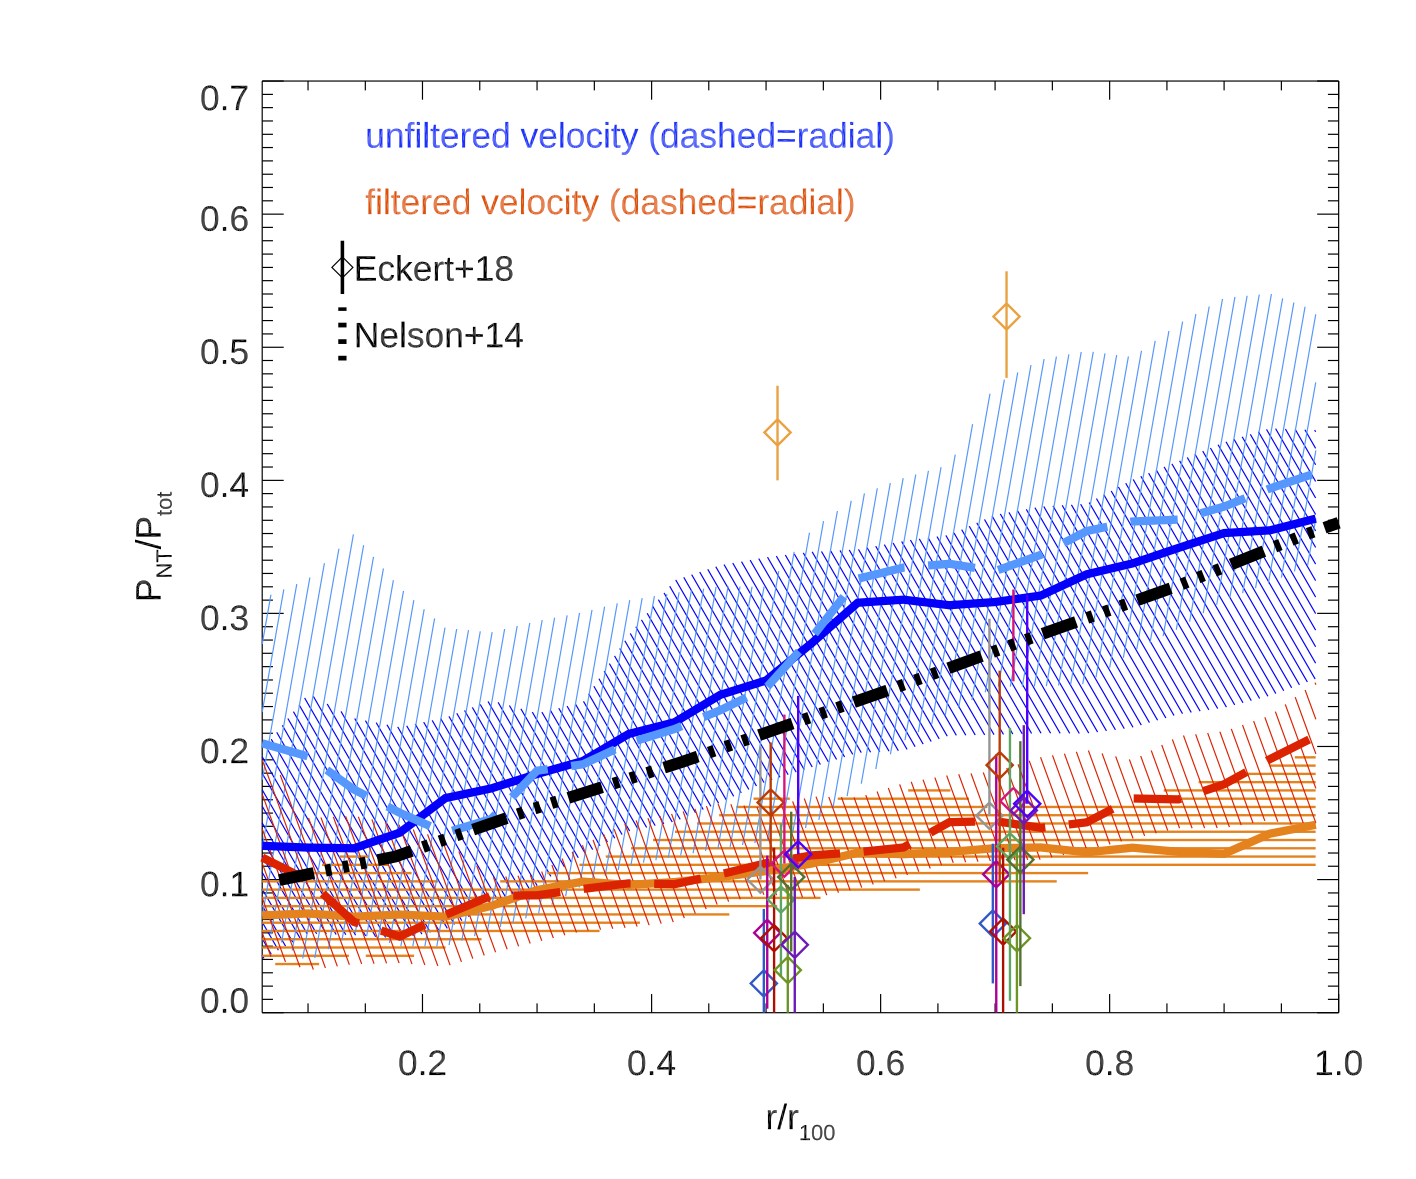
This conclusion is confirmed by Fig. 5, which shows the central result of this work: there we present the average profile of the ratio for the entire sample and for the filtered or unfiltered velocities. We plot, both, the radial pressure support from the rms velocity values at each radii, assuming isotropy ( in Eq.1) as well as only considering the radial velocity component (). These results are contrasted with the recent observational estimates by Eckert et al. (2018) at and (symbols). For comparison with previous numerical work, we also show the best-fit profile for the non-thermal pressure from turbulent motions suggested by Nelson et al. (2014). The profile of for turbulent velocities is much flatter compared to the unfiltered case, and falls within the the level hinted by observations. With the exception of one observed system that clearly stands out of the rest of the distribution (A2319, Ghirardini et al. 2018) and within the fairly limited statistics of the two sample (neither of which is a mass complete one), the observed and simulated estimates of non-thermal pressure support are in the same range. A steeper trend with radius, as well as a times higher non-thermal pressure support would be instead inferred using the more standard unfiltered velocity field. While this work indeed confirms that this is the typical level of gas kinetic energy at this radius in average clusters, only of this energy is associated to isotropic and volume filling motions and acts as a source of pressure, and would thus be deduced from hydrostatic mass reconstructions.
4 Discussion and Conclusions
We investigated the distribution of kinetic (turbulent) pressure in the ICM, using a sample of recent high resolution simulations of (non-radiative) galaxy clusters (Vazza et al., 2017; Wittor et al., 2017). In particular, motivated by recent measurements on the hydrostatic mass bias of XMM-Newton analysis (Eckert et al., 2018), we quantified the kinetic pressure support by residual gas motions in the ICM. When properly analysed, the turbulent kinetic energy of the ICM is a small fraction () of the total kinetic gas energy at large radii, unlike what is usually estimated with more standard analysis. The effective pressure support from turbulence, after removing bulk motions, is on average of the total gas pressure. Although the presence of bulk motions that we detect and subtract in simulations may affect the estimate from X-ray observations in real clusters, we note that this is of the same order of what recently suggested by joint X-ray and SZ observations (Eckert et al., 2018). If this scenario is confirmed, no additional mechanism to the standard modelling of the ICM on (e.g. increased viscosity or enhanced turbulent dissipation) appears necessary in order to reconcile with the most recent hydrostatic mass reconstructions.
acknowledgements
We wish to dedicate this work to the memory of Giuseppe (Bepi) Tormen, who tragically passed away on June 2018, and first introduced F.V. to cosmological simulations and the beautiful mess they contain. We used the ENZO code (http://enzo-project.org), the product of a collaborative effort of scientists at many universities and national laboratories. We thank our reviewer, E. Churazov, for useful comments which improved the quality of our work, and A. Bonafede for performing the calculation of X-ray morphological parameters. F.V. acknowledges financial support from the Horizon 2020 program under the ERC Starting Grant ”MAGCOW”, no. 714196. T.W.J. acknowledges support from the US National Science Foundation. The simulations were carried out at the Minnesota Supercomputing Institute at the University of Minnesota.
References
- Biffi et al. (2016) Biffi V. et al., 2016, ApJ, 827, 112
- Bonafede et al. (2018) Bonafede A. et al., 2018, MNRAS, 478, 2927
- Brüggen et al. (2005) Brüggen M., Hoeft M., Ruszkowski M., 2005, ApJ, 628, 153
- Brunetti & Lazarian (2011) Brunetti G., Lazarian A., 2011, MNRAS, 410, 127
- Bryan et al. (2014) Bryan G. L. et al., 2014, ApJS, 211, 19
- Cassano & Brunetti (2005) Cassano R., Brunetti G., 2005, MNRAS, 357, 1313
- Churazov et al. (2012) Churazov E. et al., 2012, MNRAS, 421, 1123
- Dolag et al. (2005) Dolag K., Vazza F., Brunetti G., Tormen G., 2005, MNRAS, 364, 753
- Eckert et al. (2017a) Eckert D., Ettori S., Pointecouteau E., Molendi S., Paltani S., Tchernin C., 2017a, Astronomische Nachrichten, 338, 293
- Eckert et al. (2017b) Eckert D., Gaspari M., Vazza F., Gastaldello F., Tramacere A., Zimmer S., Ettori S., Paltani S., 2017b, ApJL, 843, L29
- Eckert et al. (2018) Eckert D. et al., 2018, ArXiv e-prints
- Faltenbacher et al. (2005) Faltenbacher A., Allgood B., Gottlöber S., Yepes G., Hoffman Y., 2005, MNRAS, 362, 1099
- Fang et al. (2009) Fang T., Humphrey P., Buote D., 2009, ApJ, 691, 1648
- Fusco-Femiano & Lapi (2018) Fusco-Femiano R., Lapi A., 2018, MNRAS, 475, 1340
- Gaspari et al. (2014) Gaspari M., Churazov E., Nagai D., Lau E. T., Zhuravleva I., 2014, A & A, 569, A67
- Gaspari et al. (2011) Gaspari M., Melioli C., Brighenti F., D’Ercole A., 2011, MNRAS, 411, 349
- Ghirardini et al. (2018) Ghirardini V., Ettori S., Eckert D., Molendi S., Gastaldello F., Pointecouteau E., Hurier G., Bourdin H., 2018, A & A, 614, A7
- Hallman et al. (2006) Hallman E. J., Motl P. M., Burns J. O., Norman M. L., 2006, ApJ, 648, 852
- Hitomi Collaboration et al. (2016) Hitomi Collaboration et al., 2016, Nature, 535, 117
- Iapichino & Niemeyer (2008) Iapichino L., Niemeyer J. C., 2008, MNRAS, 388, 1089
- Kay et al. (2004) Kay S. T., Thomas P. A., Jenkins A., Pearce F. R., 2004, MNRAS, 355, 1091
- Komatsu et al. (2011) Komatsu E. et al., 2011, ApJS, 192, 18
- Lau et al. (2009) Lau E. T., Kravtsov A. V., Nagai D., 2009, ApJ, 705, 1129
- Lau et al. (2013) Lau E. T., Nagai D., Nelson K., 2013, ApJ, 777, 151
- Miniati (2014) Miniati F., 2014, ApJ, 782, 21
- Mohr et al. (1993) Mohr J. J., Fabricant D. G., Geller M. J., 1993, ApJ, 413, 492
- Morandi et al. (2011) Morandi A., Limousin M., Rephaeli Y., Umetsu K., Barkana R., Broadhurst T., Dahle H., 2011, MNRAS, 416, 2567
- Nagai et al. (2007) Nagai D., Kravtsov A. V., Vikhlinin A., 2007, ApJ, 668, 1
- Nelson et al. (2014) Nelson K., Lau E. T., Nagai D., 2014, ApJ, 792, 25
- Ota et al. (2018) Ota N., Nagai D., Lau E. T., 2018, Publications of the Astronomical Society of Japan, 70, 51
- Parrish et al. (2012) Parrish I. J., McCourt M., Quataert E., Sharma P., 2012, MNRAS, 419, L29
- Porter et al. (2015) Porter D. H., Jones T. W., Ryu D., 2015, ApJ, 810, 93
- Rasia et al. (2006) Rasia E. et al., 2006, MNRAS, 369, 2013
- Roediger & Brüggen (2007) Roediger E., Brüggen M., 2007, MNRAS, 380, 1399
- Roncarelli et al. (2013) Roncarelli M., Ettori S., Borgani S., Dolag K., Fabjan D., Moscardini L., 2013, MNRAS, 432, 3030
- Ryu et al. (2008) Ryu D., Kang H., Cho J., Das S., 2008, Science, 320, 909
- Schuecker et al. (2004) Schuecker P., Finoguenov A., Miniati F., Böhringer H., Briel U. G., 2004, A & A, 426, 387
- Subramanian et al. (2006) Subramanian K., Shukurov A., Haugen N. E. L., 2006, MNRAS, 366, 1437
- Suto et al. (2013) Suto D., Kawahara H., Kitayama T., Sasaki S., Suto Y., Cen R., 2013, ApJ, 767, 79
- Vazza et al. (2009) Vazza F., Brunetti G., Gheller C., 2009, MNRAS, 395, 1333
- Vazza et al. (2011) Vazza F., Brunetti G., Gheller C., Brunino R., Brüggen M., 2011, A & A, 529, A17+
- Vazza et al. (2017) Vazza F., Jones T. W., Brüggen M., Brunetti G., Gheller C., Porter D., Ryu D., 2017, MNRAS, 464, 210
- Vazza et al. (2012) Vazza F., Roediger E., Brueggen M., 2012, ArXiv e-prints 1202.5882
- Wittor et al. (2017) Wittor D., Vazza F., Brüggen M., 2017, MNRAS, 464, 4448
- Zhuravleva et al. (2013) Zhuravleva I., Churazov E., Kravtsov A., Lau E. T., Nagai D., Sunyaev R., 2013, MNRAS, 428, 3274
- Zhuravleva et al. (2014) Zhuravleva I. et al., 2014, Nature, 515, 85
- ZuHone et al. (2018) ZuHone J. A., Miller E. D., Bulbul E., Zhuravleva I., 2018, ApJ, 853, 180