Models of Optical Emission Lines To Investigate Narrow-Line Seyfert 1 Galaxies in Spectroscopic Databases
Abstract:
Thanks to the execution of extensive spectroscopic surveys that have covered large fractions of the sky down to magnitudes as faint as , it has been possible to identify several narrow-line Seyfert 1 galaxies (NLS1s) and to investigate their properties over a large range of the electromagnetic spectrum. The interpretation of their nature, however, is still hampered by the statistical uncertainties related to the way in which NLS1 candidates are selected. In this contribution, we present a study to detect and to model emission lines in optical spectra extracted from the Sloan Digital Sky Survey (SDSS), adopting the most proper strategy to identify the source of line excitation and to produce a detailed model with measurements of several emission line parameters. We demonstrate the application of this technique to explore fundamental questions, such as the presence of gas and dust around the core of AGNs and the spectral energy distribution of their ionizing radiation. We compare the spectral properties of NLS1s with those of other type 1 active galaxies and we summarize the potential of this approach to identify NLS1s in present day and future spectroscopic surveys. We finally consider the implications of multi-frequency data analysis in the debate concerning the intrinsic nature of NLS1s.
1 Introduction
The unusually small velocity fields, corresponding to less than in full width at half maximum (FWHM), that characterize the optical spectra of narrow-line Seyfert 1 galaxies (NLS1s, [1]), pose one of the most intriguing challenges to our understanding of active galactic nuclei (AGNs). A simple obscuring structure in front of the central regions of the source, which well explains most of the observational properties of broad-line type 1 AGNs and narrow-line type 2s [2], does not apply to the case of NLS1s. Many of these AGNs show prominent Fe II multiplets [3, 4] and non-stellar continuum in the optical spectra, together with strong soft X-ray emission characterized by rapid variability (down to less than hr, [5]). These clues suggest that the central source is not obscured. The low velocity fields of NLS1s are, therefore, interpreted in two ways: they may be either attributed to the gravitational attraction of a relatively low mass () central super massive black hole (SMBH, [6, 7]), or they could be the result of extreme projection effects from a flattened rotating structure, seen nearly face-on [8].
Combining spectroscopic observations with the host galaxy properties, where it is well established, at least in the low redshift regime, that NLS1s reside in spiral hosts that should correspond to typically low mass black holes [9], several lines of evidence support the low-mass interpretation over the geometrical one. Although it is demonstrated that geometrical effects play some role in the determination of the optical broad line profiles, NLS1s do not appear to be exceptional compared to other type 1 sources in this point of view [10]. In addition, radio morphology studies suggest that we observe NLS1s at various orientations [11]. On the contrary, the presence of a low mass SMBH in their nuclei implies that NLS1s work at quite high accretion regimes, close to and sometimes beyond the Eddington limit, in order to account for their observed luminosity. This particular property would identify NLS1s with quickly evolving sources, which might be in the first stages of their SMBH growth history. As a consequence, they may provide fundamental hints about the influence of AGN activity in a cosmological context.
With this contribution, we present the results obtained from a set of models designed to reproduce the properties of optical emission lines in large spectroscopic databases, like the Sloan Digital Sky Survey (SDSS, [12]) or the 6dF Galaxy Redshift Survey (6dFGS, [13, 14]). We use a systematic sequence of models in order to extract emission-line parameters from spectra and to distinguish among the various classes of astrophysical sources with optical emission lines. We subsequently focus our analysis on the properties of type 1 AGNs and we use the resulting data sample to compare NLS1s with the broad-line emitting sources.
2 Data selection and analysis
In recent times, several authors have investigated the possibility of identifying NLS1s by modelling the profiles of the emission lines detected in the optical spectra published by extensive spectroscopic surveys [15, 16, 17]. With the publication of the Fourteenth Data Release of SDSS (DR14, [18]) and plans to extend the sky coverage of spectroscopic observations in the Southern Hemisphere, it has become clear that the possibility of modelling spectra and extracting emission-line parameters will be of fundamental importance in order to take advantage of the wealth of observational material that is being released to the scientific community. As a consequence, we started a project to collect data from multiple frequency archives and to combine them with optical spectra, with the aim of selecting large object samples and investigating their statistical properties.


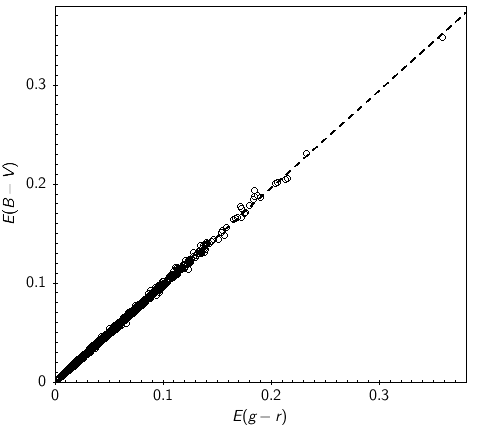
By querying the summary of emission-line measurements of the SDSS database111For this purpose, we used the spectroscopic pipeline data products of SDSS, stored in files named spZline-PPPP-MMMMM.fits for every exposed plate., we selected all the spectra with measurements of the optical emission lines H, [O III] and H detected with a signal-to-noise ratio better than 10 and not classified as STAR by the spectroscopic pipeline. We adopted this strategy, instead of directly selecting spectroscopically identified QSOs, because some type 1 objects with prominent narrow line components may happen to be classified as GALAXY and therefore get lost in samples selected on the basis of the QSO classification. We obtained the spectra of 66423 line-emitting galaxies, for which we performed a series of diagnostic operations. First, we applied a Cardelli-Clayton-Mathis extinction correction (CCM, [19]), based on the color excess returned by the SDSS photometric pipeline. We converted this into through the empirical relation:
| (1) |
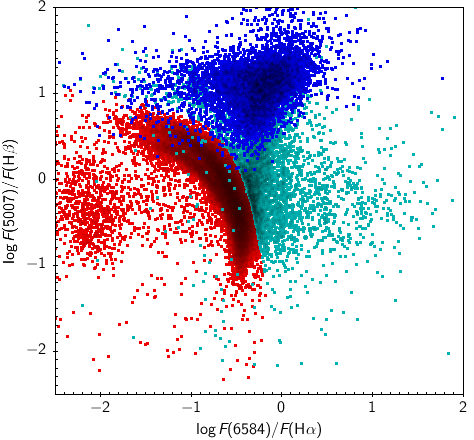
determined from 9158 QSOs, selected from a cross match of SDSS-DR14 with GALEX observations [20], and illustrated in Fig. 1 (left). Then we transformed all the collected spectra to the rest frame, using the redshift measurement provided by SDSS. After these preliminary steps, we ran a first simple iterative fit to the H region to infer whether the object has broad emission lines. If the total H profile is estimated to be broader than [O III], the object is treated as a type 1 AGN candidate. The Balmer lines are fitted with multiple Gaussians (1 narrow component, and 1 or 2 broad components, depending on the signal to noise ratio) and the forbidden lines of [O I], [O I], [N II] and [S II] are fitted with single Gaussians. The [O III] doublet represents a special case that we modelled with a narrow-core component and, in the high S/N spectra, an additional broad/shifted component, requiring, in this case, to fit both lines with the same profile. If no broad component is detected, the object is modelled as a type 2 AGN or a star-forming galaxy, and the emission lines are fitted with single Gaussians, but we still allow for the possible detection of a broad component in H (LINER, Seyfert 1.9). This procedure was designed to extract line flux and profile estimates, taking into account the complexity of the recombination lines in type 1 AGNs, which arises from the combination of several spectral contributions. It is able to extract emission line models for a total of 66097 objects. In order to test the consistency of the fitting procedure, we compared the distribution of the narrow line components in type 1 AGNs with the Baldwin-Phillips-Terlevich diagnostic diagram (BPT, [21, 22, 23]) of star forming galaxies and type 2 AGNs. The right panel of Fig. 1 shows that the samples behave consistently, suggesting that the narrow line contributions are reasonably well identified.

3 Discussion
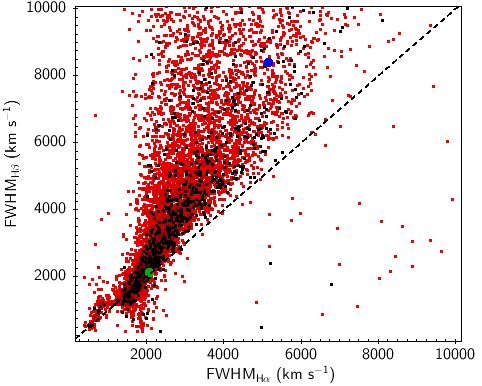
The main motivation of our study is to extract emission-line parameters from spectroscopic databases through automated procedures designed to model different types of spectra. Since one of the fundamental parameters used to distinguish NLS1s from other objects involves the width of the H broad-line component, we extracted the profiles of H and H from a sample of 13283 SDSS spectra, where both emission lines were succesfully modelled. By plotting the relationship between the FWHM of H and H, as shown in Fig. 2, we find that the two lines typically exhibit similar profiles in the low velocity regime, while H appears to become increasingly broader than H in objects with larger velocity widths. This trend is clearly observable even when reducing the sample to the spectra with a S/N ¿ 20 in the continuum at Å. Differences in the profiles of these two lines, as well as in their reverberation lags, have already been reported and it has been suggested that they might be connected with changes in the line emissivity across the broad line region (BLR, [24, 25]).

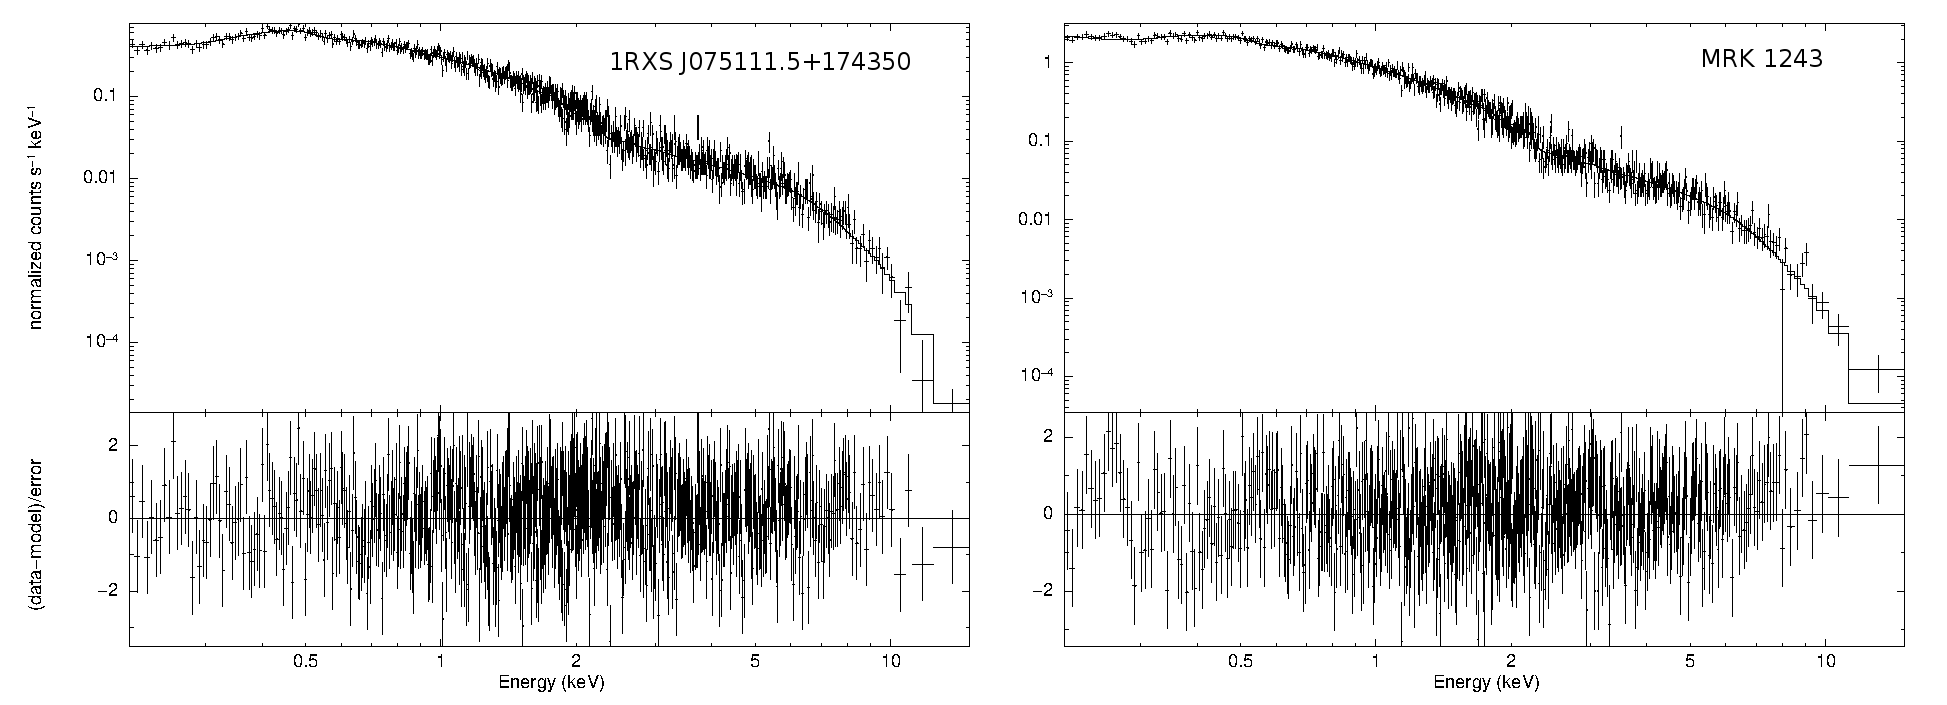
There is, however, also the possibility that a difference in the optical depth at the wavelength of the two lines may result in the observed effect. In particular, it is possible that a layer of ionized plasma, with recombining H atoms that cascade through the first excited level, may result in a different optical depth to the Balmer line photons, since the absorption coefficient for such atoms is . In order to look for possible clues of such structures, we investigated the X-ray emission of the sources with fitted emission lines, matching our sample with XMM sources with an estimated flux larger than in the 0.2 – 12 keV range and having high S/N SDSS spectra. In Fig. 3, we show two examples of X-ray spectra:1RXS J075111.5+174350, a broad-lined type 1 with remarkable line profile differences, and Mrk 1243, a narrow-lined Seyfert 1 with very similar line profiles. While in the first case, the X-ray spectrum shows the effect of absorption in excess of the Milky Way neutral H, with an estimated column density of , no excess absorption is detected in Mrk 1243.
The intervening medium observed in some AGNs may be the result of material ejected from the nuclear regions and – lying along the line of sight to the central source, under the influence of its strong ionizing continuum – it should be probably free of dust. The typically more similar profiles of narrow-line emitting sources, particularly in NLS1s, suggest that this type of effect is not similarly common in these objects. This property is consistent with other evidence which, based on IR observations, suggests that the environment of NLS1s is typically richer in dust than that of other type 1 objects [26].
4 Conclusions
From analysis of the broad components of the emission lines in type 1 AGNs, we find that a systematic difference between H and H becomes more and more significant with increasing line width. If this effect is related to the presence of a layer of ionized gas in front of the source, as some X-ray spectra appear to support, then narrow lined type 1 AGNs, and in particular NLS1s, might be operating in a phase where the development of this structure has not yet been fully accomplished. This consideration, which favours the evolutionary interpretation of the nature of NLS1s over a mere geometrical effect, is also consistent with the claim that NLS1s are hosted in dust-rich environments that would otherwise be swept by the nuclear activity. Clearly the evidence for such an interpretation is still limited and much more effort must be devoted to the execution of multiple wavelength investigations that may include sufficient optical, IR and X-ray data to better clarify the matter.
Acknowledgements
This conference has been organized with the support of the Department of Physics and Astronomy “Galileo Galilei”, the University of Padova, the National Institute of Astrophysics INAF, the Padova Planetarium, and the RadioNet consortium. RadioNet has received funding from the European Union’s Horizon 2020 research and innovation programme under grant agreement No 730562. J. H. Fan’s work is partially supported by the National Natural Science Foundation of China (NSFC 11733001, NSFC U1531245). We thank the referee for comments and suggestions leading to the improvement of this text.
References
- [1] D. E. Osterbrock and R. W. Pogge, The spectra of narrow-line Seyfert 1 galaxies, %2C(Astrophys. J. (297) (1985) 166.
- [2] R. Antonucci, Unified models for active galactic nuclei and quasars, %2C(Ann. Rev. Astron. & Astrophys. (31) (1993) 473.
- [3] A. Laor, B. T. Jannuzi, R. F. Green and T. A. Boroson, The Ultraviolet Properties of the Narrow-Line Quasar I Zw 1, %2C(Astrophys. J. (489) (1997) 656 [astro-ph/9706264].
- [4] M. Vestergaard and B. J. Wilkes, An Empirical Ultraviolet Template for Iron Emission in Quasars as Derived from I Zwicky 1, ApJS 134 (2001) 1 [astro-ph/0104320].
- [5] T. Boller, W. N. Brandt and H. Fink, Soft X-ray properties of narrow-line Seyfert 1 galaxies., A&A 305 (1996) 53 [astro-ph/9504093].
- [6] S. Mathur, Narrow-line Seyfert 1 galaxies and the evolution of galaxies and active galaxies, MNRAS 314 (2000) L17 [astro-ph/0003111].
- [7] S. Mathur, J. Kuraszkiewicz and B. Czerny, Evolution of active galaxies: black-hole mass-bulge relations for narrow line objects, NewA 6 (2001) 321 [astro-ph/0104263].
- [8] R. Decarli, M. Dotti, M. Fontana and F. Haardt, Are the black hole masses in narrow-line Seyfert 1 galaxies actually small?, MNRAS 386 (2008) L15 [0801.4560].
- [9] G. Orban de Xivry, R. Davies, M. Schartmann, S. Komossa, A. Marconi, E. Hicks et al., The role of secular evolution in the black hole growth of narrow-line Seyfert 1 galaxies, MNRAS 417 (2011) 2721 [1104.5023].
- [10] G. La Mura, F. Di Mille, S. Ciroi, L. Č. Popović and P. Rafanelli, Balmer Emission Line Profiles and Complex Properties of Broad-Line Regions in Active Galactic Nuclei, %2C(Astrophys. J. (693) (2009) 1437 [0811.2655].
- [11] M. Berton, E. Congiu, E. Järvelä, R. Antonucci, P. Kharb, M. L. Lister et al., Radio-emitting narrow-line Seyfert 1 galaxies in the JVLA perspective, A&A 614 (2018) A87 [1801.03519].
- [12] D. G. York, J. Adelman, J. E. Anderson, Jr., S. F. Anderson, J. Annis, N. A. Bahcall et al., The Sloan Digital Sky Survey: Technical Summary, AJ 120 (2000) 1579 [astro-ph/0006396].
- [13] D. H. Jones, W. Saunders, M. Colless, M. A. Read, Q. A. Parker, F. G. Watson et al., The 6dF Galaxy Survey: samples, observational techniques and the first data release, MNRAS 355 (2004) 747 [astro-ph/0403501].
- [14] D. H. Jones, M. A. Read, W. Saunders, M. Colless, T. Jarrett, Q. A. Parker et al., The 6dF Galaxy Survey: final redshift release (DR3) and southern large-scale structures, MNRAS 399 (2009) 683 [0903.5451].
- [15] V. Cracco, S. Ciroi, M. Berton, F. Di Mille, L. Foschini, G. La Mura et al., A spectroscopic analysis of a sample of narrow-line Seyfert 1 galaxies selected from the Sloan Digital Sky Survey, MNRAS 462 (2016) 1256 [1607.03438].
- [16] S. Rakshit, C. S. Stalin, H. Chand and X.-G. Zhang, A Catalog of Narrow Line Seyfert 1 Galaxies from the Sloan Digital Sky Survey Data Release 12, ApJS 229 (2017) 39 [1704.07700].
- [17] S. Chen, M. Berton, G. La Mura, E. Congiu, V. Cracco, L. Foschini et al., Probing narrow-line Seyfert 1 galaxies in the southern hemisphere, A&A accepted (2018) [1801.07234].
- [18] B. Abolfathi, D. S. Aguado, G. Aguilar, C. Allende Prieto, A. Almeida, T. Tasnim Ananna et al., The Fourteenth Data Release of the Sloan Digital Sky Survey: First Spectroscopic Data from the Extended Baryon Oscillation Spectroscopic Survey and from the Second Phase of the Apache Point Observatory Galactic Evolution Experiment, ApJS 235 (2018) 42 [1707.09322].
- [19] J. A. Cardelli, G. C. Clayton and J. S. Mathis, The relationship between infrared, optical, and ultraviolet extinction, %2C(Astrophys. J. (345) (1989) 245.
- [20] L. Bianchi, J. Herald, B. Efremova, L. Girardi, A. Zabot, P. Marigo et al., GALEX catalogs of UV sources: statistical properties and sample science applications: hot white dwarfs in the Milky Way, Ap&SS 335 (2011) 161.
- [21] J. A. Baldwin, M. M. Phillips and R. Terlevich, Classification parameters for the emission-line spectra of extragalactic objects, PASP 93 (1981) 5.
- [22] S. Veilleux and D. E. Osterbrock, Spectral classification of emission-line galaxies, ApJS 63 (1987) 295.
- [23] L. J. Kewley, B. Groves, G. Kauffmann and T. Heckman, The host galaxies and classification of active galactic nuclei, MNRAS 372 (2006) 961 [astro-ph/0605681].
- [24] S. Kaspi, P. S. Smith, H. Netzer, D. Maoz, B. T. Jannuzi and U. Giveon, Reverberation Measurements for 17 Quasars and the Size-Mass-Luminosity Relations in Active Galactic Nuclei, %2C(Astrophys. J. (533) (2000) 631 [astro-ph/9911476].
- [25] M. C. Bentz, J. L. Walsh, A. J. Barth, Y. Yoshii, J.-H. Woo, X. Wang et al., The Lick AGN Monitoring Project: Reverberation Mapping of Optical Hydrogen and Helium Recombination Lines, %2C(Astrophys. J. (716) (2010) 993 [1004.2922].
- [26] P. S. Chen, J. Y. Liu and H. G. Shan, Infrared photometric study of SDSS selected narrow line Seyfert 1 galaxies, NewA 54 (2017) 30.