QoS aware Automatic Web Service Composition with Multiple objectives
Abstract
With increasing number of web services, providing an end-to-end Quality of Service (QoS) guarantee in responding to user queries is becoming an important concern. Multiple QoS parameters (e.g., response time, latency, throughput, reliability, availability, success rate) are associated with a service, thereby, service composition with a large number of candidate services is a challenging multi-objective optimization problem. In this paper, we study the multi-constrained multi-objective QoS aware web service composition problem and propose three different approaches to solve the same, one optimal, based on Pareto front construction and two other based on heuristically traversing the solution space. We compare the performance of the heuristics against the optimal, and show the effectiveness of our proposals over other classical approaches for the same problem setting, with experiments on WSC-2009 and ICEBE-2005 datasets.
Index Terms:
Service Composition, Quality of Service (QoS), Multi-objective, Pareto optimal1 Introduction
In recent times, web services have become ubiquitous with the proliferation of Internet usage. A web service is a software component, that takes a set of inputs, performs a specific task and produces a set of outputs. A set of non-functional quality of service (QoS) parameters (e.g., response time, throughput, reliability etc.) are associated with a web service. These QoS parameters determine the performance of a service. Sometimes, a single web service falls short to respond to a user query. Therefore, service composition [1, 2] is required. During service composition, multiple services are combined in a specific order based on their input-output dependencies to produce a desired set of outputs. While providing a solution in response to a query, it is also necessary to ensure fulfillment of end-to-end QoS requirements [3], which is the main challenge in QoS aware service composition [4, 5, 6].
A large body of literature in service composition deals with optimization of a single QoS parameter [7, 8], especially, response time or throughput. However, a service may have multiple QoS parameters; therefore, the service composition problem turns out to be a multi-objective optimization problem. Though optimality of the end solution is the primary concern in multi-objective service composition, computing the optimal solution is time consuming. This has led to another popular research theme around multi-constrained service composition [9, 10], where a constraint is specified on each QoS parameter and the objective is to satisfy all the QoS constraints in the best possible way.
Two different models have been considered in service composition literature, namely, workflow based model (WM) [11, 12] and input-output dependency based model (IOM) [7]. The salient features of both the models are discussed in Table I. Most of the research proposals on multiple-QoS aware service composition have considered WM [13, 14]. In general, the methods proposed in WM cannot solve the problem in IOM, since in IOM, in addition to the QoS values of a service, the input-output dependencies between the service also need to be considered. Approaches [15, 16], that consider IOM typically transform the multiple objectives into a single objective and generate the optimal solution instead of the Pareto optimal solutions [17]. A weighted sum is used to convert multiple objectives into a single objective. However, finding the weights is a challenging task.
| Features | WM | IOM |
| Query specification | A Workflow: a set of tasks to be performed in a specific order | A set of given query inputs and a set of desired query outputs |
| Query objective | To serve the query by selecting a service for each task so that | To serve the query by identifying a set of services that are directly |
| the overall QoS values are optimized, where the service | (by the query inputs) or indirectly (by the outputs of the services that | |
| repository contains a set of functionally equivalent services | are directly or indirectly activated by the query inputs) activated by the | |
| for each task | query inputs and can produce the query outputs | |
| Search Space | , the number of tasks and the number of functionally | (in the worst case), the total number of services that can be |
| equivalent services for each task; Total number of services | activated by the query inputs | |
| that can participate to serve the query | ||
| Complexity | For a single QoS parameter, finding the optimal solution is a | Though each of response time and throughput, when treated as an individual |
| polynomial time algorithm [18]. For multiple QoS parameters, | parameter can be optimized in polynomial time, some of the other parameters | |
| finding the Pareto optimal solutions is NP-hard [19] | (e.g., reliability, price, availability) require exponential time procedures, even | |
| when a single parameter optimization is considered. Multiple parameters | ||
| and their simultaneous optimization turns out to be a hard problem [20] |
In this paper, we study the multi-objective QoS-aware web service composition problem in IOM. To the best of our knowledge, there is not much work in IOM considering multiple QoS aware service composition based on Pareto front construction. However, considering the parameters individually instead of a weighted sum combination, has a major significance, since it can deal with the users having various QoS preferences. Additionally, we have considered multiple local and global constraints on different QoS parameters. In this paper, our major contributions are as follows:
• We first propose an optimal algorithm, that constructs the Pareto optimal solution frontier satisfying all QoS constraints for the multi objective problem in IOM. We theoretically prove the soundness and completeness of our algorithm.
• Additionally, we propose two heuristics. The first one employs a beam search strategy [21], while the other is based on non deterministic sorting genetic algorithm (NSGA) [22].
2 Related Work
Automatic service composition [26, 27] is a fundamental problem in services computing. A significant body of research has been carried out on QoS-aware service composition considering a single QoS parameter, especially, response time and throughput [28, 29, 30]. Multiple-QoS aware service composition has been discussed in [31]. We first discuss related work regarding the models followed by the solution approaches for multiple QoS aware web service composition.
2.1 Problem Models
The two most popular models considered in literature are the workflow model (WM) and input-output dependency based model (IOM). The salient features of these two models are discussed in Table I. In WM, it is assumed that a task can be accomplished by a single web service. However, in practice, it may not be the case always. Some times more than one service may be required to perform a particular task. Therefore, the input-output dependency based model becomes popular.
It may be noted, existing solution approaches for WM are unable to solve the composition problem in IOM. This is mainly because of the following reasons:
-
•
In WM, a workflow is provided as an input, whereas, in IOM, no workflow is provided, rather the aim of IOM is to find out a flow of services to serve the query so that the overall QoS values are optimized.
-
•
In general, while selecting a service in WM, only the QoS values of the service need to be taken care of. In contrast to the former case, while selecting a service in IOM, not only the QoS values of the services need to be considered but also its input-output dependencies on the other services need to be taken into account.
-
•
In WM, the number of services does not vary across all solutions, while, in IOM, the number of services varies across the solutions to a query.
However, methods that can solve the composition problem in IOM can solve the composition problem in WM. Moreover, the search space of WM is a subset of the search space of IOM. We now discuss different solution models.
2.2 Solution Models and Approaches
We classify below the different solution models and discuss the approaches existing in literature.
Scalarization (SOO): To deal with multiple QoS aware service composition, [12, 32, 33] have resorted to scalarization techniques to convert multiple objectives into a single objective using the weighted sum method. In [25], the authors have proposed a planning graph based approach and an anytime algorithm that attempts to maximize the utility in IOM. A scalarization technique in WM was proposed in [12]. Though scalarization techniques are simple and easy to implement, however, some information may be lost due to the transformation from multiple objectives to a single objective. Moreover, finding the weights of the parameters is difficult. User preferences are required to decide the weights of the parameters, which is not always easy to identify. Even though the preferences of the parameters are obtained, it is not easy to quantify the preferences to find the weights of the parameters, which has a great impact on finding the optimal solution.
Single-objective multi-constrained optimization (SOMCO): To overcome the shortcomings of scalarization techniques, researchers have looked at another popular approach, namely, single-objective multi-constrained optimization [19, 34, 35]. In this approach, one parameter is selected as the primary parameter to be optimized, while for the rest of the parameters, a worst case bound is set (often termed as constraints). For example, in [36], the authors analyzed the relation between multi-objective service composition and the Multi-choice, Multi-dimension 0-1 Knapsack Problem (MMKP) in WM and used the weighted sum approach to compute the utility function. The objective of [36] is to maximize the total utility while satisfying different QoS constraints. In [19] and [34], authors proposed a multi constrained QoS aware service composition approach, instead of finding the optimal solutions in WM. In [19], an Integer Linear Programming (ILP) based approach was proposed, where ILP is used to divide the global constraints into a set of local constraints and then using the local constraints, the service selection is done for each task in WM. In [37, 3], ILP based methods are used to solve multi-constrained service composition in WM. Dynamic binding is the main concern of [34], where authors proposed to generate the skyline services for each task in WM and cluster the services using the K-means algorithm. In [35], an ILP based multi-constrained service composition was proposed in IOM. In this class of methods as well, selecting the primary parameter to optimize (and rest to put constraints on) is a challenging problem and often depends on user preferences. Moreover, determining the constraint values is not an easy task and may this often lead to no solution being generated (i.e., no solution exists to satisfy all the constraints).
Pareto optimal front construction (POFC): To address the above challenges, another research approach based on constructing the Pareto optimal frontier has been proposed. A Pareto front consists of the set of solutions where each solution is either same or better in at-least one QoS value than rest of the solutions belonging to the Pareto front. This approach does not require identifying the user preferences of the QoS parameters. Therefore, this approach can easily deal with users having different preferences. To the best of our knowledge, most of the work based on Pareto front construction [37] focus on WM. For example, in [17], the authors proposed to generate the Pareto optimal solutions in a parallel setting. In [38], the authors proposed a fully polynomial time approximation method to solve the problem. A significant amount of work has been done based on evolutionary algorithms [39, 40], such as Particle Swarm Optimization [41], Ant Colony Optimization [42], Bee Colony Optimization [43], Genetic Algorithms [44, 45], NSGA2 [46, 47]. In this paper, we consider the Pareto front construction model on IOM.
Table II summarizes the state-of-the-art methods considering different models that have been discussed above.
2.3 Novelty of our work and contributions
In contrast to the above, we consider this problem in IOM-POFC setting. In addition, we have considered local and global constraints on QoS parameters. In Section 3, we formally describe our model.
The search space of the composition problem addressed in this paper is exponential as discussed earlier. Therefore, we first try to reduce the search space of our algorithm using clustering as demonstrated in [48, 32]. On the reduced search space, we propose an optimal algorithm using a graph based method. In literature, the graph based methods [33, 29, 30] are mainly applied either to solve the service composition problem for single parameter optimization or to solve the multiple QoS aware problem using scalarization. In this paper, we apply the graph based approach to construct a Pareto optimal solution frontier. The optimal algorithm is an exponential time procedure and often does not scale for large scale composition. Therefore, we further propose two heuristic algorithms.
Our first heuristic algorithm is based on beam search technique. Beam search technique is applied in [25] to solve the multiple QoS aware problem using scalarization. Here, we use the beam search technique to find Pareto optimal solutions. Since our algorithm is a heuristic approach, it does not generate the optimal solutions. However, we have shown that the solution quality monotonically improves with increase in the size of the beam width.
Our second heuristic algorithm is based on NSGA. Though multiple evolutionary algorithms exist in literature [44, 45, 46, 47] to solve multiple QoS aware optimization, however, all these methods, to the best of our knowledge, solve the problem in WM. We use it to find the solutions for IOM. Moreover, in each step of the algorithm based on NSGA, we ensure that the solutions generated by the algorithm is a functionally valid solution.
3 Background and Problem Formulation
In this section, we discuss some background concepts for our work. We begin with a classification of a QoS parameter.
Definition 3.1.
[Positive / Negative QoS parameter:] A QoS parameter is called a positive (negative) QoS parameter, if a higher (lower) value of the parameter implies better performance.
Reliability, availability, throughput are examples of positive QoS parameters, while response time, latency are examples of negative QoS parameters.
Consider two services and being compared with respect to a QoS parameter . We have the following cases:
-
•
is better than with respect to implies,
-
–
If is a positive QoS, , where and are the respective values of for and .
-
–
If is a negative QoS parameter, .
-
–
-
•
is as good as with respect to implies, , irrespective of whether is positive or negative.
-
•
is at least as good as with respect to implies, either is better than or is as good as with respect to .
The QoS parameters are further classified into four categories based on the aggregate functions used for composition: maximum, minimum, addition, multiplication.
A query is specified in terms of a set of input-output parameters. We now present the concept of eventual activation of a web service for a given query. A web service is activated, when the set of inputs of the service is available in the system. As an example, consider in Table III, is activated when its input is available. A service is eventually activated by a set of input parameters , if is either directly activated by itself or indirectly activated by the outputs of the set of services that are eventually activated by , as shown in Example 3.1. In the next subsection, we formally discuss the model considered in this paper and our objective.
3.1 Problem Formulation
The service composition problem considered in this paper can be formally described as below:
-
•
A set of web services
-
•
For each service , a set of inputs and a set of outputs
-
•
A set of QoS parameters
-
•
For each service , a tuple of QoS values
-
•
A set of aggregation functions , where is defined for a QoS parameter
-
•
A query , specified by a set of inputs and a set of requested outputs
-
•
Optionally, a set of local QoS constraints and a set of global QoS constraints
A constraint denotes a bound on the worst case value of a QoS parameter. While the local constraints are applicable on a single service ( in Example 3.1), the global constraints are applicable on a composition solution, ( in Example 3.1).
The objective of multi-objective QoS constrained service composition is to serve in a way such that the QoS values are optimized, while ensuring functional dependencies are preserved, and all local and global QoS constraints are satisfied. Since multiple (and often disparate) QoS parameters are involved, this calls for a classical multi-objective optimization, and we address this challenge in this work. In this paper, we propose an optimal solution construction methodology. Often, a single solution may not be the best with respect to all the QoS parameters. Therefore, instead of producing a single solution, our method generates a set of Pareto optimal solutions as described in the following sections.
3.2 Running Example
We now present an illustrative example for our problem.
Example 3.1.
Table III shows a brief description of the services in a service repository, their inputs, outputs and values of response time (in ms), throughput (number of service invocations per minute) and reliability (in percentage) in the form of a tuple (RT, T, R).
| Services | Inputs | Outputs | (RT, T, R) |
|---|---|---|---|
| (500, 7, 93%) | |||
| (600, 13, 69%) | |||
| (350, 4, 97%) | |||
| (475, 3, 85%) | |||
| (1300, 15, 81%) | |||
| (700, 19, 90%) | |||
| (1100, 9, 80%) | |||
| (1100, 6, 73%) | |||
| (300, 13, 79%) | |||
| (800, 9, 78%) | |||
| (1300, 3, 65%) | |||
| (900, 7, 83%) | |||
| (400, 9, 93%) | |||
| (750, 5, 79%) | |||
| (700, 17, 91%) | |||
| (500, 13, 90%) | |||
| (150, 5, 86%) | |||
| (400, 2, 73%) | |||
| (300, 3, 81%) | |||
| (1500, 12, 94%) | |||
| (900, 14, 97%) | |||
| (1700, 14, 87%) | |||
| (1100, 10, 80%) | |||
| (1700, 12, 81%) | |||
| (1400, 13, 83%) | |||
| (1900, 7, 80%) | |||
| (1500, 11, 92%) | |||
| (1100, 15, 94%) | |||
| (500, 17, 72%) | |||
| (350, 12, 74%) |
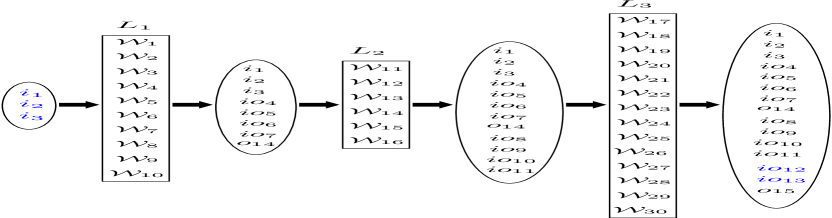
Consider a query with inputs and desired outputs . The objective is to find a solution to the query in such a way that the values of the QoS parameters are optimized (i.e., minimizing response time, maximizing throughput and reliability). It may be noted, a single solution may not be able to optimize all the QoS parameters. Therefore, multiple solutions need to be generated optimizing different QoS parameters.
The services that are eventually activated by the query inputs are shown in Figure 1. The services at of Figure 1 are directly activated by the query inputs, while the services at and are indirectly activated by the query inputs. Each ellipse represents the input parameters available in the system at a particular point of time. Additionally, we have the following set of constraints.
-
•
Each service participating in the solution must have a reliability value greater than .
-
•
The reliability of the solution must be more than .
-
•
The response time of the solution must be less than s.
In this paper, we demonstrate the Pareto optimal solutions construction method given the above scenario using this example.
4 Solution Architecture
In the following, we first define a few terminologies to build up the foundation of our work.
Definition 4.1.
[Dominating Service:] A service with QoS tuple dominates another service with , if , is at least as good as and , such that, is better than . is called the dominating service and is dominated.
Example 4.1.
Consider and in Table III with QoS tuples and respectively. dominates , since has a lesser response time, higher throughput and reliability as compared to .
Definition 4.2.
[Mutually Non Dominated Services:] Two services and are said to be mutually non-dominated, if no one dominates the other, i.e., no service is a dominating service.
Example 4.2.
Consider and in Table III with QoS tuples and respectively. and are mutually non-dominated. has higher throughput than , while has lower response time and higher reliability.
Definition 4.3.
[Skyline Service Set:] Given a set of services , the skyline service set is a subset of such that the services in are non-dominated and each service in is dominated by at least one service in .
Example 4.3.
Consider be the set with QoS tuples , , , respectively (as in Table III). is the set of skyline services. , and are non-dominated, while dominates .
The skyline service set for to a given set of services is unique.
Definition 4.4.
[Non Dominated Tuple:] Given a set of QoS tuples , a tuple is called non dominated, if such that is better than .
A QoS tuple is better than implies, each QoS parameter in is at least as good as in , while at least one QoS parameter in is better than in , where the terms “at least as good as” and “better than” are used with the same meaning as defined earlier in the context of comparing two services.
Example 4.4.
Consider a set of QoS tuples . = , , constitute the set of non dominated tuples, since, the three tuples in are non dominated and is dominated by .
As discussed earlier, a composition solution with respect to a query is a collection of services that are eventually activated by and produce . During this process of activation, all functional dependencies are preserved. We now define different characterizations of a solution.
Definition 4.5.
[Feasible Solution:] A composition solution is feasible if it satisfies all local () and global () constraints.
Example 4.5.
Consider the service descriptions and the query discussed in Example 3.1. is a solution to the query, where and are executed in parallel, while , and the parallel combination of and are executed sequentially. The QoS tuple for the composition solution is . This does not satisfy any of the global constraints and violates the local constraint as well and therefore, is not feasible. Consider another solution, . The QoS tuple for the solution is , which satisfies both the local and the global constraints. Therefore, the solution is feasible.
Definition 4.6.
[Non Dominated Solution:] A composition solution with QoS tuple is a non-dominated solution, if and only if with QoS tuple such that for which is better than and rest of the parameters in are at least as good as in .
In other words, has a better value for at least one QoS than any solution , .
Definition 4.7.
[Pareto Front:] The set of non-dominated solutions with respect to a query is called the Pareto front.
In a multi-objective composition problem, we may not find a single solution which is optimal in all respects, rather, we may find a Pareto front consisting of a set of non-dominated solutions. The feasible solutions obtained from the Pareto front constitute the optimal solution space of our problem.
We now present an optimal solution generation technique. Our proposal has two main phases: a preprocessing phase and a run-time computation phase. The aim of the preprocessing phase is to reduce the number of services participating in solution construction, while the main aim of the run-time computation phase is to compute the solution in response to a query. Below, we explain our proposal in detail.
4.1 Preprocessing phase
The motivation behind preprocessing the web services is to reduce the run-time computation. We first define the notion of equivalent services, which serve as the foundation.
Definition 4.8.
[Equivalent Services:] Two services and are equivalent (), if the inputs of are same as in , and the outputs of are same as in .
Example 4.6.
Consider the first two services of Table III: and with input and outputs . Here, and are equivalent, since, they have identical inputs and outputs.
Here, we apply the clustering technique proposed in [48]. As the first step of preprocessing, we compute the set of equivalent services. Each equivalence class forms a cluster, while the set of equivalence classes of a given set of web services forms a partition of . Therefore, the clusters are mutually exclusive and collectively exhaustive. We first divide the services in the service repository into multiple clusters and represent each cluster by a single representative service. Once the services are clustered, we find the skyline service set for each cluster. The set of skyline services is used for our run-time service composition step.
The representative service corresponding to each cluster is associated with multiple QoS tuples corresponding to each service of the skyline service set. The main aim of this step is to prune the search space. Since the number of clusters must be less than or equal to the number of services in the service repository, the number of services reduces by this preprocessing. After preprocessing, we now have the following set of services: , where and each service consists of a set of QoS tuples . Equality condition holds, only when the service repository does not contain any equivalent services and the preprocessing phase cannot reduce the number of services.
Example 4.7.
If we cluster the services shown in Table III, the number of services reduces from 30 to 12. Table IV shows the clustered service set. The first column of Table IV presents the representative service for each cluster, while the second column shows the cluster itself. Finally, the third column indicates the set of QoS tuples corresponding to each service of the skyline services corresponding to a cluster. Consider the first cluster , shown in the first row of Table IV. is the representative service corresponding to . The skyline service set of is . Therefore, consists of the QoS tuple corresponding to each service in .
| Representative | Cluster | (RT, T, R) |
|---|---|---|
| Web Service | ||
| (500, 7, 93%), (350, 4, 97%), (600, 13, 69%) | ||
| (700, 19, 90%) | ||
| (1100, 9, 80%) | ||
| (300, 13, 79%) | ||
| (400, 9, 93%) | ||
| (700, 17, 91%), (500, 13, 90%) | ||
| (150, 5, 86%) | ||
| (900, 14, 97%) | ||
| (1700, 14, 87%), (1400, 13, 83%) | ||
| (1100, 10, 80%), (1700, 12, 81%) | ||
| (1100, 15, 94%) | ||
| (500, 17, 72%), (350, 12, 74%) |
Consider the query in Example 3.1. The number of services reduces from 30 to 12. The number of QoS tuples reduces from 30 to 18.
The preprocessing step helps to prune the search space by removing some services. No useful solution in terms of QoS values is lost in preprocessing, as stated formally below.
Lemma 1.
The preprocessing step is Pareto optimal solution preserving in terms of QoS values.
All proofs are compiled in Appendix.
4.2 Dependency graph construction
The composition solutions are generated at run-time in response to a query. To find a response to a query, a dependency graph is constructed first. The dependency graph is a directed graph, where is the set of nodes and is the set of edges. Each node corresponds to a service that is eventually activated by the query inputs and each directed edge represents a direct dependency between two services, i.e., the service corresponding to the node produces an output which is an input of the service corresponding to the node . Each edge is annotated by the input-output of the services. Each solution to a query is either a path or a subgraph of [28].
The dependency graph is constructed using the algorithm illustrated in [33]. While constructing the dependency graph, here we additionally validate the local and global constraints. While the local constraints are validated once, when a service is selected for the first time, the global constraints are validated in each step of the solution construction. While an activated service is selected for node construction, the service is first validated against the set of local and global constraints. Each service corresponds to a set of skyline services. If any service from the skyline services violates any local / global constraint, we disregard that service by removing its corresponding QoS tuple from of . If is empty, we do not construct any node corresponding to . It may be noted, if a service violates any of the global constraints, any solution that includes also violates the global constraint.
Example 4.8.
Consider Example 3.1. To respond to the query, while constructing the dependency graph, four services and are activated from the query inputs at first. It may be noted, is associated with three QoS tuples (500, 7, 93%), (350, 4, 97%) and (600, 13, 69%), out of which one tuple (600, 13, 69%) violates , since its reliability is less than 70%. Therefore, while validating , the third tuple, i.e., (600, 13, 69%) is removed from corresponding to .
During dependency graph construction, the set of services that can be activated by the query inputs are identified first. With the set of identified services, the dependency graph is constructed. Finally, backward breadth first search (BFS) is used in to identify the set of nodes that are required to produce the set of query outputs. The remaining nodes are removed from the graph.
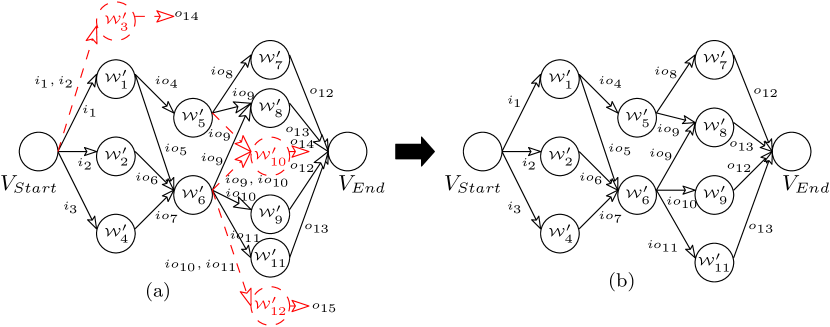
Example 4.9.
Consider the query in Example 3.1. Figure 2 shows the dependency graph constructed over the services described in Table IV in response to the query. Figure 2(a) shows the dependency graph constructed from the query inputs, while Figure 2(b) shows the one generated after removal of unused nodes. In Figure 2(a), the nodes marked with red represent the services that do not take part to produce the query outputs.
If the dependency graph consists of a loop, we identify the loop and break the cycle [7]. Finally, we partition the dependency graph into multiple layers using the approach used in [33], where a node belongs to a layer , if for all the edges , belongs to any layer , where . The first layer consists of a single node . Finally, we introduce dummy nodes in each layer if necessary as demonstrated in [33], to ensure that each node in a layer is connected only to the nodes in either its immediate predecessor layer or its immediate successor layer . We assume that each dummy node has a QoS tuple with the best value for each QoS parameter. If a solution to a query consists of any dummy node, the dummy node is removed from the solution while returning the solution. The above assumption ensures that after removal of the dummy nodes, the QoS values of the solution remain unchanged. In the next subsection, we discuss the feasible Pareto optimal solution frontier generation technique.
5 Pareto Front Construction
To find the feasible Pareto optimal solutions, we transform the dependency graph into a layered path generation graph (LPG). LPG is a directed acyclic graph, where is a set of nodes and is a set of edges. Each node consists of a set of nodes of . A directed edge from to exists, if each service corresponding to a node , belonging to is activated by the outputs of the services corresponding to the nodes, belonging to . Similar to the dependency graph, the LPG also consists of two dummy nodes: a start node and an end node consisting of the start node and the end node of respectively. We assume that each dummy node has a QoS tuple with the best value for each QoS parameter. While constructing , we simultaneously compute the Pareto optimal solution frontier and validate the global constraints. We define the notion of a cumulative Pareto optimal tuple.
Definition 5.1.
[Cumulative Pareto Optimal Tuple:] A set of non dominated QoS tuples, generated due to the composition of a set of services during an intermediate step of the solution construction, is called a cumulative Pareto optimal tuple.
The cumulative Pareto optimal tuples, generated at the final step of the solution construction, is the Pareto front. For each node , we maintain two sets of QoS tuples: a set of non dominated tuples and a set of cumulative Pareto optimal tuples. We now discuss the construction of .
To construct , we traverse the graph in a backward direction, starting from the node . We start the transformation from dependency graph to LPG by constructing a dummy node of consisting of of . During the procedure, we maintain a FIFO (i.e., First In First Out) queue. The following steps convert to :
-
•
The first node is removed from the queue.
-
•
The set of predecessor nodes of is constructed.
-
•
For each predecessor node of , the temporary Pareto optimal front till is constructed or modified (for already existing nodes).
-
•
For each Pareto optimal QoS tuple till , the global constraints are validated. If any global constraint is violated, the tuple from the Pareto front is removed.
-
•
Each predecessor node is inserted in the queue, if the queue does not already hold the same.
We briefly elaborate each step below. We first insert in the queue and then continue the procedure until the queue becomes empty. In each step, we remove a node from the queue, say (in FIFO basis) and construct its predecessor nodes as described below.
Consider a node consisting of a set of nodes of . Also, consider be the set of inputs that are required to activate the services corresponding to . For each , we compute a set of nodes , such that an edge annotated by is incident to at least one node in . We then compute a set of combinations of nodes in consisting of a node from each , for all . We now define the notion of a redundant service.
Definition 5.2.
[Redundant Service:] A service belonging to a solution in response to a query is redundant, if is also a solution to .
We consider the following assumption: a solution with some redundant services cannot be better, in terms of QoS values, than . Two sets and may not be mutually exclusive, for , since the service corresponding to one node may produce more than one output from . Therefore, if we consider a combination consisting of one node from each , where , we do not need to consider any combination which is a superset of . For each combination, we construct a node and an edge of .
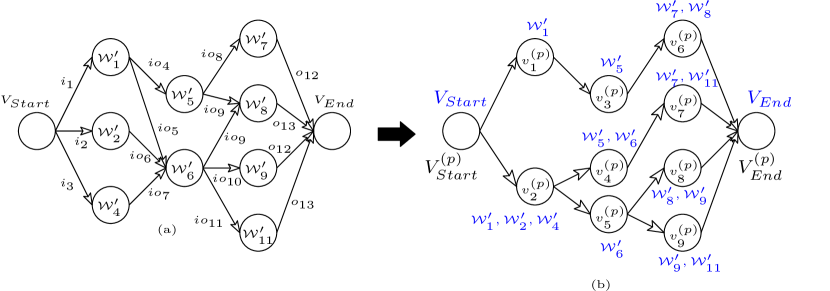
Example 5.1.
Fig. 3(b) shows the LPG generated from the dependency graph in Fig. 3(a). Consider the end node of Fig.3(b). consists of . is the required set of inputs (i.e., query outputs). and . We get 4 combinations from and construct a node for each combination and the corresponding edges. Consider another node of consisting of . The required set of inputs is . and . We get 2 combinations from . However, one combination is a superset of another . Therefore, we disregard the combination and construct a node corresponding to and the corresponding edge.
We now prove the following lemma.
Lemma 2.
Each path from to in represents a solution to the query in terms of functional dependencies.
Once a node of is constructed, we construct the set of Pareto optimal tuples corresponding to the node. Consider a node consisting of a set of nodes of . The QoS tuples corresponding to are combined and a new set of tuples, , is constructed. Each tuple in is then validated against the set of global constraints . If any tuple violates any of the global constraints, the tuple is removed from . If no tuple from satisfies the global constraints, we disregard the node . Otherwise, we compute the set of non dominated tuples from and associate these with . Consider is removed from the queue and is created as the predecessor of . If already exists in the queue, we do not need to recompute the set of non dominated tuples of . Once the set of non dominated tuples corresponding to are constructed, we construct the cumulative Pareto optimal solutions till .
In order to find the Pareto front till , we combine the tuples in the Pareto front constructed till with the set of non dominated tuples of . The combined tuples are verified against the global constraints and if any tuple violates any of the global constraints, we remove the tuple from the combined set. Finally, we compute the cumulative Pareto optimal solutions till from the set of combined tuples and the cumulative Pareto front of . The Pareto front constructed in constitutes the feasible Pareto optimal solutions to the query.
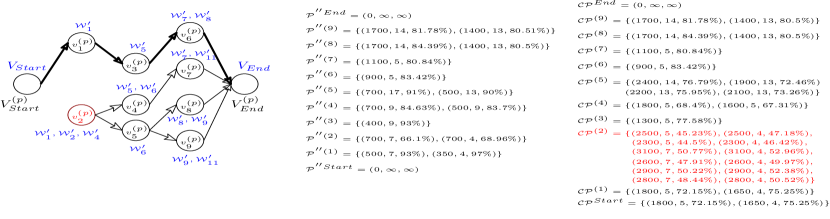
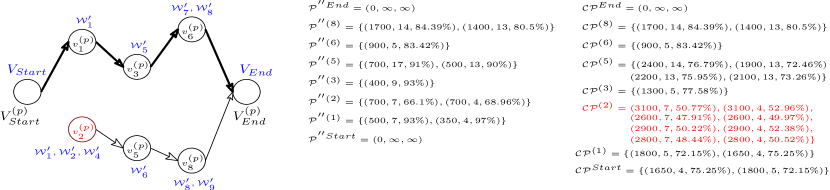
Example 5.2.
Fig. 4 shows the Feasible Pareto front generation method on a LPG. The set of initial non dominated tuples of consists of one tuple , initialized with the best values of these parameters. The cumulative Pareto optimal front of also consists of the same tuple.
Now consider a node . When is created as a predecessor of , the set of non dominated tuples corresponding to are constructed first. The cumulative Pareto front till is constructed next by combining the cumulative Pareto front till and the set of non dominated tuples of , followed by selecting the Pareto front from the combined set. In the next iteration, when is constructed as a predecessor of , the set of non dominated tuples are not recomputed. However, is modified. The cumulative Pareto front till and the set of non dominated tuples of are combined first and then the Pareto front is selected from the combined set and the already existing set . It may be noted, the cumulative Pareto front till violates the global constraints. Hence, the node is disregarded from the graph. The final solution path is marked by the bold line.
Algorithm 1 presents the formal algorithm for constructing the feasible Pareto optimal solution in response to a query. We now prove the following lemma.
Lemma 3.
Algorithm 1 is complete.
Lemma 4.
Algorithm 1 is sound.
The search space of this algorithm is exponential in terms of the number of services required to serve a query. This limits its scalability to large service repositories. In the next subsection, we propose two scalable heuristics.
6 A Heuristic Approach
We first discuss the limitation of the solution discussed in the previous subsection. It is easy to see that Step 6 of Algorithm 1, where the set of predecessors of a node is constructed, may explode. Consider the following example.
Example 6.1.
Consider a node of LPG requires 10 inputs and each input is provided by 10 nodes of the dependency graph. The number of possible predecessor nodes of is .
If the number of inputs of a node or the number of nodes providing an input, increases, the number of predecessor nodes also increases exponentially. In our heuristic, we try to address the above issue. The main motivation of this algorithm is to reduce the search space of the original problem. On one hand, we attempt to reduce the number of combinations generated at Step 6 of Algorithm 1. On the other hand, we try to restrict the number of nodes generated at a particular level of the LPG. Our approach is based on the notion of anytime algorithms[25] using beam search. Beam search uses breadth-first search to build its search space. However, at each level of the graph, we store only a fixed number of nodes, called the beam width. The greater the beam width, the fewer the number of nodes pruned.
While constructing , all predecessor nodes of the set of nodes at a particular level are computed, as earlier. However, only a subset of the nodes is stored depending on the beam width of the algorithm. Consider be the set of nodes generated at level and the beam width is . Therefore, only out of nodes are stored. The nodes are selected based on the values of the cumulative Pareto optimal tuples computed till , for . At each level, the selected set of nodes is ranked between . A node with rank has higher priority than a node with rank , where . Consider be the number of levels in the dependency graph, where the level consists of . The selection criteria for choosing nodes from level is discussed below.
-
•
The feasible non dominated tuples corresponding to the cumulative Pareto optimal tuples computed till each , for are computed first.
-
•
If , is returned.
-
•
If , the following steps are performed:
-
–
The utility corresponding to each tuple is computed as follows:
(1) (2) (3) (4) where is the normalized value of for .
-
–
Tuples in are sorted in descending order based on utility and finally, the first tuples are chosen, which are returned.
-
–
-
•
If , more tuples are chosen from using the same procedure discussed above.
-
•
Finally, the selected tuples are ranked based on their utility value. The rank of the tuple with the highest utility value is set to 1.
Consider be the set of tuples selected at level of . It may be noted, . Without loss of generality, we assume that the priority of is greater than that of , where . Also consider be the set of nodes corresponding to the tuples in . We further assume that at least one tuple corresponding to has higher priority than any tuple corresponding to , where . We now discuss the selection criteria for choosing nodes from level , where :
-
•
A cumulative Pareto optimal tuple corresponding to a node is selected for the rank position 1, if the following conditions are satisfied:
-
–
belongs to the set of predecessor nodes of .
-
–
has the highest utility value among all the cumulative Pareto optimal tuples corresponding to all the predecessor nodes of .
-
–
-
•
In general, a cumulative Pareto optimal tuple corresponding to a node is selected for the rank position , where , if:
-
–
belongs to , where is the node corresponding to and is the set of predecessor nodes of .
-
–
has the highest utility value among all the cumulative Pareto optimal tuples corresponding to .
-
–
-
•
A cumulative Pareto optimal tuple corresponding to a node is selected for rank (), if:
-
–
has the highest utility value among all the cumulative Pareto optimal tuples corresponding to .
-
–
Clearly, the search space of the algorithm is determined by the beam width. The main motivation of this algorithm is to be able to improve the solution quality monotonically with the increase in beam width. The selection procedure enforces this criteria. As the beam size increases, the number of pruned nodes decreases and the solution quality of the algorithm either remains same or improves, as formally stated below.
Lemma 5.
The solution quality of the heuristic algorithm monotonically improves with increase in beam width.
Lemma 6.
With an infinite beam width, the algorithm is identical to the Pareto optimal algorithm.
Since at each level, a finite number of nodes are generated, the above lemma holds. Moreover, if the beam width of the heuristic algorithm is greater than or equal to the maximum number of nodes belonging to a level of , where represents the complete LPG constructed by the optimal algorithm, no nodes are required to be pruned in this algorithm and thereby, the algorithm is identical to the optimal one.
7 Solution Generation Using NSGA
In this section, we present a different approach based on the non-dominated sorting genetic algorithm (NSGA) [22]. While the previous algorithms are deterministic algorithms, this is a randomized algorithm. This algorithm is basically an adaptive heuristic search algorithm based on the evolutionary ideas of natural selection and genetics [49].
In this algorithm, a population of candidate solutions, called phenotypes [49], to a query is evolved toward better solutions. Each candidate solution is encoded into a binary string, called chromosome or genotype, which can be mutated and altered. The algorithm starts from a population of randomly generated chromosomes. In each iteration (called a generation) of the algorithm, a new set of chromosomes are generated and the fitness of every chromosome in the population is evaluated. The fitness value of a chromosome usually refers to the value of the objective function in the optimization problem being solved. In this paper, the fitness value of a chromosome is computed (as discussed later) from the QoS values of its corresponding phenotype. The more fit chromosomes are selected from the current population to form the next generation. Each chromosome in the current population is modified using different genetic operators (namely crossover, mutation) to construct its off-string for the next generation. The algorithm terminates after a fixed number of iterations, which is provided externally.
Once a query comes to the system, the dependency graph is constructed first. The dependency graph contains all possible solutions to the query. The genetic algorithm is applied on the dependency graph to generate high-quality solutions. Before discussing the details of the algorithm, we first define the notion of a chromosome used in this paper.
Definition 7.1.
[Chromosome:] A chromosome is a binary string , where each bit of the string represents a node in the dependency graph constructed in response to a query and is defined as:
It may be noted, each binary string is not a valid solution in terms of functional dependency (e.g., the string of all ’s). Therefore, in our algorithm, we consider only those chromosomes which represent a valid solution to a query in terms of functional dependency. Later in this section, we present an algorithm for constructing a chromosome. In the next subsection, we present an overview of our algorithm.
7.1 Algorithm to generate Pareto optimal solution
Our algorithm has the following steps.
-
1.
Initial population construction: First chromosomes are chosen randomly to construct the initial population.
-
2.
Iteration of the algorithm: In each iteration of the algorithm, a new generation is created. The algorithm terminates after a fixed number of iterations , where is provided externally. The following steps are performed in each iteration of the algorithm.
-
(a)
Selection of parent chromosomes: Two chromosomes are chosen randomly from the current population using Roulette wheel selection [49].
- (b)
-
(c)
Mutation: Each off-spring, generated in the earlier step, is mutated to generate a new off-spring.
-
(d)
Fitness value computation: The fitness value for each chromosome in the population is computed.
-
(e)
Construction of new generation: The population now consists of more than chromosomes. Based on the fitness value of the chromosomes in the population, the best chromosomes are selected from the population and the rest of the chromosomes are removed.
-
(a)
-
3.
Solution construction: Once the algorithm terminates, the best chromosomes, obtained from the final population, are returned as the solutions of our algorithm.
We now briefly demonstrate each step of this algorithm.
7.2 Chromosome Construction
To construct a chromosome, we traverse the dependency graph backward starting from . Each bit of a chromosome is first initialized by 0. During the traversal of the dependency graph, whenever a node of the dependency graph is visited, the corresponding bit in the chromosome is marked as 1.
-
•
We start from and mark the corresponding bit in chromosome as 1.
-
•
For each input of a visited node , we randomly select a node that produces as output and mark the corresponding bit for as 1.
-
•
Each node is processed only once. In other words, if a node is encountered more than once, we do not reprocess the node.
-
•
The algorithm terminates when there is no node left for processing.
It may be noted, once the algorithm terminates, we get a valid solution in terms of functional dependency corresponding to the generated chromosome.
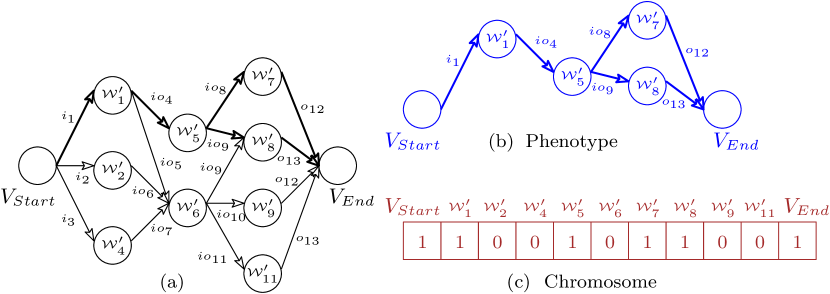
Example 7.1.
Consider the example shown in Figure 6. Figure 6(a) shows a dependency graph constructed in response to a query, while Figure 6(b) presents an example candidate solution (i.e., phenotype) constructed from the dependency graph.
We now discuss the two main operators of the genetic algorithm, namely, crossover and mutation.
7.3 Crossover
Crossover is a binary genetic operator used to obtain chromosomes from one generation to the next. In this paper, we consider only single point crossover [49]. However, the crossover mechanism applied here is different from the normal single point crossover, in order to ensure that the off-springs generated after the crossover operation are valid solutions in terms of functional dependency.
Consider two parent chromosomes and selected to participate in a crossover. Also consider and are two subgraphs (i.e., phenotypes) of the dependency graph corresponding to and respectively.
The main intuition of this step is to randomly choose a common node between and at first and then exchange the set of nodes in and that are responsible to activate for both and . In this way we ensure to obtain functionally valid off-springs. We now formally demonstrate the crossover operation.
-
•
At first, the set of common nodes from and are identified. Out of them, one common node is chosen randomly.
-
•
For each of the subgraphs and , we compute the subgraphs containing all the paths from to of and containing all the paths from to of .
-
•
Finally, and are exchanged to generate two new off-springs and , where,
, where and does not belong to any path other than to in ;
, where and does not belong to any path other than to in ;
, where and does not belong to any path other than to in ;
, where and does not belong to any path other than to in .
Each off-spring is generated after scanning two subgraphs and once. For example, during the construction of , is traversed backward starting from . Once a node of is encountered, the node is copied in . For each node (other than ) in , all the nodes that provide at-least one input to in are copied in . Once the traversal of is done, the traversal of starts backward starting from . Similar to the previous, once a node of is encountered, the node is copied in . For each node in , all the nodes that provide at-least one input to in are copied in .
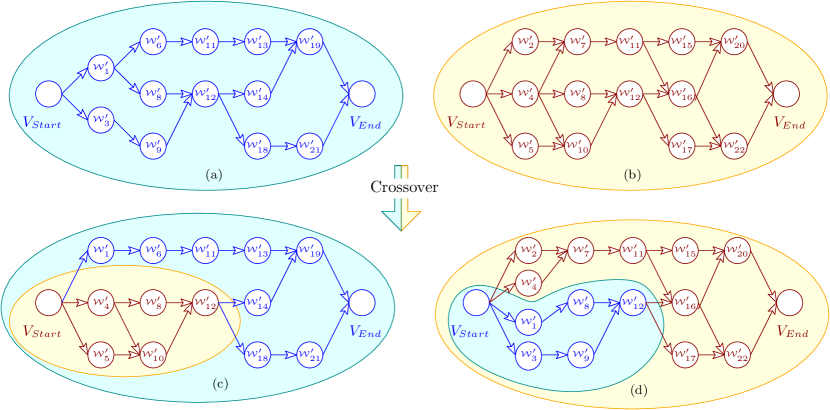
Example 7.2.
Consider two subgraphs of the dependency graph corresponding to two parent chromosomes as shown in Figure 7(a) and (b). The node corresponding to is chosen as the common node. Finally, the off-springs generated using the above procedure are shown in Figure 7(c) and (d).
7.4 Mutation
Mutation is a unary genetic operator used to obtain a chromosome from one generation to the next. Like crossover, mutation is also performed in a different way than normal mutation operation in our approach to ensure functional dependency preserving solutions are generated.
Consider a parent chromosome to participate in mutation. Also consider is the subgraph of the dependency graph corresponding to and is the mutation probability.
The intuition of this step is as follows. We traverse in backward. While traversing, with probability we choose a node to be mutated. If a node is selected instead of after mutation, we randomly generate the nodes that are needed to activate from the query inputs. In this manner, we ensure to obtain a functionally valid off-spring. We now formally discuss the mutation operation.
-
•
We start traversing backward starting from to generate a new off-spring . We first add in .
-
•
For each input of a node , if there is only one node in the dependency graph to produce as output, we add in and in .
-
•
For each input of a node , if and there exists multiple nodes in the dependency graph to produce as output, with probability we add in , where and produces as output. We also add in .
-
•
For each input of a node , if and there exists multiple nodes in the dependency graph to produce as output, with probability , we perform the following operation: we randomly choose a node from such that and produces . We add to and to .
-
•
For each input of a node , if , we randomly select a node that produces as output and add to and to .
-
•
Each node in is processed only once. In other words, if a node is encountered more than once, we do not reprocess the node.
-
•
The algorithm terminates when there is no node left for processing.
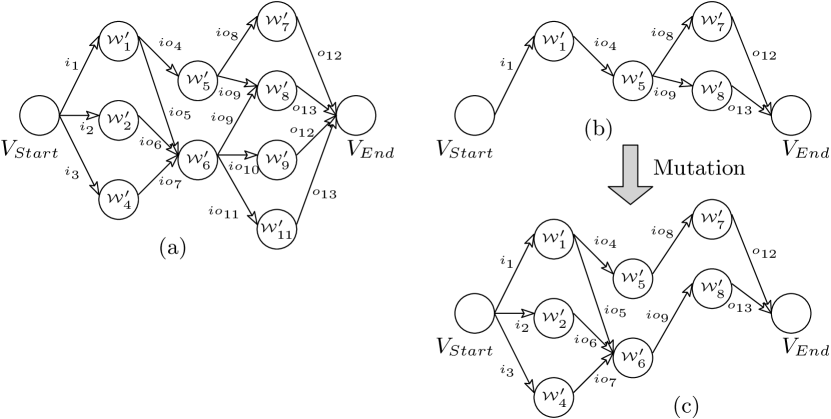
Example 7.3.
Consider the dependency graph shown in Figure 8(a) and the subgraph of the dependency graph corresponding to a chromosome shown in Figure 8(b). In the figure, for input of the node corresponding to , the mutation operation is performed. Finally, the off-spring generated using the above procedure is shown in 8(c).
7.5 Fitness function
In this section, we discuss the computation of the fitness function for each chromosome in the population. For each chromosome in the population, we first compute the QoS tuple. The chromosomes are then divided into different levels based on domination. A chromosome belongs to level , if there exists at-least one chromosome in each level , where , that dominates and no chromosome belonging to level , where dominates . For chromosomes belonging to the same level, we compute the crowding distance as illustrated in [22]. Crowding distance ensures solution diversity. This essentially measures how close the individual chromosome is from its neighbors with respect to each QoS parameter. Finally, the chromosomes are ranked as follows:
Between two chromosomes and , rank of is higher than the rank if or ( and ). The rank of a chromosome is treated as the fitness value of the chromosome. Less fitness value represents better solution quality.
When algorithm terminates, all the phenotypes corresponding to the chromosomes with level 0 are returned as the solutions. In the next section, we experimentally shows the comparative study of our approaches.
8 Experimental Results
We implemented our proposed framework in Java. Experiments were performed on an i3 processor with 4GB RAM. The algorithms were evaluated on the 19 public repositories of the ICEBE-2005 Web Service Challenge [23] and the 5 public repositories of the 2009-2010 Web Service Challenge (WSC 2009-10) [24] and the dataset demonstrated in [48]. The WSC 2009-10 dataset contains only the values of two QoS parameters (response time and throughput) for each service. Additionally, we randomly generated the values for reliability and availability for each service. However, the ICEBE-2005 dataset does not contain the value of any QoS parameter for the services. We randomly generated values of all 4 QoS parameters (response time, throughput, reliability and availability) for our experiments with the ICEBE-2005 dataset.
Configurations of our algorithms: No configuration parameter is required for the optimal algorithm. For our first heuristic approach, we varied the beam width from 100 to 500. Finally, we compare our first heuristic with [20] considering the beam width as 500. For our second heuristic algorithm, we chose the following configuration parameters: population size as 100, the mutation probability as 0.01 and crossover probability as 0.85 and the number of iterations as 10000.
| Beam Width | ||||||||||||
|---|---|---|---|---|---|---|---|---|---|---|---|---|
| Data Set | Case 1: 100 | Case 2: 300 | Case 3: 500 | |||||||||
| n | S | n | S | n | Computation Time (sec) | |||||||
| WSC-01 | 1 | 0.86 | 0.5 | 0.5 | 5.83 | 2 | 1 | 1 | 1 | 7.86 | 2 | 8 |
| WSC-02 | 2 | 1 | 1 | 1 | 8.69 | 2 | 1 | 1 | 1 | 9.32 | 2 | 11 |
| WSC-03 | 2 | 0.79 | 0.33 | 0.5 | 21.71 | 2 | 1 | 1 | 1 | 7.86 | 2 | 126 |
| WSC-04 | 2 | 0.93 | 0.4 | 0.4 | 29.74 | 3 | 0.81 | 0.33 | 0.4 | 18.86 | 5 | 397 |
| WSC-05 | 3 | 0.89 | 0.5 | 0.5 | 37.21 | 5 | 0.98 | 0.83 | 0.83 | 11.86 | 6 | 778 |
| Beam Width | ||||||||||||
| Data Set | Case 1: 100 | Case 2: 300 | Case 3: 500 | |||||||||
| n | S | n | S | n | Computation Time (sec) | |||||||
| Out Composition | 3 | 1 | 1 | 1 | 3.89 | 3 | 1 | 1 | 1 | 4.39 | 3 | 0.51 |
| Composition1-20-4 | 1 | 0.92 | 0.25 | 0.25 | 1.63 | 4 | 0.88 | 0.57 | 0.57 | 7.36 | 7 | 2 |
| Composition1-20-16 | 2 | 0.97 | 0.4 | 0.4 | 9.85 | 5 | 0.96 | 0.67 | 0.8 | 6.13 | 5 | 7 |
| Composition1-20-32 | 4 | 0.91 | 0.29 | 0.4 | 13.12 | 5 | 0.99 | 0.5 | 0.75 | 13.15 | 4 | 11 |
| Composition1-50-4 | 5 | 0.84 | 0.62 | 0.62 | 17.81 | 8 | 0.76 | 0.89 | 0.89 | 21.15 | 9 | 10 |
| Composition1-50-16 | 5 | 0.8 | 0.4 | 0.5 | 5.46 | 4 | 0.82 | 0.25 | 0.33 | 9.76 | 6 | 18 |
| Composition1-50-32 | 1 | 0.75 | 0.5 | 0.5 | 9.81 | 2 | 1 | 1 | 1 | 18.71 | 2 | 17 |
| Composition1-100-4 | 6 | 0.94 | 0.56 | 0.62 | 6.75 | 8 | 0.9 | 0.73 | 0.73 | 3.42 | 11 | 38 |
| Composition1-100-16 | 2 | 0.9 | 0.33 | 0.33 | 2.96 | 6 | 0.84 | 0.4 | 0.5 | 11.89 | 8 | 63 |
| Composition1-100-32 | 2 | 1 | 1 | 1 | 8.49 | 2 | 0.89 | 0.67 | 0.67 | 5.39 | 3 | 69 |
| Composition2-20-4 | 5 | 0.84 | 0.43 | 0.33 | 13.17 | 7 | 0.87 | 0.56 | 0.71 | 11.16 | 7 | 51 |
| Composition2-20-16 | 3 | 0.83 | 0.6 | 0.6 | 6.19 | 5 | 0.69 | 0.17 | 0.22 | 4.96 | 9 | 308 |
| Composition2-20-32 | 7 | 0.9 | 0.54 | 0.54 | 19.1 | 13 | 0.93 | 0.33 | 0.54 | 13.59 | 11 | 97 |
| Composition2-50-4 | 9 | 0.69 | 0.27 | 0.6 | 11.31 | 5 | 0.79 | 0 | 0 | 8.97 | 2 | 241 |
| Composition2-50-16 | 2 | 0.99 | 0.67 | 0.67 | 4.87 | 3 | 0.91 | 0.37 | 0.37 | 9.36 | 8 | 306 |
| Composition2-50-32 | 3 | 1 | 1 | 1 | 2.91 | 3 | 1 | 1 | 1 | 12.82 | 3 | 531 |
| Composition2-100-4 | 4 | 0.96 | 0.8 | 0.8 | 8.95 | 5 | 0.91 | 0.83 | 0.83 | 27.26 | 6 | 649 |
| Composition2-100-16 | 5 | 0.83 | 0.57 | 0.5 | 21.37 | 7 | 0.8 | 0.62 | 0.5 | 9.86 | 8 | 1339 |
| Composition2-100-32 | 2 | 0.91 | 0.33 | 0.33 | 36.59 | 6 | 0.77 | 0.22 | 0.4 | 3.59 | 5 | 1689 |
8.1 Different metrics to compare results
We use the following metrics to compare our results with other approaches in literature, as defined below.
-
•
: The cardinality of the solutions obtained from an algorithm.
-
•
Commonality Ratio : Given two sets of solution tuples and ,
-
•
Commonality Non Dominated Solution Ratio : Given two sets of solution tuples and ,
set of non dominated tuples obtained from ;
-
•
Average Distance Ratio : Given two sets of solution tuples and
is calculated as in Eq. 4 for all tuples in .
-
•
Speed up : Given two algorithms and ,
These metrics are used to compare the solutions obtained by two different algorithms or the same algorithm with different configurations. The average distance ratio metric shows the quality difference between two solutions. It may be noted, means provides better result than , while means provides better result than . The commonality ratio indicates how many tuples are common in two solutions, where as the commonality non dominated ratio shows how many non-dominated tuples are common.
8.2 Analysis on a synthetic dataset
We first analyze the performance of our proposed algorithms on a synthetic dataset demonstrated in [48]. Here we compare the performance of the heuristic methods with respect to the optimal one. The total number of services in the service repository was 567. We used the QWS [50] dataset to assign the QoS values to the services. The QWS dataset has 8 different QoS parameters and more than 2500 services. From the QWS dataset, we randomly selected 567 services and the corresponding QoS values were assigned to the services in our repository. After preprocessing, we had only 164 different services. The Pareto optimal algorithm with preprocessing achieved times speed up in comparison to the Pareto optimal algorithm without any preprocessing.
The number of solutions obtained by the Pareto optimal algorithm (), our first heuristic () and our second heuristic () are 7, 8, 7 respectively. While generated 6 non dominated tuples, generated 5 non dominated tuples common with the tuples generated by . Average distance ratio between and is 1.38, whereas, the average distance ratio between and is 1.63. Our first heuristic method with beam width 500 achieved times speed up in comparison to the Pareto optimal algorithm with preprocessing, whereas, our second heuristic method achieved times speed up in comparison to the Pareto optimal algorithm with preprocessing. It may be noted, though our first heuristic algorithm generated better quality result with respect to our second heuristic algorithm, however, the second one provided higher speed up than our first one.
8.3 Analysis on public datasets
We now show the experimental results obtained by our algorithm on ICEBE-2005 and WSC 2009-10.
8.3.1 Results of Preprocessing
Given a service repository as an input to our problem, we first present the details of the reduction obtained in the number of services after the preprocessing step in our methodology on the benchmark datasets. Table VII presents the summary on the ICEBE-2005 dataset. However, it is interesting to note that no reduction could be obtained for the WSC 2009-10 dataset, since the dataset does not contain any equivalent service.
| Data Set | Data Set | ||||
|---|---|---|---|---|---|
| Out Composition | 143 | 79 | Composition1-20-4 | 2156 | 2032 |
| Composition1-20-16 | 2156 | 2143 | Composition1-20-32 | 2156 | 2152 |
| Composition1-50-4 | 2656 | 2596 | Composition1-50-16 | 2656 | 2652 |
| Composition1-50-32 | 2656 | 2656 | Composition1-100-4 | 4156 | 4081 |
| Composition1-100-16 | 4156 | 4150 | Composition1-100-32 | 4156 | 4155 |
| Composition2-20-4 | 3356 | 3195 | Composition2-20-16 | 6712 | 6678 |
| Composition2-20-32 | 3356 | 3347 | Composition2-50-4 | 5356 | 5239 |
| Composition2-50-16 | 5356 | 5346 | Composition2-50-32 | 5356 | 5349 |
| Composition2-100-4 | 8356 | 8233 | Composition2-100-16 | 8356 | 8347 |
| Composition2-100-32 | 8356 | 8354 | |||
| and represent the number of services before and after preprocessing | |||||
8.3.2 Runtime performance analysis
We now analyze the performance of our heuristic algorithms and show the trade-off between computation time and solution quality. Tables V and VI show the comparative results obtained by the first heuristic algorithm () for WSC-2009 and ICEBE-2005 datasets respectively. We gradually increased the size of the beam width of the algorithm and generated the solution. We consider three different cases depending on the size of the beam width: 100, 300 and 500 respectively. The last column of Table V and VI present the computation time required by to generate the solution. We compare the results obtained by the algorithm in Case with the same in Case , for . For example, the results obtained by with beam width 100 is compared with the same with beam width 300. As we have already discussed in Section 4, as the beam size increases, either the solution quality remains same or improves. In this comparative study, we show the degradation of the solution quality when the beam size decreases in terms of , and .
Finally, we compare our heuristic algorithms with [20] which transforms the multiple objectives to a single objective to generate a single solution. In contrast, our method is able to generate the multiple non-dominated feasible solutions in a comparable time limit. Table VIII shows the speed up achieved by both the methods with respect to [20]. As is evident from Columns 2, 3, 5 and 6 of Table VIII that in some cases, we have achieved speed-up more than 1 in 15 and 14 cases for and respectively out of 23 cases, which implies our method performs better than the method in [20] in terms of computation time.
The Pareto optimal algorithm, being compute intensive, does not produce any result and encounters a memory out error on both the datasets, on our machine with 4GB RAM. We now show a comparative performance analysis for both the heuristic methods. Table IX shows the comparison between both the methods for the ICEBE-2005 and WSC-2009 datasets respectively. As evident from the tables, and generated the same results in 8 cases, generated better results than in 7 cases, while generated better results than in 9 cases. In 15 cases achieved more speed up than , while in 9 cases outperformed in terms of speed up. As evident from our result, both the heuristic performed well and achieved more speed-up.
| Dataset | Dataset | ||
| Composition1-20-4 | 0.90, 0.18 | Composition2-20-4 | 1.75, 2.54 |
| Composition1-20-16 | 1.09, 0.13 | Composition2-20-16 | 1.48, 1.72 |
| Composition1-20-32 | 0.78, 0.2 | Composition2-20-32 | 0.68, 0.85 |
| Composition1-50-4 | 1.51, 0.52 | Composition2-50-4 | 0.70, 0.38 |
| Composition1-50-16 | 0.68, 0.4 | Composition2-50-16 | 0.85, 2.83 |
| Composition1-50-32 | 1.03, 0.27 | Composition2-50-32 | 7.85, 11.06 |
| Composition1-100-4 | 0.57, 2.48 | Composition2-100-4 | 1.17, 0.6 |
| Composition1-100-16 | 8.85, 0.9 | Composition2-100-16 | 3.8, 7.04 |
| Composition1-100-32 | 3.55, 1.8 | Composition2-100-32 | 7.11, 13.67 |
| WSC-01 | 0.84, 1.3 | WSC-04 | 1.68, 0.45 |
| WSC-02 | 7.09, 3.97 | WSC-05 | 5.57, 1.67 |
| WSC-03 | 11.11, 3.88 | ||
| [20] , [20] | |||
| Dataset | n | Speed-up | |||
| Out Composition | (3, 4) | 0.96 | 1 | (0.23, 0.39) | 1.86 |
| Composition1-20-4 | (7, 2) | 2.56 | 0.59 | (0.81, 0.69) | 4.93 |
| Composition1-20-16 | (5, 9) | 1.71 | 0.63 | (0.9, 0.58) | 0.69 |
| Composition1-20-32 | (4, 4) | 1 | 1 | (1,1) | 8.61 |
| Composition1-50-4 | (9, 7) | 0.82 | 0.67 | (0.91, 0.96) | 0.86 |
| Composition1-50-16 | (6, 5) | 1.92 | 0.33 | (0.68, 0.57) | 3.91 |
| Composition1-50-32 | (2, 2) | 1 | 1 | (1,1) | 0.8 |
| Composition1-100-4 | (11, 11) | 1 | 1 | (1,1) | 2.93 |
| Composition1-100-16 | (8, 6) | 0.9 | 0.67 | (0.33, 0.33) | 1.85 |
| Composition1-100-32 | (3, 3) | 1 | 1 | (1,1) | 1.68 |
| Composition2-20-4 | (7, 9) | 0.69 | 0.42 | (0.72, 0.96) | 0.3 |
| Composition2-20-16 | (9, 6) | 0.91 | 0.85 | (0.63, 0.76) | 3.86 |
| Composition2-20-32 | (11,9) | 0.68 | 0.98 | (0.61, 0.8) | 0.71 |
| Composition2-50-4 | (2, 5) | 3.93 | 0.67 | (0.85, 0.35) | 0.23 |
| Composition2-50-16 | (8, 11) | 2.91 | 0.35 | (0.96, 0.62) | 1.96 |
| Composition2-50-32 | (3, 7) | 0.86 | 0.85 | (0.65, 0.5) | 9.8 |
| Composition2-100-4 | (6, 6) | 1 | 1 | (1,1) | 0.54 |
| Composition2-100-16 | (8, 6) | 0.8 | 0.69 | (0.85, 0.92) | 1.97 |
| Composition2-100-32 | (5, 4) | 1.93 | 0.71 | (0.96, 0.81) | 0.52 |
| WSC-01 | (2, 2) | 1 | 1 | (1, 1) | 0.63 |
| WSC-02 | (2, 2) | 1 | 1 | (1, 1) | 1.79 |
| WSC-03 | (2, 2) | 1 | 1 | (1, 1) | 2.86 |
| WSC-04 | (5, 6) | 0.92 | 0.83 | (0.83, 1) | 3.71 |
| WSC-05 | (6, 4) | 1.87 | 0.27 | (0.8, 0.6) | 3.33 |
| , ( | |||||
| , is written as , | |||||
9 Conclusion and future directions
This paper addresses the problem of multi-constrained multi-objective service composition in IOM based on the Pareto front construction. Experimental results on real benchmarks show the effectiveness of our proposal. We believe that our work will open up a lot of new research directions in the general paradigm of multi-objective service composition. Going forward, we wish to come up with a theoretical bound on the solution quality degradation of our heuristic algorithms.
References
- [1] J. El Haddad et al., “Tqos: Transactional and qos-aware selection algorithm for automatic web service composition,” TSC, vol. 3, no. 1, pp. 73–85, 2010.
- [2] S.-C. Oh et al., “Effective web service composition in diverse and large-scale service networks,” TSC, vol. 1, no. 1, pp. 15–32, 2008.
- [3] L. Zeng et al., “Quality driven web services composition,” in WWW. ACM, 2003, pp. 411–421.
- [4] C. Jatoth et al., “Computational intelligence based qos-aware web service composition: A systematic literature review,” TSC, vol. PP, no. 99, pp. 1–1, 2015.
- [5] P. Bartalos and M. Bieliková, “Automatic dynamic web service composition: A survey and problem formalization,” Computing and Informatics, vol. 30, no. 4, pp. 793–827, 2012.
- [6] J. Peer, “Web service composition as ai planning-a survey,” University of St. Gallen, 2005.
- [7] P. Rodriguez-Mier et al., “Hybrid optimization algorithm for large-scale qos-aware service composition,” TSC, 2015.
- [8] ——, “Automatic web service composition with a heuristic-based search algorithm,” in ICWS, 2011, pp. 81–88.
- [9] M. Alrifai et al., “A hybrid approach for efficient web service composition with end-to-end qos constraints,” ACM TWEB, vol. 6, no. 2, p. 7, 2012.
- [10] R. Aggarwal et al., “Constraint driven web service composition in meteor-s,” in SCC, 2004, pp. 23–30.
- [11] I. Guidara et al., “Heuristic based time-aware service selection approach,” in ICWS. IEEE, 2015, pp. 65–72.
- [12] L. Qi et al., “Combining local optimization and enumeration for qos-aware web service composition,” in ICWS. IEEE, 2010, pp. 34–41.
- [13] C. Ba, “An exact cover-based approach for service composition,” in ICWS. IEEE, 2016, pp. 631–636.
- [14] S. Zhang et al., “Selecting top-k composite web services using preference-aware dominance relationship,” in ICWS, 2013, pp. 75–82.
- [15] X. Feng et al., “A model for service composition with multiple qos constraints,” in ICCTA. IEEE, 2007, pp. 208–213.
- [16] J. Hu et al., “Quality driven web services selection,” in ICEBE. IEEE, 2005, pp. 681–688.
- [17] Y. Chen et al., “A partial selection methodology for efficient qos-aware service composition,” TSC, vol. 8, no. 3, pp. 384–397, 2015.
- [18] F. N. Abu-Khzam, C. Bazgan, J. El Haddad, and F. Sikora, “On the complexity of qos-aware service selection problem,” in ICSOC. Springer, 2015, pp. 345–352.
- [19] M. Alrifai et al., “Selecting skyline services for qos-based web service composition,” in WWW, 2010, pp. 11–20.
- [20] Y. Yan et al., “Anytime qos optimization over the plangraph for web service composition,” in SAC, 2012, pp. 1968–1975.
- [21] S. Russell et al., “A modern approach,” Artificial Intelligence. Prentice-Hall, Egnlewood Cliffs, vol. 25, 1995.
- [22] K. Deb, A. Pratap, S. Agarwal, and T. Meyarivan, “A fast and elitist multiobjective genetic algorithm: Nsga-ii,” IEEE TEC, vol. 6, no. 2, pp. 182–197, 2002.
- [23] K. S. et al., “The web services challenge,” in ICEBE, 2005. [Online]. Available: http://www.comp.hkbu.edu.hk/simctr/wschallenge/
- [24] S. Kona et al., “Wsc-2009: a quality of service-oriented web services challenge,” in IEEE ICCEC, 2009.
- [25] Y. Yan and M. Chen, “Anytime qos-aware service composition over the graphplan,” Springer SOCA, vol. 9, no. 1, pp. 1–19, 2015.
- [26] Y. Wu et al., “A multilevel index model to expedite web service discovery and composition in large-scale service repositories,” TSC, vol. 9, no. 3, pp. 330–342, 2016.
- [27] S.-Y. Hwang et al., “Dynamic web service selection for reliable web service composition,” TSC, vol. 1, no. 2, pp. 104–116, 2008.
- [28] S. Chattopadhyay et al., “A scalable and approximate mechanism for web service composition,” in ICWS. IEEE, 2015, pp. 9–16.
- [29] Y.-M. Xia et al., “Web service composition integrating qos optimization and redundancy removal,” in ICWS, 2013, pp. 203–210.
- [30] M. Chen and Y. Yan, “Qos-aware service composition over graphplan through graph reachability,” in SCC. IEEE, 2014, pp. 544–551.
- [31] A. Mostafa and M. Zhang, “Multi-objective service composition in uncertain environments,” TSC, vol. PP, no. 99, pp. 1–1, 2015.
- [32] F. Wagner et al., “Qos-aware automatic service composition by applying functional clustering,” in ICWS. IEEE, 2011, pp. 89–96.
- [33] S. Chattopadhyay, A. Banerjee, and N. Banerjee, “A fast and scalable mechanism for web service composition,” TWEB, vol. 11, no. 4, pp. 26:1–26:36, 2017.
- [34] M. Alrifai et al., “Combining global optimization with local selection for efficient qos-aware service composition,” in WWW, 2009, pp. 881–890.
- [35] S. Chattopadhyay and A. Banerjee, “QSCAS: qos aware web service composition algorithms with stochastic parameters,” in ICWS, 2016, pp. 388–395.
- [36] H. Cao et al., “A service selection model with multiple qos constraints on the mmkp,” in NPC Workshops. IEEE, 2007, pp. 584–589.
- [37] D. Schuller et al., “Cost-driven optimization of complex service-based workflows for stochastic qos parameters,” in ICWS, 2012, pp. 66–73.
- [38] I. Trummer et al., “Multi-objective quality-driven service selection—a fully polynomial time approximation scheme,” IEEE TSE, vol. 40, no. 2, pp. 167–191, 2014.
- [39] M. Cremene et al., “Comparative analysis of multi-objective evolutionary algorithms for qos-aware web service composition,” Applied Soft Computing, vol. 39, pp. 124–139, 2016.
- [40] L. Li et al., “Applying multi-objective evolutionary algorithms to qos-aware web service composition,” in ADMA, 2010, pp. 270–281.
- [41] J. Liao et al., “A multi-objective service selection algorithm for service composition,” in APCC. IEEE, 2013, pp. 75–80.
- [42] Z. Shanshan et al., “An improved ant colony optimization algorithm for qos-aware dynamic web service composition,” in ICICEE. IEEE, 2012, pp. 1998–2001.
- [43] R. Liu et al., “Parameter tuning for abc-based service composition with end-to-end qos constraints,” in ICWS, 2014, pp. 590–597.
- [44] Z. Zhang et al., “Genetic algorithm for context-aware service composition based on context space model,” in ICWS, 2013, pp. 605–606.
- [45] J. Wang and Y. Hou, “Optimal web service selection based on multi-objective genetic algorithm,” in ISCID, vol. 1, 2008, pp. 553–556.
- [46] K. Hashmi et al., “Automated web service quality component negotiation using nsga-2,” in AICCSA. IEEE, 2013, pp. 1–6.
- [47] F. Wagner et al., “Multi-objective service composition with time-and input-dependent qos,” in ICWS. IEEE, 2012, pp. 234–241.
- [48] S. Chattopadhyay and A. Banerjee, “Qos constrained large scale web service composition using abstraction refinement,” IEEE TSC, vol. PP, no. 99, pp. 1–1, 2017.
- [49] M. Srinivas and L. M. Patnaik, “Genetic algorithms: A survey,” computer, vol. 27, no. 6, pp. 17–26, 1994.
- [50] E. Al-Masri and Q. H. Mahmoud, “Discovering the best web service,” in WWW. ACM, 2007, pp. 1257–1258.
Lemma 7.
The preprocessing step is Pareto optimal solution preserving in terms of QoS values.
Proof.
We prove the above lemma by contradiction. Consider a solution to a query is lost due to preprocessing. We show either of the following two conditions must hold:
-
•
A solution to the query , generated after preprocessing, dominates .
-
•
A solution to the query , generated after preprocessing, has exactly the same QoS tuple as .
We first assume that none of the above conditions hold for . Since is lost due to preprocessing, there must exist a solution consisting of at least one service , which is removed during preprocessing. This further implies, presence of another service , belonging to the same cluster as , such that dominates . We now analyze different cases for different aggregation functions for different QoS parameters. Consider a QoS parameter with aggregation function .
If is a positive QoS, . If , , where denotes the values of for the set of services with which is combined in . We, therefore, consider the cases where .
-
•
is addition: .
-
•
is product: .
-
•
is maximum:
-
–
If ,
. -
–
If ,
. -
–
If and ,
.
Therefore, .
-
–
-
•
is minimum:
-
–
If and ,
. -
–
If ,
.
Therefore, .
-
–
Using a similar argument, it can be shown that the above lemma also holds for any negative QoS parameter. Therefore, the solution consisting of is at least as good as the solution consisting of , which contradicts our assumption. ∎
Lemma 8.
Each path from to in represents a solution to the query in terms of functional dependencies.
Proof.
The proof of the lemma follows from the construction of . Consider a path of . The services corresponding to are directly activated by the query inputs, while the services corresponding to are activated by outputs of the services corresponding to . Similarly, the services corresponding to for are activated by the outputs of the services corresponding to . Finally, the services corresponding to produce the query outputs. Therefore, the services associated with the path forms a composition solution in terms of functional dependency. ∎
Lemma 9.
Algorithm 4 is complete.
Proof.
In order to prove the completeness of Algorithm 4, we show Algorithm 4 generates all distinct feasible solutions in terms of QoS values belonging to the Pareto front in response to a query . We prove the above lemma by contradiction. We first assume that a unique (in terms of QoS values) feasible solution belonging to the Pareto front is not generated by Algorithm 4. This implies, one of the following condition holds:
-
•
Case 1: cannot be generated through any path of , even if no tuple or node is removed during solution construction.
-
•
Case 2: is removed while constructing the set of non dominated tuples corresponding to a node in .
-
•
Case 3: is removed while constructing the cumulative Pareto optimal solution till a node .
Since we have already proved in Lemma 1 that the preprocessing step is Pareto optimal solution preserving in terms of QoS values, we can now assume that consists of the services in . We now analyze each case separately below.
Consider Case 1. Below, we prove that Case 1 cannot be true by the following argument. While constructing the set of predecessor nodes of a node , we consider all possible combinations of nodes in which can activate the nodes corresponding to . Consider the subgraph of corresponding to the solution and the partition into multiple layers as defined by Equations 1 and 2. The last layer (say ) of consists of . Consider each layer , for in consists of a set of nodes . It may be noted, the set of services corresponding to in produce the query outputs. consists of . While constructing the set of predecessor nodes of , since all possible combinations of nodes in which can activate are considered, is also considered. Therefore, a node must correspond to . In general, corresponds to . Since all possible combinations of nodes in which can activate are considered while constructing the set of predecessor nodes of , is also considered. Hence, a path corresponding to belongs to , which contradicts our assumption.
We now consider Case 2. Consider consists of of . The services corresponding to are executed in parallel. It may be noted, each service corresponding to may be associated with more than one QoS tuple. Therefore, after composition, more than one tuple is generated. We consider only the set of non dominated tuples from the set of generated tuples . If is removed due to removal of , this implies consists of one QoS tuple . This further implies, another tuple must dominate . By a similar argument, as in the proof of Lemma 1, we can say another solution generated by Algorithm 4 either has exactly the same QoS tuple as , which implies is not unique, or dominates , which contradicts our assumption. The argument of Case 3 is same as in Case 2. Therefore, none of the above cases hold, which contradicts our assumption. Thus Algorithm 4 is complete. ∎
Lemma 10.
Algorithm 4 is sound.
Proof.
In order to prove the soundness of Algorithm 4, we need to show each solution , generated by Algorithm 4 in response to a query , is a feasible solution and belongs to the Pareto front. If is generated by Algorithm 4, it must be a feasible solution, as it is ensured by Steps 18-20 of Algorithm 4. We now prove by contradiction that belongs to the Pareto front. We first assume does not belong to the Pareto front. This implies, there exists another solution which dominates . However, being complete, Algorithm 4 generates all the feasible solutions belonging to the Pareto front. Therefore, Algorithm 4 generates as one of the solutions. Therefore, cannot be generated by Algorithm 4, since dominates , which contradicts our assumption. Thus, Algorithm 4 is sound. ∎
Lemma 11.
The solution quality of the heuristic algorithm monotonically improves with increase in beam width.
Proof.
The heuristic algorithm uses Algorithm 4 to generate the solutions from the reduced search space. Therefore, the solutions generated by this algorithm is the feasible Pareto optimal solutions obtained from the reduced search space according to Lemma 3 and 4. Moreover the search space required by the heuristic algorithm with beam width equals to subsumes the search space required by the heuristic algorithm with beam width equals to , where . Therefore, with the increase in beam width, the solution quality of the heuristic algorithm monotonically improves. ∎