A Morphological Study of the Supernova Remnant RX J0852.0–4622 (Vela Jr.)
Abstract
We conduct a multi-wavelength morphological study of the Galactic supernova remnant RX J0852.0–4622 (also known as Vela Jr., Vela Z and G266.21.2). RX J0852.0–4622 is coincident with the edge of the larger Vela supernova remnant causing confusion in the attribution of some filamentary structures to either RX J0852.0–4622 or its larger sibling. We find that the RX J0852.0–4622 radio continuum emission can be characterised by a 2-dimensional shell with a radius of 0.900.01∘ (or 11.80.6 pc at an assumed distance of 750 pc) centred at (l,b)=(133.08∘ ,46.34 ) (or RA=8h 52m 19.2 s, Dec=46∘20′24.0′′, J2000), consistent with X-ray and gamma-ray emission. Although [OIII] emission features are generally associated with the Vela SNR, one particular [OIII] emission feature, which we denote as “the Vela Claw”, morphologically matches a molecular clump that is thought to have been stripped by the stellar progenitor of the RX J0852.0–4622 SNR. We argue that the Vela Claw feature is possibly associated with RX J0852.0–4622. Towards the north-western edge of RX J0852.0–4622, we find a flattening of the radio spectral index towards another molecular clump also thought to be associated with RX J0852.0–4622. It is currently unclear whether this feature and the Vela Claw result from interactions between the RX J0852.0–4622 shock and the ISM.
1 Introduction
The Galactic supernova remnant (SNR) RX J0852.0–4622 was first discovered in 1998 (Aschenbach, 1998), and studies of a tenuous detection of the radioactive decay line of 44Ti suggested RX J0852.0–4622 to be young (680 yr) and nearby (200 pc) (Iyudin et al., 1998). The 44Ti detection was and remains controversial (Renaud et al., 2006). More recent studies estimate ages of 1 to 3 kyr and 2.4 to 5.1 kyr (Katsuda et al., 2009; Allen et al., 2015, respectively), with distances of 700 pc (200 pc). A new relevance for this object came to light when HESS observations at TeV energies (HESS J10852463, Aharonian et al., 2005, 2007; H.E.S.S. Collaboration et al., 2018) revealed that RX J0852.0–4622 is in fact a member of a class of gamma-ray SNRs that have a shell-type morphology resolved at gamma-ray energies. This reinforced the SNR’s status as a key object for the study of TeV cosmic-ray (CR) acceleration, which was first suggested by the presence of TeV electron acceleration (Slane et al., 2001).
A key candidate production mechanism for the gamma-ray shell of RX J0852.0–4622 is neutral pion production via CR interactions with gas and subsequent pion-decay (Aharonian et al., 2005, 2007; H.E.S.S. Collaboration et al., 2018). Indeed, Fermi-LAT GeV gamma-ray observations (Tanaka et al., 2011) reveal a spectrum that is compatible with cosmic-ray acceleration, but current spectral studies cannot distinguish this scenario from one where the gamma-rays are generated by a high energy electron population (H.E.S.S. Collaboration et al., 2018), even if the spectral model is fitted to a broad wavelength range (e.g. radio continuum data from Stupar et al., 2005).
Since neutral pion production requires the interaction of CRs with gas, attempts to identify associated gas clouds may hold the key to understanding the nature of the RX J0852.0–4622. Recent work by Fukui et al. (2017) has successfully identified a void in atomic gas that has a near-perfect spatial match with RX J0852.0–4622, likely implying a core-collapse progenitor wind-blown bubble (see Section 3.3).
Slane et al. (2001) had previously noted that RX J0852.0–4622 was most likely a core collapse event, although no compact object has been conclusively associated for RX J0852.0–4622. A coincident gamma-ray emitting Pulsar Wind Nebula (PWN), PSR J08554644, was identified in the south-east (Acero et al., 2013), but it is believed to be unrelated despite having a compatible distance. A central X-ray source CXOU J085201.4461753 at 1 kpc was investigated as an association (e.g. Kargaltsev et al., 2002). Reynoso et al. (2006) concluded that the object was likely unassociated with RX J0852.0–4622, instead favouring a planetary nebula counterpart for the compact object.
Molecular gas clumps pervade the SNR boundary (Fukui et al., 2017) in a scenario where the progenitor star is argued to be associated with evaporating gaseous globules, and mirroring the molecular clumps of sister SNR, RX J1713.73946, which are well-studied in literature (e.g. Fukui et al., 2003; Sano et al., 2010; Maxted et al., 2012, 2013; Fukui et al., 2012). Fukui et al. (2017) find that the gamma-ray distribution traces the gas distribution, which is strong evidence for a significant hadronic gamma-ray component in the RX J0852.0–4622 gamma-ray emission.111An alternative view is suggested by Sushch et al. (2018) - leptonic gamma-ray emission would also exhibit a gas-gamma-ray correlation if electron-injection becomes more efficient in parts of the SNR shock moving through high gas densities. Regardless, the kinematic distance solution would likely remain valid independent of gamma-ray mechanism. With the newly-proposed RX J0852.0–4622 gas association, the time is right to test this scenario using new and archival multi-wavelength data-sets.
1.1 The Vela SNR
The Vela SNR is larger and overlaps RX J0852.0–4622, leading to the alternate names for RX J0852.0–4622 - Vela Jr. and Vela Z (in addition to G266.21.2). The PWN PSR J08554644 emits at TeV energies, but the Vela SNR itself has not been detected in HESS gamma-ray images. It follows that the Vela SNR is not an object considered for the study of TeV CR acceleration. Nevertheless, the SNR may create some radio continuum structures within the RX J0852.0–4622 shell that may cause confusion.
The Vela SNR is foreground to Vela Jr at a distance of 250-350 pc (e.g. Cha et al., 1999; Dubner et al., 1998; Caraveo et al., 2001). The best distance estimate probably comes from parallax measurements of the associated Central Compact Object (CCO), the Vela pulsar, at 287 pc (Dodson et al., 2003). The corresponding spin-down age (Reichley et al., 1970) of 11.4 kyr is in agreement with the age of 189 kyr, derived from the angular separation between the Vela pulsar and the Vela SNR centroid (as indicated by ‘explosion fragments’) given its measured proper motion (Aschenbach et al., 1995).
Sushch et al. (2011) proposed that the evolution of Vela SNR took place inside the wind-blown bubble of the Wolf-Rayet star, Velorum. The model put the Vela SNR at the east-north-eastern side of the bubble, with interactions taking place on the foreground side of the bubble. The resulting density difference between the shock component expanding into the bubble and the shock component expanding into the stellar bubble boundary might account for the asymmetry of the Vela SNR shell (Sushch et al., 2011). Kim et al. (2012) found this model to be consistent with the discovery of FUV filaments along regions proposed to have a higher density. The authors also noted the possible first detection of Vela Jr at FUV wavelengths through the examination of atomic line ratios (primarily OIII]/OIV] and OIII]/CIV]) that are more indicative of non-radiative shocks than other parts of the Vela SNR shell. The implication is that Vela Jr, which has non-radiative shocks, may be responsible for a component of oxygen ion emission seen by Miller (1973) or Nichols & Slavin (2004). This is despite low-ionisation oxygen emission generally being associated with cooling in post-shocked gas associated with older radiative shocks.
While Vela Jr generally exhibits shock speeds of 3000 kms-1 (Katsuda et al., 2009), the measured velocity of the foreground Vela SNR shock front ranges between 100 and 280 kms-1 (Cox, 1972; Raymond et al., 1991; Jenkins & Wallerstein, 1995; Bocchino et al., 1999; Cha & Sembach, 2000; Bocchino et al., 2000; Pakhomov et al., 2012), while so-called ‘explosion fragments’ exhibit velocities of 660-1020 kms-1 (Aschenbach et al., 1995; Sushch et al., 2011). Redman et al. (2000) find optical [SII] emission from one such fragment, RCW 37. The large associated speed and temperature lead the authors to suggest that Vela Jr may be responsible for the fragment feature. This is in contrast to the majority of filamentary structures seen in optical atomic and ionic emission lines in the region. Emission lines such as [OIII] have been attributed to the cooling of low-density shock-heated regions associated with shock speeds of 100 kms-1 in the Vela SNR (e.g. Raymond et al., 1997; Sankrit et al., 2003).222We note that such emission is also characteristic of the similar-speed shocks of Herbig-Haro objects (e.g. Schwartz, 1978; Hartigan et al., 1987). UV emission of higher transition emission lines are attributed to faster components (150-170 kms-1) within the Vela SNR shock (e.g. Raymond et al., 1981; Slavin et al., 2004; Nichols & Slavin, 2004; Sankrit et al., 2003; Kim et al., 2012).
We conduct a morphological investigation using radio-continuum data (including radio spectral index), HI, CO, H, [SII], [OIII], UV, X-ray and gamma-ray emission. We attempt to attribute components within the RX J0852.0–4622 field of view to either RX J0852.0–4622 (i.e. Vela Jr) or the overlapping Vela SNR.
1.2 An Expanded History of RX J0852.0–4622
First imaged in X-rays by the ROSAT all-sky survey, RX J0852.0–4622 (i.e. Vela Jr) was initially apparent at E1.3 keV (Aschenbach, 1998). Before this X-ray discovery there were no reports of a radio SNR coincident with RX J0852.0–4622 although many Vela and Galactic Plane surveys covered the area. Duncan et al. (1996) and Bock et al. (1998) surveyed the SNR region with both the Parkes radio telescope and the Molonglo Observatory Synthesis Telescope (MOST) at 2420 MHz and 843 MHz, respectively. Before this time, the Parkes-MIT-NRAO (PMN) survey (Griffith & Wright, 1993) covered the area containing RX J0852.0–4622 at 4850 MHz, and a candidate non-thermal source coinciding with the north-eastern limb of RX J0852.0–4622 was identified at 408 MHz as long ago as 1968 (Milne, 1968).
Combi et al. (1999) presented a reanalysis of 2420 MHz data and a low angular resolution (30′) detection of Vela Jr at 1420 MHz in light of its discovery overlapping the Vela SNR at keV wavelengths. The authors concluded that the overall spectral index is which is flatter than expected for young SNRs (typically )333where . Follow-up observations (Duncan & Green, 2000) measured spectral index () for RX J0852.0–4622 that are consistently flatter than similar age SNRs in the Milky Way and Magellanic Clouds (MCs, Bozzetto et al., 2017).
Filipović et al. (2001) showed that the structure of RX J0852.0–4622 is shell-like (barrel-shaped/bilateral) with good correlation between radio-continuum, EUV and ROSAT PSPC X-ray emission. The radio-continuum emission coinciding with X-rays confirmed that synchrotron radiation is responsible for the north brightened X-ray limb (Bamba et al., 2005; Pannuti et al., 2010).
Stupar et al. (2005) presented a multi-frequency radio-continuum study of RX J0852.0–4622 based on low-resolution mosaic observations with the Australia Telescope Compact Array (ATCA) radio interferometer at 1384 and 2496 MHz, Parkes 4850 MHz and MOST 843 MHz survey data. They determined the radio spectral index for several prominent features of this SNR and found a sudden spectral turn over at 1384 MHz, but based on a closer inspection of the data leading to this turnover feature, we argue that observational shortcomings put the existence of this feature in doubt. This is due to the lack of short spacings within the array configuration used. In response to this, as part of this investigation we present new spectral index data towards RX J0852.0–4622.
2 Observational data
Various observations have been carried out on RX J0852.0–4622 over a period of 15 years. According to literature, RX J0852.0–4622 is centred at RA(J2000) = and DEC(J2000) = –46∘22′ (Aschenbach, 1998) which is within the bounds of the larger, Vela SNR. In this study, we highlight GHz radio continuum, optical emission line and ultraviolet (UV) data.
2.1 ATCA Radio Continuum
The Australia Telescope Compact Array (ATCA) is an array of six 23 m dishes in Narrabri, New South Wales in Australia. The observations that were analysed in this study were obtained from the ATNF online archive – ATOA444http://atoa.atnf.csiro.au/. A list containing the observations that were analysed, which span the frequency range between 1384 and 2868 MHz, are displayed in Table 1.
| Project | Dates | Array | Bandwidth | Channels | |
|---|---|---|---|---|---|
| Code | (MHz) | (MHz) | |||
| C789 | 14-15 Nov 1999 | 210 | 2496 | 128 | 33 |
| C2449 | 26-27 Feb 2011 | EW352 | 2100 | 2048 | 2049 |
| C2449 | 29-30 Mar 2011 | EW367 | 2100 | 2048 | 2049 |
ATCA data from 1999 were taken as part of the Southern Galactic Plane Survey (SGPS, McClure-Griffiths et al., 2005) and had full coverage of the the RX J0852.0–4622 shell, while more recent measurements from 2011 were from a campaign targeting HI emission in the SNRs south-west (Fukui et al., 2017). The latter observations were comprised of 43 pointings taken in mosaic mode and arranged in a hexagonal grid that covers approximately half of the SNR. The introduction of the Compact Array Broadband Backend system (CABB, Wilson et al., 2011) to ATCA provided a factor 16 increase in the observing bandwidth compared to earlier observations of RX J0852.0–4622 (Stupar et al., 2005; Pannuti et al., 2010). From 2128 MHz to 22048 MHz IF bands, the addition of 16 zoom windows significantly improved the RMS noise and therefore detections of features of this SNR. With the added bandwidth and functionality from the inclusion of CABB, separate spectral line observations can be made using CABBs zoom band mode. This allowed for observations of both continuum and spectral lines simultaneously from 2011 onwards. These data were taken with an increased image-size for each pointing, facilitating effective image cleaning techniques (e.g. ‘Peeling’, as described in Hughes et al., 2006; Crawford et al., 2011).
The properties of each image examined in this analysis can be found in Table 2. Figure 1 indicates the coverage of the 1999 and 2011 ATCA observation campaigns. Images were processed using the MIRIAD555http://www.atnf.csiro.au/computing/software/miriad/ software package (Sault et al., 1995). Frequencies range between 1332 MHz and 2868 MHz and typical RMS noise levels are 1 mJy/beam.
| Project | Frequency | Bandwidth | Pixel Size | Beam Size | Position Angle | RMS | |
|---|---|---|---|---|---|---|---|
| Code | (MHz) | (MHz) | (arcsec) | (arcsec) | (degrees) | (mJy/beam) | |
| C789 | 1384 | 128 | 51.4 | 247.6 179.4 | 60.4 | 1.5 | |
| C789 | 2496 | 128 | 28.9 | 118.8 89.0 | 55.4 | 1.0 | |
| C2449 | 1332 | 512 | 27.2 | 120.4 99.0 | 7.3 | 1.0 | |
| C2449 | 2100 | 2048 | 14.1 | 80.8 69.0 | 7.7 | 0.4 | |
| C2449 | 1844 | 512 | 20.3 | 91.6 77.4 | 1.9 | 1.0 | |
| C2449 | 2356 | 512 | 16.3 | 71.9 61.5 | 10.9 | 1.0 | |
| C2449 | 2868 | 512 | 14.1 | 59.5 50.0 | 8.7 | 1.0 |
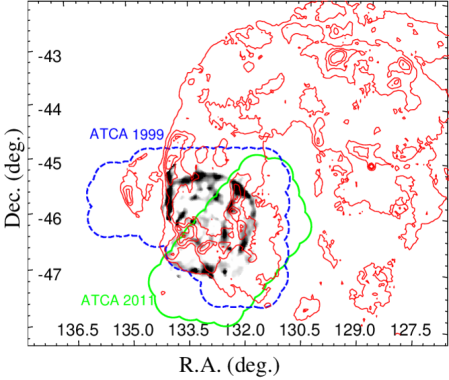
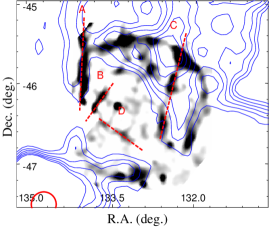
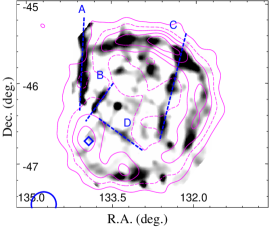
Figure 2 shows a final a noise-weighted combination of the 1999 and 2011 ATCA radio continuum data-sets (project codes C789 and C2449) spanning frequency bands between 1332 to 2868 MHz. The image largely replicates features observed in images by Stupar et al. (2005) and was produced to encapsulate the morphological features seen in individual images. The very bright, radio-loud H ii region outside of the Vela Jr field, RCW 38, produced large side lobes, so image boundaries were cropped prior to merging and data-sets were normalised to ensure that morphological features were continuous. The final image, which encompasses 320∘ of the azimuthal angle of the SNR radio shell, is displayed in Figure 2. This image has limitations in coverage in the South-East and in the interpretation of flux, but can clearly illustrate filaments discussed in Section 3.2, so is ideal for morphological studies.
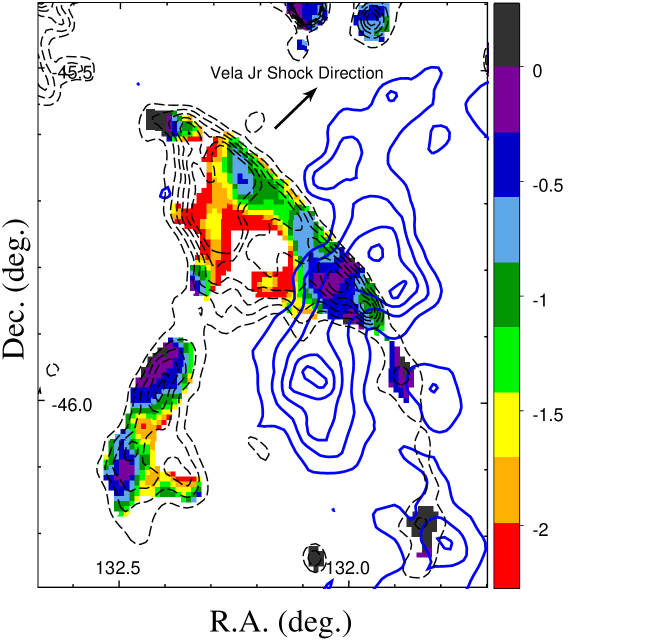
In addition to intensity images, we also present a radio spectral index map of RX J0852.0–4622 in Figure 3. The 1999 and 2011 data were examined independently, but only the 2011 results are displayed. The array configuration used to take the 1999 data lacked short-spacings and systematic effects were introduced into the corresponding spectral index map.
2.2 Optical Data
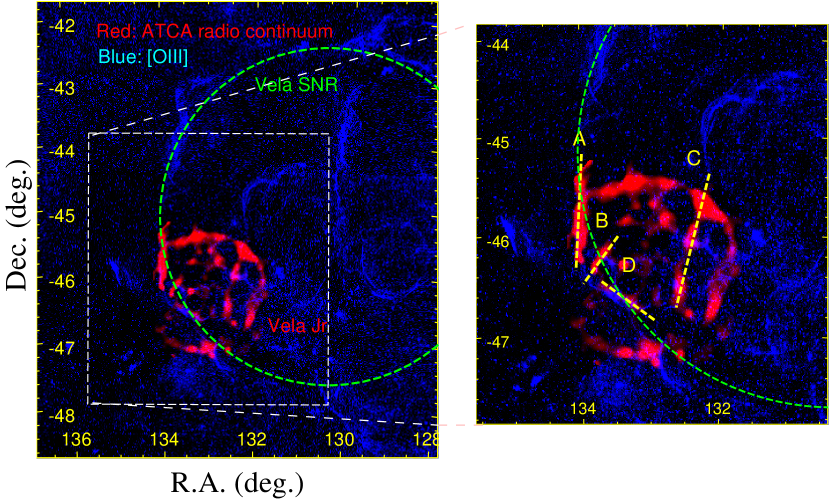
This study utilises measurements from the Australia National University 16 inch Boller & Chivens Telescope666http://rsaa.anu.edu.au/observatories/telescopes/anu-16-inch-boller-chivens-telescope in February 1999 (Filipović et al., 2001). Filters targeted the doublet [OIII], H and doublet [SII] transitions at 4861.3/5006.9, 6562.8 and 6718.3/6732.7 Å, respectively, over an exposure time of 600 seconds. We display [OIII] emission in Figure 4.
2.3 UV Data
58-174 Å UV images from the Extreme Ultraviolet Explorer (Welsh, 1990) are displayed in Figure 5. UV data was collected using 2 Wolter-Schwarzschild Type I grazing incidence mirrors with a microchannel plate detector777https://heasarc.gsfc.nasa.gov/docs/euve/euve.html. The average exposure across the Galaxy is generally greater than 500 s.
The data was taken between 1991 and 1993 (Edelstein et al., 1993) and was utilised in previous studies by Filipović et al. (2001). The data have a natural angular resolution of 66′, and was smoothed to 10′ resolution.
2.4 Spectral CO and HI data
Fukui et al. (2017) presented an analysis of the interstellar medium towards RX J0852.0–4622 with a focus on HI emission, and molecular clumps traced by CO(1-0). The authors identified a candidate interstellar medium association for RX J0852.0–4622 and their data are used in our multi-wavelength investigation.
3 Results and Discussion
Like in radio continuum images by Stupar et al. (2005), in Figure 2 the circular structure can be clearly discerned in the north and north-west of the RX J0852.0–4622 shell, in addition to the southern section. This RX J0852.0–4622 (Vela Jr) circular structure appears consistent with Parkes 13 cm data (Duncan & Green, 2000), hard 1.3 keV X-ray emission (Aschenbach, 1998) and TeV gamma-ray emission (H.E.S.S. Collaboration et al., 2018), whereas, as noted in the Aschenbach Vela Jr discovery paper, the broadband X-ray (0.1-2.4 keV) structure does not reflect the circular structure of Vela Jr.
We characterise the radio emission towards RX J0852.0–4622 as a circular shell in Section 3.1 and highlight several filamentary radio continuum structures in Figure 2 - Filament A, B, C and D. These are discussed in Section 3.2.
3.1 Parametrising the SNR shell
We perform -minimisation fits of a 2-dimensional shell model888http://cxc.harvard.edu/sherpa/ahelp/shell2d.html to each radio continuum data-set in Table 2 using SHERPA999http://cxc.cfa.harvard.edu/sherpa/ software. We masked rectangular regions encompassing three filamentary structures (A, B and C, see Section 3.2) then employed a Neldermead fitting method (Lagarias et al., 1998), assuming a constant noise level across each image.
The centre position, SNR radius and shell width were free parameters in the fit. The best-fit parameters are displayed in Table 3.
| year | Central | Right | Declination | Radius† | Width |
|---|---|---|---|---|---|
| Frequency | Ascension | ||||
| (MHz) | (deg) | (deg) | (arcsec) | (arcsec) | |
| 1999 | 1384 | 132.98 | -46.26 | 2943 | 50 |
| 2496 | 132.99 | -46.27 | 2965 | 125 | |
| 2011 | 1332 | 133.19 | -46.29 | 3380 | 185 |
| 1844 | 133.22 | -46.27 | 3433 | 160 | |
| 2100 | 133.19 | -46.28 | 3377 | 157 | |
| 2356 | 133.23 | -46.26 | 3471 | 152 | |
| 2868 | 133.23 | -46.26 | 3456 | 127 | |
| 1999+2011 | 1332-2868 | 133.08 | -46.34 | 3242 | -‡ |
†The radius displayed is the inner shell radius derived from the SHERPA fit plus half of the non-deconvolved shell width.
‡The deconvolved shell width is not calculated, because the beam FWHM is unclear for this merged data, but an non-deconvolved width of 310 arcsec is found.
The optimum 2-dimensional shell fit to the radio continuum suggests a centre of (, J2000)=(133.08∘ , 46.34∘ ) (8h 52m 19.2 s, 46∘20′24.0′′), and a radius of 3242 arcsec (0.9∘). We do not have sufficient coverage in the south-east of the SNR to warrant attempting an egg-shaped functional fit as suggested by X-ray emission studies (e.g. Aschenbach, 1998; Fukui et al., 2017).
The 10 arcsecond-scale errors associated with the SNR radius and the differing coverage of the 1999 and 2011 observations (see Figure 1) make the data unsuitable for expansion rate studies, particularly because previous X-ray expansion rate measurements (Katsuda et al., 2009; Allen et al., 2015) suggest that sub-arcsecond yr-1 precision is required for this purpose.
3.2 Filamentary Features
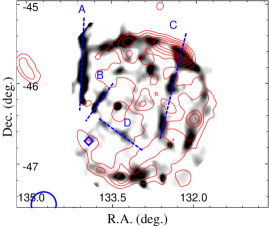
We have identified filamentary structures within the 1999 and 2011 ATCA data-sets that are not aligned with the circular RX J0852.0–4622 shell. We highlight these with dashed lines in Figure 2. These features are also indicated on Figure 4, which displays [OIII] emission, and Figure 5, which displays short-wavelength UV emission. We note that none of the identified filaments correspond to the TeV gamma-ray emission or hard X-ray emission from the RX J0852.0–4622 shell. The unassociated PWN PSR J08554644 is also indicated in Figure 2. Coincident gamma-ray emission at this location is associated (Acero et al., 2013) with PWN PSR J08554644, not RX J0852.0–4622.
Filament A is a vertical filament of emission at right-ascension 134∘ that partially overlaps with the north-eastern edge of RX J0852.0–4622. This feature has previously been identified as ‘feature C’ by Combi et al. (1999). Filament B is a 17′-length radio continuum structure centred at approximately [133.73,-46.25]. Filament C is a prominent feature of the 1999 and 2011 radio continuum maps which extends almost vertically along right ascension 132.5∘ for a length of 1.5∘ inside the perimeter of the RX J0852.0–4622 shell. Filament D is a half-arcminute long filament feature, centred on approximately [133.45,-46.62], at an angle of 24∘ to the ecliptic plane.
3.2.1 High Energy Correspondence
The broad-band X-ray structure in the top right image of Figure 2 is dominated by thermal emission from the Vela SNR (Aschenbach et al., 1995; Aschenbach, 1998). This means that the broadband X-ray structure can help to distinguish the radio continuum structure of the Vela SNR versus Vela Jr, allowing us to investigate the origin of Filaments A, B, C and D. Similarly, UV emission in Figure 5 highlights the older, foreground Vela SNR with perhaps a smaller contamination from the Vela Jr shocks due to the larger distance of Vela Jr.
Referring to Figures 2 and 5, filaments A, C and D have corresponding soft X-ray and UV emission. Since this emission is believed to be dominated by thermal emission from the Vela SNR, Filaments A, C and D have clear thermal counterparts, strongly suggesting an association with the Vela SNR. Furthermore, UV and soft X-ray emission towards Filament A appear to extend northwards beyond the RX J0852.0–4622 perimeter, towards more vertical features that are likely associated with the Vela SNR (see Figures 2, 4 and 5). Conversely, all filaments, A, B, C and D, do not have clear correspondences with hard X-rays or gamma-ray emission, suggesting no association with RX J0852.0–4622.
Filament B does not have any UV, X-ray or gamma-ray counterpart, so we are unable to favour either a Vela SNR or Vela Jr origin for this feature.
3.2.2 Optical Correspondence
[OIII] emission is considered a good tracer of cooling post-shock gas associated with radiative-phase SNRs, consistent with emission from the Vela SNR. In Figure 4, the structure of the Vela SNR can be seen to overlap and align well with filaments A and D. These have corresponding filamentary [OIII] emission structure, as seen in Figure 7, which shows [OIII] with [SII] and H emission. Both filaments B and C have no optical counterpart.
The eastern side of the Filament D radio continuum emission is coincident with an arc in [OIII] emission (Figure 7). This feature, which we have coined the ‘Vela Claw’ may be related to a shock interaction with gas, and is discussed in Section 3.3.
Generally, a lack of [OIII] emission towards the outer circular shell of RX J0852.0–4622 suggests that [OIII] does not generally trace the fast 103 kms-1 RX J0852.0–4622 shocks, consistent with expectations.
3.3 Correspondence with the Interstellar Medium Associated with RX J0852.0–4622
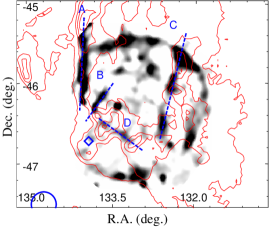
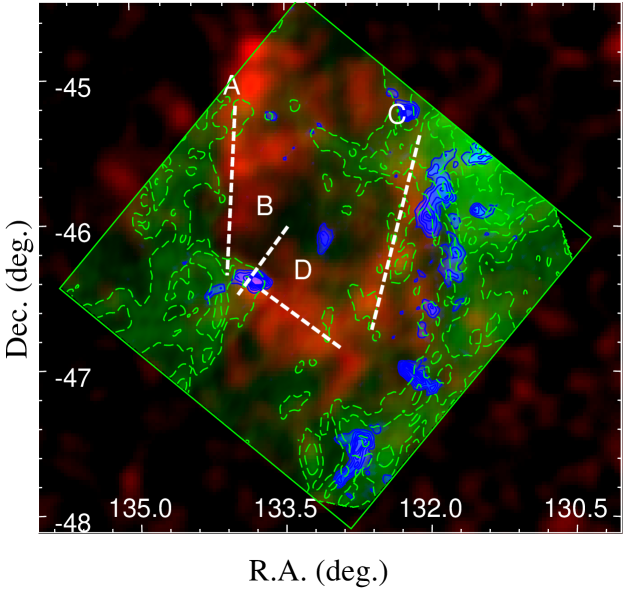
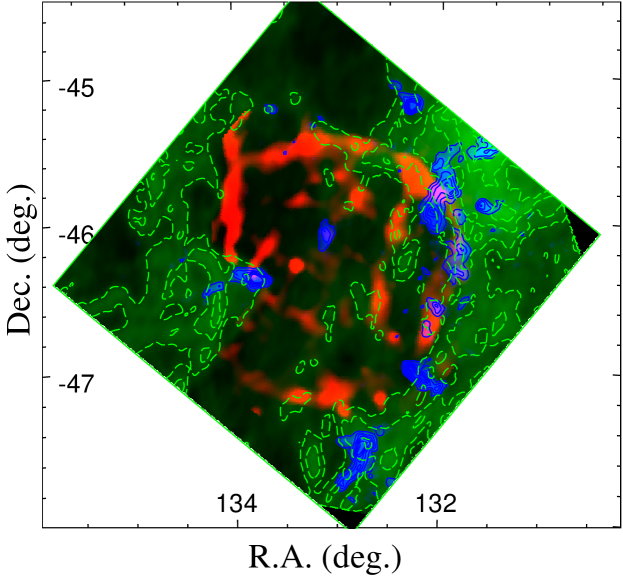
Figure 6 shows the ATCA radio continuum morphology against a backdrop of a HI-dip identified by Fukui et al. (2017) to be likely associated with RX J0852.0–4622. The SNR shell corresponds well to this dip in HI emission (velocity 30 kms-1), with the eastern side partially-overlapping the contours of atomic gas, while regions of the north-east and south sit outside the lowest HI contour level within the HI-dip. It follows that ATCA radio continuum emission supports the gas-association found by Fukui et al. (2017).
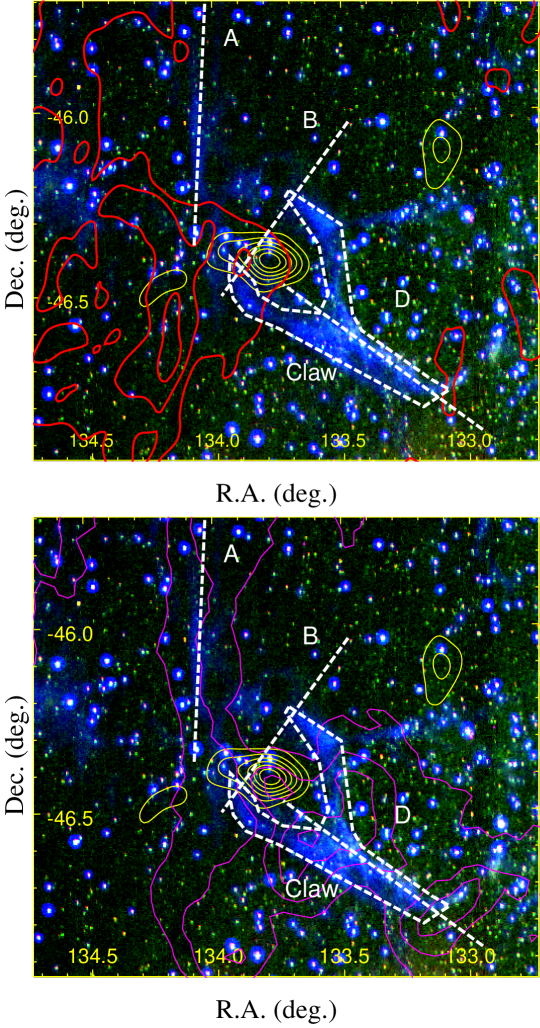
On examination of the [OIII]-traced, Filament D, a forking structure was identified: we denote this feature as the Vela Claw and indicate its position and morphology in Figure 7. The Claw appears to be part of a larger structure that is connected to the [OIII] emission coincident with Filament D. The [OIII] filament diverges into two filamentary structures to form a claw-like structure. This appears to occur at a location near a stripped CO clump referred to as ‘CO30E’ by Fukui et al. (2017), which the authors suggested to be associated with Vela Jr. The diverging filament forms a crescent around clump CO30E from the north-west to the east, suggesting that the [OIII] emission may be associated with the Vela Jr shock.
Two scenarios are considered to explain the origin of the Vela Claw: (i) Vela Jr generating the Vela Claw, and (ii) the Vela SNR generating the Vela Claw.
Scenario (ii) is consistent with the accepted picture of how optical [OIII] emission is produced from SNRs, i.e. the radiative cooling of diffuse gas in the wake of a 100 km-1 shockwave (see Section 1.1). Furthermore the Vela SNR is a known emitter of this transition, as is clearly seen extensively throughout the Vela SNR shell (see Figure 4). It follows that if scenario (ii) is correct, the Vela Claw correspondence with clump CO30E might simply be coincidental. Indeed, this scenario is consistent with the Vela Claw being associated with the coincident radio continuum feature, Filament D, for which a Vela SNR origin is perhaps favoured by the coincident UV/soft X-ray structure attributable to the Vela SNR (see Section 3.2.1). Alternatively, the correspondence might be evidence for an association of clump CO30E with the Vela SNR - a scenario which is disfavoured by the remarkable correlation between gas near the CO30E Galactic velocity and the Vela Jr gamma-ray emission (Fukui et al., 2017), assuming that Vela Jr and the Vela SNR are indeed at different distances (750 and 300 pc, respectively), as currently believed.
Scenario (i), an association of the Vela Claw with Vela Jr, would be a surprising result because the conditions within the 3000 kms-1 Vela Jr shock are not considered conducive to stimulate optical [OIII] emission, or indeed any significant detectable thermal cooling lines at other wavelengths. Naively, an association of Vela Jr with clump CO30E and the Vela Claw might require that the SNR shock (forward or reverse) is slowed significantly by the clump CO30E density gradient. If we assume a constant ram pressure model, , where is the gas density and is the shock speed, the Vela Jr shock might be slowed to 10% of the initial speed in a localised region with a sharp density gradient of 100. This is plausibly occurring for Vela Jr. Clump CO30E has a mass of 180 M⊙ and an approximate radius of 3 pc (Table 1 Fukui et al., 2017). Assuming a spherical geometry, the average H2 density of clump CO30E is approximately n30 cm-3, which would represent a 100 increase in density with respect to the density expected for a wind-blown cavity region (e.g. 0.1 cm-3), like that proposed for the evolution of Vela Jr (Fukui et al., 2017).
Sutherland & Dopita (1995) proposed another mechanism to explain thermal emission from seven young SNRs (including Cassiopeia A, SNR G292.01.8 and Puppis A) that may also be able to describe scenario (i) in Vela Jr. In the Sutherland & Dopita model, knots of oxygen-rich ejecta material move through a low-density medium until encountering a density discontinuity at a relative velocity of several1000 km-1. A density increase of 100 is said to translate to internal cloud shock speeds of 100 kms-1, which could lead to the observed [OIII] emission.
The validity of scenario (i) is complicated by the expectation that a thermal UV/X-ray emission counterpart to the [OIII] emission might be expected, as is the case for shell segments of the SNR RCW 86, which exhibits shock velocities that vary by an order of magnitude due to sharp localised density gradients (e.g. Vink et al., 2006; Broersen et al., 2014). As discussed in Section 3.2.1, the Vela SNR likely dominates the thermal UV/X-ray emission in this region, therefore scenario (i) is difficult to test with UV or X-ray data. Figure 7 (bottom) shows the significant overlap between the Vela Claw and ROSAT soft thermal X-ray emission. Small-scale spectral studies of the X-ray emission might help to distinguish a thermal emission component from Vela Jr towards the Vela Claw. Such a detection would not only strengthen the association between the SNR and clump CO30E, but would be further model-dependent evidence of the core-collapse nature of the progenitor event, since the Sutherland & Dopita model requires oxygen-rich ejecta material inherent to core-collapse events.
Also displayed in Figure 6 are CO-traced molecular gas clumps at the outskirts of the HI dip. Towards the north-west region of RX J0852.0–4622 the signal/noise level and resolution of the 2011 ATCA data-set was sufficient across the bands to derive a reliable spectral index map. In Figure 3, radio continuum emission towards the rim of RX J0852.0–4622 may flatten (0.5) towards a dense molecular region traced by CO(1-0) emission - a scenario indicative of a SNR-cloud shock interaction (e.g. Keohane et al., 1997; Ingallinera et al., 2014). No other suggestion of a shock-cloud interaction in this region is seen at other wavelengths, including thermal UV and X-ray emission.
4 CONCLUSION
We suggest that the 1332-2868 MHz radio continuum emission of RX J0852.0–4622 is well-characterised by a 2-dimensional shell of 3242 arcsec centred at (l,b)=(133.08∘ ,-46.34). Several filamentary structures are identified and multi-wavelength data is examined to investigate their relation to RX J0852.0–4622.
Based only on morphological studies of radio continuum, UV, X-ray and gamma-ray emission, three radio filaments towards RX J0852.0–4622 show no indication of an RX J0852.0–4622 origin, while one filament has no clear multi-wavelength counterpart. An investigation of [OIII] emission, however, lead to the identification of a feature we coined the Vela Claw, which is possibly associated with one of the radio filaments. The feature corresponds to a south-east molecular clump previously suggested to be stripped by the progenitor of RX J0852.0–4622 (Fukui et al., 2017). Although the [OIII] feature is consistent with an origin in the shocks of the coincident Vela SNR, motivated by morphological correspondence with RX J0852.0–4622, we propose the possibility of RX J0852.0–4622 triggering the [OIII] emission of the Vela Claw. Proof of an association would reinforce the gas association found by Fukui et al. (2017).
5 acknowledgments
We thank the anonymous referee for their considered and constructive feedback which improved the quality of our manuscript. The Australia Telescope Compact Array is part of the Australia Telescope National Facility which is funded by the Commonwealth of Australia for operation as a National Facility managed by CSIRO. This paper includes archived data obtained through the Australia Telescope Online Archive (http://atoa.atnf.csiro.au). This research has made use of software provided by the Chandra X-ray Center (CXC) in the application packages CIAO, ChIPS, and Sherpa.
References
- Acero et al. (2013) Acero, F., Gallant, Y., Ballet, J., Renaud, M., & Terrier, R. 2013, A&A, 551, A7
- Aharonian et al. (2005) Aharonian, F., Akhperjanian, A. G., Bazer-Bachi, A. R., et al. 2005, A&A, 437, L7
- Aharonian et al. (2007) —. 2007, ApJ, 661, 236
- Allen et al. (2015) Allen, G. E., Chow, K., DeLaney, T., et al. 2015, ApJ, 798, 82
- Aschenbach (1998) Aschenbach, B. 1998, Nature, 396, 141
- Aschenbach et al. (1995) Aschenbach, B., Egger, R., & Trümper, J. 1995, Nature, 373, 587
- Bamba et al. (2005) Bamba, A., Yamazaki, R., & Hiraga, J. S. 2005, ApJ, 632, 294
- Bocchino et al. (1999) Bocchino, F., Maggio, A., & Sciortino, S. 1999, A&A, 342, 839
- Bocchino et al. (2000) Bocchino, F., Maggio, A., Sciortino, S., & Raymond, J. 2000, A&A, 359, 316
- Bock et al. (1998) Bock, D. C.-J., Turtle, A. J., & Green, A. J. 1998, AJ, 116, 1886
- Bozzetto et al. (2017) Bozzetto, L. M., Filipović, M. D., Vukotić, B., et al. 2017, ApJS, 230, 2
- Broersen et al. (2014) Broersen, S., Chiotellis, A., Vink, J., & Bamba, A. 2014, MNRAS, 441, 3040
- Caraveo et al. (2001) Caraveo, P. A., De Luca, A., Mignani, R. P., & Bignami, G. F. 2001, ApJ, 561, 930
- Cha & Sembach (2000) Cha, A. N., & Sembach, K. R. 2000, ApJS, 126, 399
- Cha et al. (1999) Cha, A. N., Sembach, K. R., & Danks, A. C. 1999, ApJ, 515, L25
- Combi et al. (1999) Combi, J. A., Romero, G. E., & Benaglia, P. 1999, ApJ, 519, L177
- Cox (1972) Cox, D. P. 1972, ApJ, 178, 159
- Crawford et al. (2011) Crawford, E. J., Filipovic, M. D., de Horta, A. Y., et al. 2011, Serbian Astronomical Journal, 183, 95
- Dodson et al. (2003) Dodson, R., Legge, D., Reynolds, J. E., & McCulloch, P. M. 2003, ApJ, 596, 1137
- Dubner et al. (1998) Dubner, G. M., Green, A. J., Goss, W. M., Bock, D. C.-J., & Giacani, E. 1998, AJ, 116, 813
- Duncan & Green (2000) Duncan, A. R., & Green, D. A. 2000, A&A, 364, 732
- Duncan et al. (1996) Duncan, A. R., Stewart, R. T., Haynes, R. F., & Jones, K. L. 1996, MNRAS, 280, 252
- Edelstein et al. (1993) Edelstein, J., Vedder, P. W., & Sirk, M. 1993, in Bulletin of the American Astronomical Society, Vol. 25, American Astronomical Society Meeting Abstracts #182, 863
- Filipović et al. (2001) Filipović, M. D., Jones, P. A., & Aschenbach, B. 2001, in American Institute of Physics Conference Series, Vol. 565, Young Supernova Remnants, ed. S. S. Holt & U. Hwang, 267–270
- Fukui et al. (2003) Fukui, Y., Moriguchi, Y., Tamura, K., et al. 2003, PASJ, 55, L61
- Fukui et al. (2012) Fukui, Y., Sano, H., Sato, J., et al. 2012, ApJ, 746, 82
- Fukui et al. (2017) —. 2017, ApJ, 850, 71
- Griffith & Wright (1993) Griffith, M. R., & Wright, A. E. 1993, AJ, 105, 1666
- Hartigan et al. (1987) Hartigan, P., Raymond, J., & Hartmann, L. 1987, ApJ, 316, 323
- H.E.S.S. Collaboration et al. (2018) H.E.S.S. Collaboration, Abdalla, H., Abramowski, A., et al. 2018, A&A, 612, A7
- Hughes et al. (2006) Hughes, A., Wong, T., Ekers, R., et al. 2006, MNRAS, 370, 363
- Ingallinera et al. (2014) Ingallinera, A., Trigilio, C., Umana, G., et al. 2014, MNRAS, 445, 4507
- Iyudin et al. (1998) Iyudin, A. F., Schönfelder, V., Bennett, K., et al. 1998, Nature, 396, 142
- Jenkins & Wallerstein (1995) Jenkins, E. B., & Wallerstein, G. 1995, ApJ, 440, 227
- Kargaltsev et al. (2002) Kargaltsev, O., Pavlov, G. G., Sanwal, D., & Garmire, G. P. 2002, ApJ, 580, 1060
- Katsuda et al. (2009) Katsuda, S., Tsunemi, H., & Mori, K. 2009, Advances in Space Research, 43, 895
- Keohane et al. (1997) Keohane, J. W., Petre, R., Gotthelf, E. V., Ozaki, M., & Koyama, K. 1997, ApJ, 484, 350
- Kim et al. (2012) Kim, I.-J., Seon, K.-I., Min, K.-W., Han, W., & Edelstein, J. 2012, ApJ, 761, 135
- Lagarias et al. (1998) Lagarias, J. C., Reeds, J. A., Wright, M. H., & Wright, P. E. 1998, SIAM Journal on Optimization, 9, 112
- Maxted et al. (2012) Maxted, N. I., Rowell, G. P., Dawson, B. R., et al. 2012, MNRAS, 422, 2230
- Maxted et al. (2013) —. 2013, PASA, 30, e055
- McClure-Griffiths et al. (2005) McClure-Griffiths, N. M., Dickey, J. M., Gaensler, B. M., et al. 2005, ApJS, 158, 178
- Miller (1973) Miller, E. W. 1973, PASP, 85, 764
- Milne (1968) Milne, D. K. 1968, Australian Journal of Physics, 21, 501
- Nichols & Slavin (2004) Nichols, J. S., & Slavin, J. D. 2004, ApJ, 610, 285
- Pakhomov et al. (2012) Pakhomov, Y. V., Chugai, N. N., & Iyudin, A. F. 2012, MNRAS, 424, 3145
- Pannuti et al. (2010) Pannuti, T. G., Allen, G. E., Filipović, M. D., et al. 2010, ApJ, 721, 1492
- Raymond et al. (1981) Raymond, J. C., Black, J. H., Dupree, A. K., & Hartmann, L. 1981, ApJ, 246, 100
- Raymond et al. (1997) Raymond, J. C., Blair, W. P., Long, K. S., et al. 1997, ApJ, 482, 881
- Raymond et al. (1991) Raymond, J. C., Wallerstein, G., & Balick, B. 1991, ApJ, 383, 226
- Redman et al. (2000) Redman, M. P., Meaburn, J., O’Connor, J. A., Holloway, A. J., & Bryce, M. 2000, ApJ, 543, L153
- Reichley et al. (1970) Reichley, P. E., Downs, G. S., & Morris, G. A. 1970, ApJ, 159, doi:10.1086/180473
- Renaud et al. (2006) Renaud, M., Vink, J., Decourchelle, A., et al. 2006, New A Rev., 50, 540
- Reynoso et al. (2006) Reynoso, E. M., Dubner, G., Giacani, E., Johnston, S., & Green, A. J. 2006, A&A, 449, 243
- Sankrit et al. (2003) Sankrit, R., Blair, W. P., & Raymond, J. C. 2003, ApJ, 589, 242
- Sano et al. (2010) Sano, H., Sato, J., Horachi, H., et al. 2010, ApJ, 724, 59
- Sault et al. (1995) Sault, R. J., Teuben, P. J., & Wright, M. C. H. 1995, in Astronomical Society of the Pacific Conference Series, Vol. 77, Astronomical Data Analysis Software and Systems IV, ed. R. A. Shaw, H. E. Payne, & J. J. E. Hayes, 433
- Schwartz (1978) Schwartz, R. D. 1978, ApJ, 223, 884
- Slane et al. (2001) Slane, P., Hughes, J. P., Edgar, R. J., et al. 2001, ApJ, 548, 814
- Slavin et al. (2004) Slavin, J. D., Nichols, J. S., & Blair, W. P. 2004, ApJ, 606, 900
- Stupar et al. (2005) Stupar, M., Filipović, M. D., Jones, P. A., & Parker, Q. A. 2005, Advances in Space Research, 35, 1047
- Sushch et al. (2011) Sushch, I., Hnatyk, B., & Neronov, A. 2011, A&A, 525, A154
- Sushch et al. (2018) Sushch, I., et al. 2018, ApJ, in review., 000
- Sutherland & Dopita (1995) Sutherland, R. S., & Dopita, M. A. 1995, ApJ, 439, 381
- Tanaka et al. (2011) Tanaka, T., Allafort, A., Ballet, J., et al. 2011, ApJ, 740, L51
- Vink et al. (2006) Vink, J., Bleeker, J., van der Heyden, K., et al. 2006, ApJ, 648, L33
- Welsh (1990) Welsh, B. Y. 1990, Optical Engineering, 29, 752
- Wilson et al. (2011) Wilson, W. E., Ferris, R. H., Axtens, P., et al. 2011, MNRAS, 416, 832