The Role of Black Hole Feedback on Size and Structural Evolution in Massive Galaxies
Abstract
We use cosmological hydrodynamical simulations to investigate the role of feedback from accreting black holes on the evolution of sizes, compactness, stellar core density and specific star-formation of massive galaxies with stellar masses of . We perform two sets of cosmological zoom-in simulations of 30 halos to : (1) without black holes and Active Galactic Nucleus (AGN) feedback and (2) with AGN feedback arising from winds and X-ray radiation. We find that AGN feedback can alter the stellar density distribution, reduce the core density within the central 1 kpc by 0.3 dex from , and enhance the size growth of massive galaxies. We also find that galaxies simulated with AGN feedback evolve along similar tracks to those characterized by observations in specific star formation versus compactness. We confirm that AGN feedback plays an important role in transforming galaxies from blue compact galaxies into red extended galaxies in two ways: (1) it effectively quenches the star formation, transforming blue compact galaxies into compact quiescent galaxies and (2) it also removes and prevents new accretion of cold gas, shutting down in-situ star formation and causing subsequent mergers to be gas-poor or mixed. Gas poor minor mergers then build up an extended stellar envelope. AGN feedback also puffs up the central region through the fast AGN driven winds as well as the slow expulsion of gas while the black hole is quiescent. Without AGN feedback, large amounts of gas accumulate in the central region, triggering star formation and leading to overly massive blue galaxies with dense stellar cores.
1. Introduction
In the local universe, galaxies show a bimodal color distribution: red quiescent galaxies (QGs) with old stellar populations, and young, blue, and star-forming galaxies (SFGs) (e.g. Kauffmann et al., 2003; Bell et al., 2004). The color bi-modality has been observed at early epochs up to (Faber et al., 2007; Brammer et al., 2009). Quiescence seems to be strongly correlated with structural properties such as galaxy size and concentration, at all epochs since — at a given stellar mass, QGs typically have smaller half-light radii, and denser cores, than SFGs (Shen et al., 2003; Williams et al., 2010; Wuyts et al., 2011; Bell et al., 2012; Fang et al., 2013; Omand et al., 2014; van der Wel et al., 2014; Brennan et al., 2017; Pandya et al., 2017). The fraction of quiescent galaxies in the SDSS is found to be correlated with the mass and velocity dispersion of the bulge (Bluck et al., 2014, 2016).
The sizes of QGs are observed to be much smaller at fixed stellar mass at compared to local elliptical galaxies (Ferguson et al., 2004; Trujillo et al., 2004; Daddi et al., 2005; Longhetti et al., 2007; Toft et al., 2007; Trujillo et al., 2007; Buitrago et al., 2008; Cimatti et al., 2008; Franx et al., 2008; van Dokkum et al., 2008; Szomoru et al., 2010; van der Wel et al., 2014). These compact QGs (cQGs), also known as “red nuggets” (Damjanov et al., 2009), have sizes of about , about four times smaller than local QGs of the same mass. Moreover, the number density of compact galaxies is much lower in the local universe than in the past (Taylor et al., 2010; Cassata et al., 2011), leading to much speculation as to the fate of compact galaxies, and how these different populations of compact, extended, SF, and Q galaxies are related to one another at different cosmic epochs.
Barro et al. (2013) suggested that massive galaxies evolve through a characteristic track in the plane of sSFR versus compactness (defined as , where is the galaxy stellar mass and is the half-light radius; see their Figure 6): beginning at around redshift –3, compact SFGs (cSFGs) begin to quench, building up a population of compact quiescent galaxies (cQG). Below , galaxies increase in mass and (even more so) in size, to form the extended quiescent galaxies that are common today. The results of Barro et al. (2013) furthermore suggest that the quenching time is relatively short (300 Myr to 1 Gyr) (see also Pandya et al., 2017). Barro et al. (2014) showed that the radii and stellar mass surface densities of compact SFGs (cSFGs) quantitatively matched those of cQGs, supporting the picture in which cSFGs rapidly quench into cQGs.
A similar picture was suggested by van Dokkum et al. (2015), who also noted the concurrent decline of the cSFG population and rise of the cQG population. They proposed a toy model, in which star forming galaxies evolve along parallel tracks in the size-mass plane with , until they reach a stellar density or velocity dispersion threshold and quench their star formation. After quenching, galaxies evolve along a steeper track in the size-mass plane, with as observed (van Dokkum et al., 2010; Patel et al., 2013).
These observationally inferred formation scenarios pose several major questions to theoretical galaxy formation models: Which physical processes drive the characteristic evolution of the structural properties of star forming and quiescent galaxies? What physical process is responsible for the quenching of star formation? Are these two sets of processes causally connected, or the result of a common cause, or do they occur together only coincidentally? What causes the change in slope of the evolutionary path in the size-mass plane, or put another way, why do quiescent galaxies grow so much more rapidly in radius relative to their mass growth than star forming galaxies?
Several potential reasons for the early development of compact galaxies have been addressed in many papers, such as intense starbursts in galactic nuclei triggered by gas-rich major mergers (Barnes & Hernquist, 1991; Hopkins et al., 2006; Wellons et al., 2015), strong gas inflows within the disk driven by violent disk instabilities (Gammie, 2001; Dekel et al., 2009), and early dissipative assembly (Oser et al., 2010). Different authors have applied different labels to this phase of galaxy formation, but all pictures involve rapid inflow of gas into central star forming regions (see reviews by Somerville & Davé, 2015; Naab & Ostriker, 2017). Some works have suggested a causal connection between these dissipative processes (“compaction”) and quenching via a combination of gas exhaustion, and stellar and AGN driven winds (Dekel & Burkert, 2014; Zolotov et al., 2015). Observationally, strong galactic outflows are often associated with high star formation and gas densities (e.g. Diamond-Stanic et al., 2012).
The Cold Dark Matter (CDM) hierarchical structure formation model ubiquitously predicts that galaxies experience many mergers over the course of more than 11 Gyr from to the present day (Stewart et al., 2009; Conselice et al., 2009; Lotz et al., 2011; López-Sanjuan et al., 2013; Rodriguez-Gomez et al., 2016). Most of these would be termed ‘minor mergers” with . However, gas-rich (“wet”) mergers can drive gas into the nucleus of galaxies, making the centers denser and more compact, gas-poor (“dry”) mergers produce remnants that are more extended than the progenitors (Hopkins et al., 2010; Covington et al., 2011). Several works have pointed out that a promising way to drive rapid size growth with relatively little growth in mass is for a galaxy to experience multiple dry, minor mergers (Bezanson et al., 2009; Naab et al., 2009; Oser et al., 2012; Hilz et al., 2013; Porter et al., 2014).
To summarize, the suggested physical sequence (as described by Barro et al. (2013)) is the following: (1) star-forming, extended galaxies are gas rich, and undergo dissipative processes to form compact SFGs. (2) This compaction is followed by rapid quenching of star formation, to form compact quiescent galaxies. Finally, (3) the galaxy sizes are gradually expanded via multiple, minor dry mergers. Although this picture is plausible and appealing, it is still an open question whether fully self-consistent numerical cosmological hydrodynamical simulations can qualitatively or quantitatively reproduce the observed evolution.
Recent cosmological hydrodynamic simulations have demonstrated that AGN feedback can reduce galaxy stellar mass by preventing cooling flows (cf. Fabian, 1994) and quenching subsequent star formation in group and cluster sized halos (see reviews by Somerville & Davé, 2015; Naab & Ostriker, 2017, for references). Several recent studies have examined predictions for the evolution of the size-mass relations for both star forming and quiescent galaxies in hydrodynamic simulations of large cosmological volumes that include various implementations of AGN feedback (Genel et al., 2014; Wellons et al., 2015; Crain et al., 2015; Furlong et al., 2017; Genel et al., 2018).
While these studies found qualitative agreement with the observations, predictions for galaxy size and structure are known to be extremely sensitive to the details of how processes such as star formation, stellar feedback, and AGN feedback are implemented on sub-resolution scales (“sub-grid” physics) (see discussion and references in Somerville & Davé, 2015). For example, the predicted size-mass relation for star forming galaxies is quite different in the original Illustris simulation and the revised Illustris-TNG simulation (Genel et al., 2018), but the physical reasons for this are not fully understood (S. Genel, private communication).
It has been shown that simulations that include AGN feedback produce considerably better agreement with the observed size-mass relation for massive, quiescent galaxies, while simulations that omit AGN feedback produce massive galaxies that are too compact (Dubois et al., 2013; Crain et al., 2015; Choi et al., 2017). However, once again the physical processes at play are not fully understood. AGN feedback clearly reduces the gas fraction in early massive galaxies, leading to more dry merging, which, as discussed above, can drive rapid size growth. Furthermore, AGN feedback shuts off the late in-situ star formation that tends to rebuild a compact stellar core.
In addition, a potentially important dynamical impact of AGN feedback on the dark matter and stellar distributions has been discussed recently. Martizzi et al. (2012, 2013) found that AGN feedback can produce a flat stellar and dark matter density core in a galaxy cluster scale zoom-in simulation, possibly via a coupling of several mechanisms such as orbital energy transfer by black holes through dynamical friction, and ‘central revirialization’ (Pontzen & Governato, 2012) after AGN-driven gas outflows.
In this study, we make use of the high resolution simulations of massive galaxies evolving in a full CDM context presented by Choi et al. (2017) to study the evolution of size, stellar mass, star formation rate, and compactness of galaxies during the critical transition phase . These simulations utilize the “zoom-in” technique to attain higher mass and spatial resolution than the large cosmological volumes. Furthermore, these simulations include a more detailed and physically motivated treatment of the feedback from radiatively efficient accretion onto supermassive black holes (see Section 2.5 in Choi et al., 2017) than previous cosmological simulations that have studied galaxy structural evolution. Our feedback model is motivated by observations of powerful winds seen in broad absorption line (BAL) AGN (Moe et al., 2009; Gibson et al., 2009; Crenshaw & Kraemer, 2012; Arav et al., 2013). We include mechanical feedback from the BAL winds, as well as radiative feedback via Compton and photoionization heating (Choi et al., 2012, 2015). Furthermore, we analyze a matched suite of simulations with and without AGN feedback, and delve in more detail into the physical processes responsible for driving the predicted structural evolution.
2. Simulations
We performed two sets of high-resolution, cosmological zoom-in hydrodynamic simulations of 30 massive halos, with present-day total masses of and present-day stellar masses of (for the central galaxies). The physics implemented in our simulation models includes star formation, supernova feedback, wind feedback from massive stars, AGB stars and metal cooling and diffusion. Our simulation code also incorporates a new treatment of mechanical and radiative AGN feedback which is implemented in a self-consistent way, launching high-velocity mass outflows. The simulation suite used in this study is presented in Choi et al. (2017), and we refer the reader to that paper for further details. In the following we briefly summarize our simulations.
2.1. The hydrodynamic simulation code: SPHGal
We use SPHGal (Hu et al., 2014), a modified version of the parallel smoothed particle hydrodynamics (SPH) code GADGET-3 (Springel, 2005). This code incorporates a density-independent pressure-entropy SPH formulation (Ritchie & Thomas, 2001; Saitoh & Makino, 2013; Hopkins, 2013), to overcome the numerical fluid-mixing problems of classical SPH codes (e.g. Agertz et al., 2007). It also includes an improved artificial viscosity implementation (Cullen & Dehnen, 2010), an artificial thermal conductivity Read & Hayfield (2012), and a Wendland kernel with 200 neighboring particles (Dehnen & Aly, 2012). In order to ensure a proper treatment of shock propagation and feedback distribution, we employ a time-step limiter that makes neighboring particles have similar time-steps (Saitoh & Makino, 2009; Durier & Dalla Vecchia, 2012).
2.2. Star formation, chemical enrichment and stellar feedback model
Following Aumer et al. (2013), stars are stochastically formed within over-dense regions when the gas density exceeds a density threshold for the Jeans gravitational instability of the enclosed mass. The star formation rate is computed as where , and are the stellar and gas densities, and local dynamical time of gas particle, and we set the star formation efficiency as .
The evolution of each star particle contributes to the chemical enrichment of the interstellar medium (ISM) in our simulation during various mass loss events. We allow chemical enrichment via winds driven by Type I Supernovae (SNe), Type II SNe and asymptotic giant branch (AGB) stars with the chemical yields adopted from Iwamoto et al. (1999), Woosley & Weaver (1995), and Karakas (2010). We explicitly trace the mass in 11 chemical elements (H, He, C, N, O, Ne, Mg, Si, S, Ca and Fe), both for star and gas particles. We also allow the metal enriched gas particles to mix their metals with neighboring metal-poor gas particles via turbulent diffusion, using the standard SPH neighbor searches following Aumer et al. (2013). The net cooling rate is calculated based on individual chemical abundances, temperatures and densities of gas particles following Wiersma et al. (2009), accounting for a redshift dependent metagalactic UV/X-ray and cosmic microwave background with a modified Haardt & Madau (2001) spectrum.
The stellar feedback model is adopted from Núñez et al. (2017), and includes UV heating within Strmgren spheres around young massive stars, three-phase SN feedback by both type I and type II SNe, and winds from dying low-mass AGB stars. Each of the mass loss events of the stellar particles explicitly contribute mass, metals, momentum and energy to the surrounding gas. First, the young star particles gradually heat the neighboring gas to K within their HII region limit (Strmgren spheres Strömgren, 1939) before they explode as SNe.
We assume that a single SN event ejects mass in an outflow with a velocity , a typical velocity of outflowing SN ejecta (Janka, 2012). Depending on the physical distance from the SN, each adjacent gas particle is affected by one of the three successive SN phases: (i) momentum-conserving free expansion phase, (ii) energy-conserving Sedov-Taylor phase where SN energy is transferred with 30% as kinetic and 70% as thermal, and (iii) the snowplow phase where radiative cooling becomes important. In this ‘Snowplow’ SN feedback model, each SN remnant launches standard Sedov-Taylor blast-waves carrying energy as 30% kinetic and 70% thermal, and both dissipate with distance from the SN in its final pressure-driven snowplow phase. In addition, the old stellar particles still contribute their mass, energy and metal output via slow winds during an AGB phase. The energy and metal-enriched mass output from the old star particles are transferred to the adjacent gas particles in momentum-conserving manner.
We assume a Kroupa (2001) initial mass function (IMF), and we note that over 30% of the total mass in stars will be continuously ejected into the ISM via winds from SNe and AGB stars within 13 Gyr stellar evolution. This metal-enriched mass output from stars not only fuels late star formation but also feeds the central super massive black hole, inducing AGN activity (see also Ciotti et al., 2010).
2.3. Black hole formation, accretion, and AGN feedback model
In the simulations, new black hole seeds of mass are placed in the center of galaxies when they initially reach a dark matter halo mass of . The black hole seed mass and dark matter halo threshold mass are chosen to approximately follow the Magorrian et al. (1998) relation and the theoretical calculations of black hole seed formation (e.g. Volonteri, 2010; Stone et al., 2017). We note that black hole seed mass makes a negligible contribution to the final black hole mass of the central galaxies in our simulations.
The black hole can grow by merging with other black holes and by gas accretion. When two black hole particles get closer than their local SPH smoothing lengths and their relative velocities are less than the local sound speed, they merge together. The black hole particle also grows in mass via accretion of surrounding gas with a Bondi-Hoyle-Lyttleton accretion rate (Hoyle & Lyttleton, 1939; Bondi & Hoyle, 1944; Bondi, 1952), , where , , and are the density, the sound speed and the velocity of the gas relative to the black hole respectively. In order to prevent the unphysical accretion of unbound gas outside the Bondi radius, we incorporate the soft Bondi criterion first introduced in Choi et al. (2012). We statistically limit the accretion of the gas by the volume fraction of the gas particle lying within the Bondi radius, for example, the full accretion of the particle is allowed only when the total volume of a smoothed gas particle is contained within the Bondi radius.
The AGN feedback model we use is adopted from Choi et al. (2012, 2014) and consists of two main components: (1) mechanical feedback via winds, which carry energy, mass and momentum into the neighboring gas, and (2) radiative feedback via Compton and photoionization heating from the X-ray radiation from the accreting black hole. We also incorporate the radiation pressure associated with the X-ray heating, and the Eddington force. The emergent AGN spectrum and metal line heating rate are taken from Sazonov et al. (2004). The winds are driven by radiation pressure on gas and dust on scales below those that we can simulate explicitly; we therefore treat them using a sub-grid model as outlined below.
For the mechanical AGN feedback, the gas mass inflowing to the central region contributes to the accretion onto the black hole and AGN-driven winds. AGN winds carry mass with the kinetic energy rate given as , where the AGN outflowing wind velocity is assumed to be 10,000 , motivated by observations of BAL winds (e.g. Arav et al., 2013). This kinetic energy rate is proportional to the gas mass accreted onto the black hole as , where indicates the AGN feedback efficiency and is set to be , similar to the values used in other AGN feedback model implementations (e.g. Di Matteo et al., 2005).
Based on our selection of the feedback efficiency and the wind velocity , a fraction of the gas particles entering the accretion region is stochastically selected as wind particles. The selected wind particles are kicked in a direction parallel or anti-parallel to the direction of angular momentum of each gas particle; therefore the wind tends to be oriented perpendicular to the disk plane (Proga & Kallman, 2004), when the black holes are surrounded by a rotating gas disk. The ejected wind particle shares its energy and momentum with two adjacent gas particles and produces a shock heated momentum-driven flow with a ratio of kinetic to thermal energy similar to that in the standard Sedov-Taylor blast wave.
We also incorporate the heating via hard X-ray radiation from the accreting black hole following Sazonov et al. (2005). At the position of each gas particle, we calculate the net luminosity flux from all black holes in the simulated zoom-in area. The calculated flux is then converted to the net volume heating rate via Compton and photoionization heating using Sazonov et al. (2005) formulae. The radiation pressure from the X-ray flux is also included, as every gas particle absorbing energy from X-ray radiation is given an additional momentum directed away from the black hole.
Finally, we include the Eddington force on electrons in the neighboring gas directed radially away from black holes, instead of artificially limiting the gas accretion rate onto the black hole not to exceed the Eddington rate. In our simulations, we allow for super-Eddington gas accretion occasionally to occur. When this happens, the corresponding feedback effects naturally reduces the inflow and increases the outflow.
Choi et al. (2015) showed that the mechanical AGN feedback via broad absorption line winds produces stronger effects on the galaxy compared to the thermal feedback treatment (e.g. Springel et al., 2005). The feedback energy injected via mechanical winds rather than in thermal form more effectively drives the gas out of the galaxy via galactic outflows (Brennan et al., 2018) and quenches the star formation for a longer timescale.
2.4. Initial conditions
We use the cosmological ‘zoom-in’ initial conditions described in Oser et al. (2010). A sub-volume for the zoom-in initial condition is extracted from a larger volume dark matter only simulation using a flat cosmology with parameters obtained from WMAP3 (Spergel et al., 2007, , and ). All dark matter particles close to the halos of interest are traced from redshift zero and then replaced with higher resolution gas and dark matter particles.
We re-simulate the new high resolution initial conditions from redshift to . The simulation sets used in this study have mass resolution for the baryonic particles (star and gas) of , and the dark matter particles of . We adopt the co-moving gravitational softening lengths for the baryonic particles and for the dark matter. The adopted resolution is summarized in Table 1.
| Mass Ratio | softening length | particle mass |
|---|---|---|
| dark matter | 890 | |
| baryon | 400 |
The simulated halo masses range from at and the stellar masses of central galaxies are at present day. These galaxies are well resolved with stellar particles within the virial radius (, the radius where the spherical over-density drops below 200 times the critical density of the universe at a given redshift). The halo virial mass is the mass contained within a sphere with radius .
In order to study the effects of AGN feedback on the star formation, size and compactness of the galaxies, we run the full set of simulations with two different sets of physics:
(1) NoAGN: No black holes and no AGN feedback. This model is comparable to the results of Oser et al. (2010, 2012), but note that we use an alternative density-independent formulation of SPH designed to treat contact discontinuities more accurately, and include an artificial viscosity and an energy diffusion implementation which results in more cooling. We also include metal enrichment and metal line cooling which also enhances the cooling process. Moreover, we adopt a different recipe for stellar feedback (see Choi et al., 2017, for a further exploration of the effects of these changes).
(2) WithAGN: all of the same physical models as in the NoAGN model, with the addition of black holes and mechanical and radiative AGN feedback.
In this study, we only consider the central galaxies within the simulated halos. The stellar mass and the star formation rate of the galaxy are measured within 10 percent of the virial radius . Then we determine the effective radius of the galaxy by determining the mean values of the half-mass radii of stars within projected along 20 randomly chosen directions of the main stellar body.
3. Results
In Choi et al. (2017), we showed that AGN feedback, as implemented in our simulations, can change the fate of massive galaxies, effectively quenching late star formation, turning the majority of massive galaxies into quiescent galaxies, and reducing their final stellar mass by almost a factor of four. AGN feedback effectively reduces the in-situ star formation in the central galaxy where the most massive black holes are located. Our simulated galaxies without AGN show much higher rates of in-situ star formation in the innermost regions of the galaxies, as the gas reservoir is constantly refilled by “recycled gas” from SN and AGB winds from the old stellar population. In this section we show that AGN feedback also affects various structural properties of galaxies, including galaxy sizes, stellar core density, and compactness.
3.1. Evolution in the size-mass plane
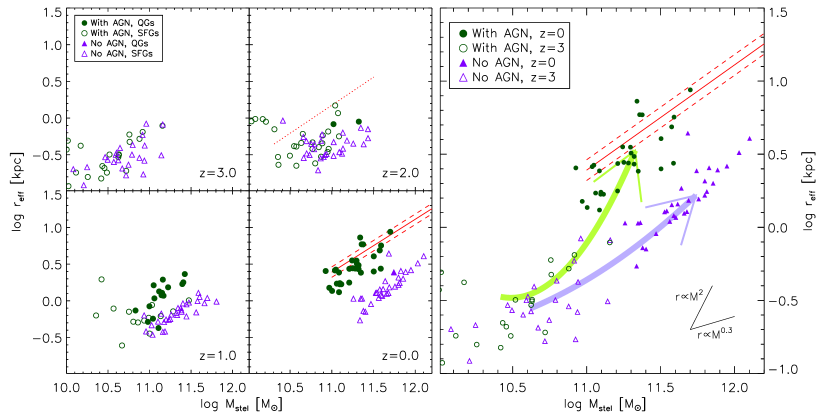
In left panels of Figure 1, we show the evolution of the galaxies simulated with and without AGN feedback in the projected half-mass radius (“size”) vs. stellar mass plane from redshift to . We show the sizes and stellar masses of the 30 central galaxies at , and their most massive progenitors at and . In order to exclude outliers caused by galaxy interactions (e.g. ongoing mergers), we use the median value of the sizes that we obtained for three snapshots around the target redshift. We divide our galaxies into star forming (open symbols) and quiescent galaxies (solid symbols) based on the commonly adopted dividing line at sSFR, where is the age of the universe at each redshift (e.g. Franx et al., 2008). We adopt this method as this divider based on sSFR is roughly equivalent to the commonly adopted method that separates quiescent and star forming galaxies in color-color space up to as described in Williams et al. (2009, 2010); Muzzin et al. (2013). Note that we only consider the central galaxies in the simulated halos. The central galaxies in group environments may experience accelerated size growth compared to galaxies in the field, via minor mergers which are more common in high density environments (see Cappellari, 2013; Chan et al., 2018).
At , all progenitor galaxies simulated with and without AGN feedback are very compact ( kpc), and the two models do not show a significant difference in size while NoAGN galaxies are slightly more massive than WithAGN galaxies. At , both WithAGN and NoAGN galaxies are still compact, compared to the size-mass relation for high-redshift galaxies () from CANDELS (van der Wel et al., 2014). However, by , the quenched galaxies among those simulated with AGN feedback start to diverge and form a size-mass relation clearly separated from that of NoAGN feedback galaxies. By , all galaxies are quenched in the simulations with AGN feedback, and they closely follow the observed size-mass relation of the local quiescent galaxies from SLACS sample (Nipoti et al., 2009).
On the other hand, NoAGN galaxies show much less size growth since , evolving with a much shallower slope in the size-mass plane. The present-day sizes of galaxies simulated without AGN feedback are times smaller compared to the observed relation at a given stellar mass, consistent with Crain et al. (2015). In the absence of AGN feedback, we have continuous star formation in the central regions of galaxies, which results in a concentrated stellar mass profile as discussed in Martizzi et al. (2012). In addition, the “outer” size growth via addition of stars from minor dry mergers is less significant in the NoAGN simulations, as in situ star formation always dominates over the accreted star component (see Figure 9 in Choi et al. (2017), and also Lackner et al. (2012); Dubois et al. (2013); Hirschmann et al. (2013); Dubois et al. (2016).
Since , the galaxies without AGN feedback mainly accumulate their stellar mass via in-situ star formation (stars formed from gas within the main progenitor), while the galaxies with AGN feedback mainly grow their stellar mass by accreting stellar mass via minor mergers, after their in-situ star formation is quenched. This difference in the evolutionary paths of galaxies in the two models in the size-mass plane is illustrated in the right panel of Figure 1, where we show the average tracks of simulated galaxies for the two models. The two models with and without AGN feedback follow very different evolutionary tracks. Until , galaxies in both models grow in mass and gradually increase their density, showing little growth in size. Then, after the in-situ star formation is quenched (as shown in left panels), the galaxies simulated with AGN feedback show much steeper evolution in the size-mass plane.
We note that the galaxies simulated with AGN feedback follow a very similar track to that suggested based on observations by van Dokkum et al. (2015), as discussed in the Introduction. Star-forming galaxies in our models evolve along the shallower track in the size-mass plane, , until their star formation is quenched by the AGN-driven winds. After quenching, galaxies grow along a steeper track in the size-mass plane, with . On the other hand, galaxies simulated without AGN feedback remain gas rich, and continue to evolve along the much shallower track with .
Recently Genel et al. (2018) also found such a turnover in the size-mass plane in the evolution of massive galaxies in the Illustris-TNG simulation. They found that galaxies have this steep size evolution as a function of the added stellar mass after they quench their star formation — mainly induced by their black hole driven kinetic and thermal feedback (Weinberger et al., 2017) as in this study — and the size growth of the most massive galaxies occurs mostly during their quiescent phase.
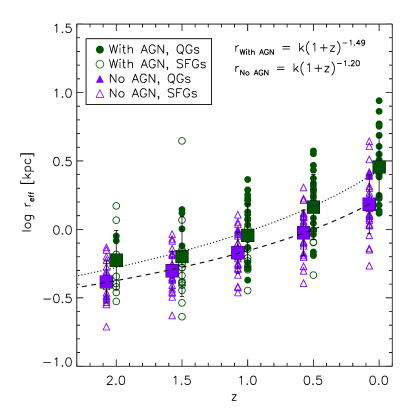
To quantify the size evolution of our simulated galaxies as a function of redshift, we fit a power law in as is frequently done in observational studies (e.g. Newman et al., 2010; Damjanov et al., 2011). We show the size evolution of galaxies with from to the present day in Figure 2. The median sizes of galaxies in each redshift bin are shown as squares and we show the power-law fit to the median sizes with black lines. Overall, galaxy sizes are smaller in the NoAGN model at all redshifts, and the difference becomes even larger by as WithAGN galaxies show more rapid size growth per added stellar mass during the quenched phase as shown in Figure 1. Between redshift 2 and 0, our simulated galaxies grow on average by a factor of 5. Our power-law fit to galaxy sizes simulated with AGN is , which is in good agreement with observations (van der Wel et al., 2014).
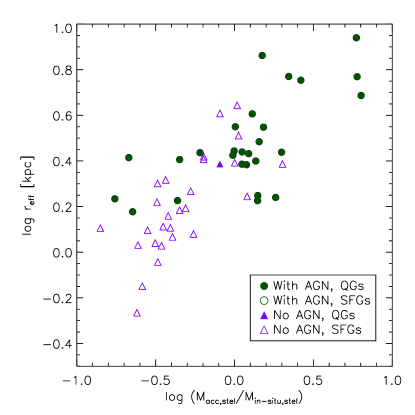
In Figure 3, we show the projected stellar half-mass radii at as a function of the fraction of stellar mass formed in other galaxies and accreted onto the main progenitor, to the stellar mass formed in-situ, for galaxies simulated with and without AGN feedback. There is a clear correlation between the sizes and the relative amount of accreted and in-situ formed stars for WithAGN as well as NoAGN feedback models. This indicates that the accretion of stellar mass drives the growth of the effective radius of massive galaxies for both models. For galaxies whose mass is dominated by the accreted stellar component , the two models show similar sizes at fixed accreted star fraction. However, for galaxies dominated by in-situ formed stars, , galaxies simulated without AGN show smaller sizes at fixed fraction. This is partly because of the fact that completely dry mergers are relatively rare due to the high gas fractions in satellite galaxies without AGN feedback, while merging satellite galaxies also have black holes and corresponding AGN feedback in the WithAGN feedback model. Moreover, galaxies with AGN are also more efficiently puffed up via gas outflows (Fan et al., 2008). The slow expulsion of gas while the AGN is quiescent can induce adiabatic expansion of the stellar component (e.g. Hills, 1980), and the rapid mass loss driven by fast AGN winds can further elevate this puffing-up process (Biermann & Shapiro, 1979). We discuss and illustrate this puffing up process of the stellar system in the next subsection.
3.2. Central stellar density evolution
Cheung et al. (2012) proposed the quantity , the projected stellar mass surface density within the central 1 kpc, as a robust measure of galaxies’ core density, and showed that at –0.8, is more strongly correlated with quiescence than stellar mass or the effective surface density . Fang et al. (2013) showed that ) shows a tight scaling relation with stellar mass for quiescent galaxies at , and that a stellar mass-dependent threshold is a better predictor of quiescence than is stellar mass alone. Barro et al. (2017) studied the structural properties of massive galaxies in the CANDELS/GOODS-S field and found that this tight scaling relation in vs. holds for quiescent galaxies out to , but the zero point of this relation has declined by dex since . van Dokkum et al. (2014) also found that the number density of galaxies with dense cores has decreased from to today. Both papers suggested that stellar mass loss and subsequent adiabatic expansion can explain this observed decrease in core density.
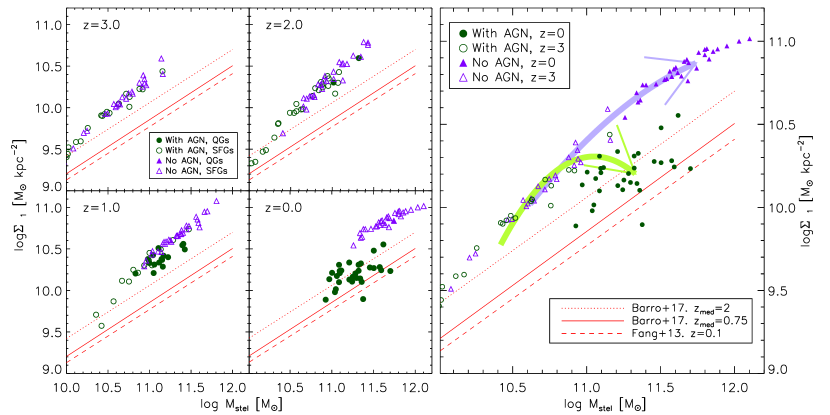
In order to study the evolution of the stellar core density of our simulated galaxies, we measure the projected central stellar mass surface density within , , and show the evolution of all galaxies in the stellar mass versus plane from to in Figure 4. The core densities indicated here are the mean values of the surface stellar densities projected along the three principal axes. We note that we only focus on the differential effect as this quantity is affected by gravitational softening.
In left panels of Figure 4 we show as a function of stellar mass for 30 central galaxies at , and their most massive progenitors at as in Figure 1. We also separately show the star forming and quiescent galaxies (open and filled symbols respectively) to study the effect of star formation quenching on the evolution of the core stellar density. Until , galaxies in both models show a tight correlation between vs. stellar mass and do not show significant differences in the relationship. By , the quenched galaxies among those simulated with AGN feedback start to show decreased core densities and diverge from the previously established relation, while galaxies without AGN feedback continue to increase their core densities as well as stellar mass.
All galaxies are quenched in the WithAGN model by the present day, and they form a clearly separated relation from that of the NoAGN galaxies. While WithAGN galaxies are in better agreement with the observed relation from Barro et al. (2017) and Fang et al. (2013), NoAGN galaxies show dex higher core densities at a given stellar mass than observed. This high core density in NoAGN galaxies is attributed to the continuous in situ star formation of the galaxies, which is due to the lack of star formation quenching mechanisms in the central region. NoAGN galaxies have extended star formation until the present day, especially in the innermost region of the galaxies, as the gas reservoir in the galactic center is constantly refilled by “recycled gas” from SN and AGB winds in the old stellar population. Although WithAGN galaxies show much lower core densities than NoAGN galaxies, they are still 0.2-0.3 dex denser than the observations (Fang et al., 2013) at low redshift. This is presumably due to overcooling at high redshift as galaxies in both models are already too dense in the cores at and 3.
In the right panel of Figure 4, we show the average tracks of simulated galaxies in the -stellar mass plane for the WithAGN and NoAGN models. Until , galaxies in both models grow their stellar mass as well as core densities following a tight correlation. NoAGN galaxies keep following this evolutionary track until increasing their core densities, though the slope becomes a bit shallower by the present day. The core densities of galaxies simulated with AGN feedback, however, start to decline when the in-situ star formation is suppressed (as shown in left panels). This transition seems to happen when galaxies reach where a majority of galaxies start have their star formation quenched by AGN feedback. Overall, the galaxies with AGN feedback show almost a 0.3 dex decrease in core density from redshift 1 to 0, consistent with recent observations by Barro et al. (2017).
We find that, in our simulations, the decrease in core density is a result of a combination of several physical processes. One contributor is stellar mass loss, i.e., old stars gradually lose their mass by stellar evolution via supernova and AGB winds. Without additional star formation, the central stellar density naturally decreases due to this effect. In our simulations, star particles gradually return mass to the adjacent gas particles via SN or AGB driven winds. In order to check how much mass stellar particles have lost due to stellar evolution, we trace the evolution of all central star particles within 1 kpc at over time until . On average, these central star particles have lost 10 percent of their mass since via stellar evolution. We note that with our assumed IMF, over 30% of the total mass in newly formed stars will eventually be returned to the gas phase via winds over 13 Gyr of stellar evolution, but the bulk of the mass loss occurs when the stellar populations are very young, via SN explosions (see also Leitner & Kravtsov, 2011). Therefore, the relatively old stellar population already in place in the central region of the galaxies only shows moderate stellar mass loss since , and this cannot fully explain the decrease in central stellar densities in WithAGN galaxies.
Secondly, the expansion of the collisionless particles in the central region after gas ejection by outflows can ‘puff up’ the central region due to a decrease in the gravitational potential, leading to a more diffuse stellar core. The effect of outflows on the central stellar density depends on the amount of mass ejected as well as on the timescale of ejection. We have two channels for this ‘puffing up’ process, depending on the timescale of the mass loss: an adiabatic expansion after slow gas mass loss, and an impulsive expansion consequent to the rapid gas mass loss. The former includes the slow stellar mass loss associated with the death of old stars, i.e., AGB winds. In addition, the slow expulsion of gas during the quiescent phases of AGN can also adiabatically expand the central region. The latter, rapid mass loss involves SN driven winds as well as AGN driven winds (Fan et al., 2008), with a shorter ejection timescale then the dynamical timescale.
If we define the fractional changes in mass and in radius of a self gravitating system, as , and , where and are the initial and final masses after mass loss and and are the initial and final radii, we have adiabatic expansion with a rate of after mass loss on a timescale longer than a dynamical timescale. But when the gas mass is ejected with a timescale shorter than the dynamical timescale of the system, the expansion proceeds at a higher rate as . For example, for the 25 percent of radius increase, , which leads to percent decrease in density, we require a mass loss of for the adiabatic case, but only for the impulsive mass loss case. Outflowing gas in our galaxies simulated with AGN driven wind feedback show much higher characteristic velocity () (Brennan et al., 2018).
Finally, core scouring by binary black hole systems can heat and expel collisionless matter from the central region the gravitational slingshot effect (Milosavljević & Merritt, 2001). The black hole scouring effect is able to produce the observed light profiles of galaxy cores (Faber et al., 1997), and its impact is found to be imprinted in recently observed massive elliptical galaxies (Thomas et al., 2016), which show a tight correlation between the sizes of the core in the observed light profile and the radii of the black hole’s sphere of influence. Our simulation incorporates black hole mergers and naturally includes the heating effect of the corresponding black hole binary orbital decays. However, the resolution in our simulation is not sufficient to capture this effect of black hole scouring in detail, as the black hole binary scouring is considered to be mainly important on length scales of pc (see Rantala et al., 2017, 2018).
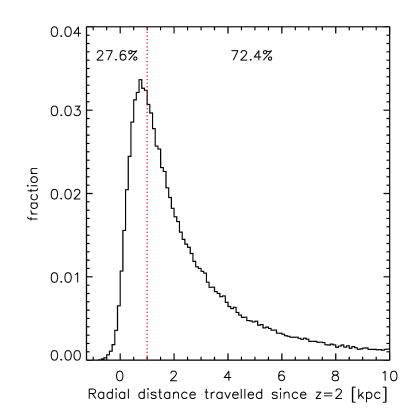
In order to check the contribution of the “puffing-up” process to the stellar core decrease, we show the histogram of stellar radial migration distance from to for all star particles which were within the central region kpc at in 30 WithAGN galaxies in Figure 5. Although there are a few star particles that travelled inward (radial travel distance ), most of stars migrate radially outwards since . Over 70 percent of star particles migrate radially outward more than 1 kpc since , that is, the majority of star particles which constituted the core at are no longer within the central region. This is primarily due to the expansion after gas ejection as discussed above. Furlong et al. (2017) also recently found such a migration of stars in their compact galaxies selected from the EAGLE simulation. They showed that this star migration from the central region of galaxies can result in the size growth of compact galaxies, but its contribution is modest, when renewed star formation and mergers dominate the size growth.
3.3. Evolution of galaxies in the sSFR- plane
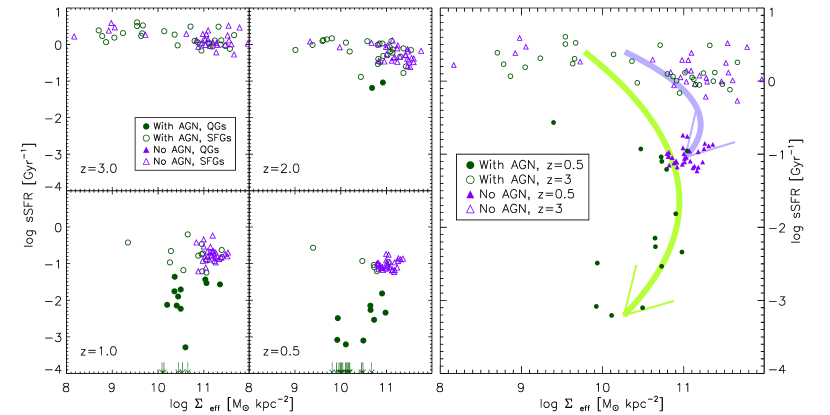
In order to study the structural evolution of galaxies and its connection to quenching of star formation, in Figure 6 we show the evolution of simulated central galaxies in the plane of specific star formation rate (sSFR) versus the effective stellar density , following Barro et al. (2013). In the left panels of Figure 6, we show sSFR and of the 30 central galaxies simulated with and without AGN feedback at , and their most massive progenitors at and . In the right panel of Figure 6, we show the average tracks of simulated galaxies in sSFR- plane for the WithAGN and NoAGN models, showing the schematic evolutionary tracks with the arrows. At , all progenitor galaxies simulated with and without AGN feedback are distributed horizontally in the sSFR- plane, with almost constant sSFR over a broad range in . By galaxies in both models move toward the right, becoming more compact. Note that we see this “compaction” trend even before galaxies start to quench, presumably due to dissipative processes such as gas rich mergers and disk instabilities (Zolotov et al., 2015; Tacchella et al., 2016). By , the galaxies simulated with AGN feedback show a rapid decline in sSFR, moving downwards in the diagram rapidly, as the quenching time scale is very short (see Pandya et al., 2017). NoAGN galaxies also show a decline in their sSFR, but the changes are much smaller and slower, and they do not decline below . After star formation is quenched, galaxies simulated with AGN decrease their stellar densities, moving toward the left on the sSFR- plane, while galaxies simulated without AGN feedback show a relatively small decrease in their stellar density.
We note that galaxies simulated with AGN feedback evolve along a strikingly similar evolutionary track to the one suggested by Barro et al. (2013, see their Figure 6). They characterized the structural evolution of galaxies in the plane, and showed that galaxies follow three sequences, (1) star-forming and diffuse galaxies transformed into compact star forming galaxies via multiple dissipative processes, (2) compact star forming galaxies turned into compact quiescent galaxies by rapid quenching of star formation, and finally, (3) in compact quiescent galaxies the galaxy sizes are extended via the gradual growth and expansion due to multiple dry mergers. The galaxies simulated with AGN feedback show a similar ‘clockwise’ evolutionary track and similar transitions from extended SFGs, to compact SFGs, to compact QGs, and finally to extended QGs. In contrast, the galaxies in the NoAGN simulations show much less dramatic evolution.
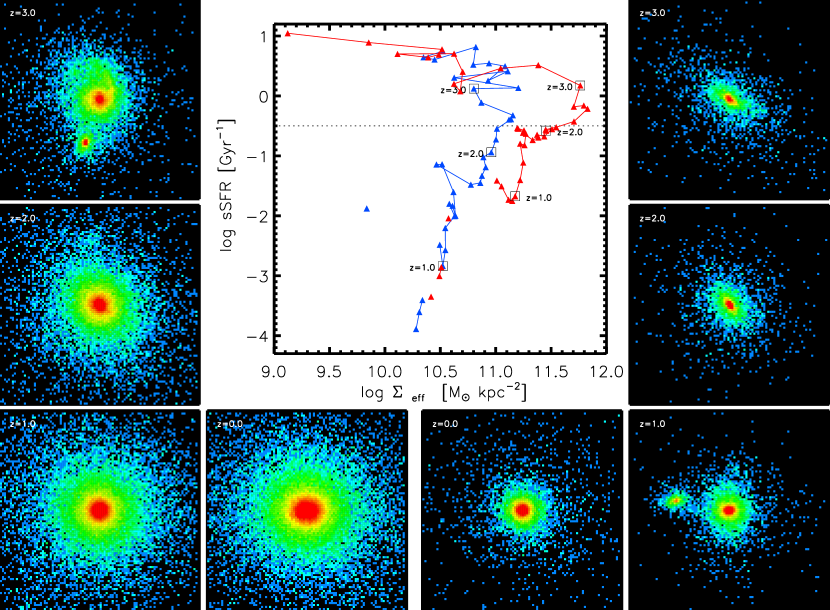
Figure 7 shows the evolution of two galaxies: we show the evolution tracks in sSFR versus in the center panel and their projected stellar density snapshots at redshift and . Again, the galaxies follow similar tracks to those shown in Barro et al. (2013). The galaxy sizes become smaller at a roughly constant specific star formation rate, and the onset of quenching again occurs at a nearly constant .
4. Summary and Discussion
We have explored the role of AGN feedback on the evolution of galaxy sizes, compactness and core densities using numerical cosmological hydrodynamical simulations with an observationally based novel sub-grid treatment of winds driven by radiatively efficient accretion onto super massive black hole. The results can be summarized as follows.
- •
- •
-
•
We also show that galaxies simulated with AGN feedback decrease their core densities after the quenching of star formation, while galaxies without AGN feedback continue to increase their core densities as well as stellar mass (Figure 4). The decrease in core density is caused by stellar mass loss as well as “puffing-up” process in response to gas mass loss (Figure 5).
We also study the evolution of galaxies in the star formation versus compactness (size) plane (Figure 6). We show the role of AGN feedback on the formation of compact quiescent galaxies at and present-day extended quiescent galaxies through the evolutionary scenario suggested by Barro et al. (2013), which can be summarized as follows.
-
1.
The formation of compact quiescent galaxies first follows an evolutionary sequence from extended star forming galaxies (upper-left) to compact star forming galaxies (upper-right) due to a dissipative process, such as highly dissipative mergers between gas-rich progenitors, which are more common at high redshift (e.g. Covington et al., 2011).
-
2.
Then the AGN feedback quenches the star formation of compact star forming galaxies and lowers their sSFR at roughly constant , populating the compact quiescent galaxy region (lower-right) rapidly.
-
3.
At later times, after in-situ star formation has been quenched, the simulated galaxies increase their stellar mass primarily by the accretion of smaller stellar systems, which leads to a strong size growth (Naab et al., 2006, 2009; Oser et al., 2012; Johansson et al., 2012; Hilz et al., 2012; Oogi & Habe, 2013; Hilz et al., 2013; Bédorf & Portegies Zwart, 2013, but see Newman et al., 2012; Nipoti et al., 2012). Minor mergers predominantly deposit materials in the outskirts of the galaxies and finally form extended quiescent galaxies populating lower-left region of sSFR- plane.
In summary, mechanical AGN feedback plays an important role in making massive galaxies red and dead, and it also plays an important role in making them extended. Including mechanical AGN feedback enhances the size growth in different ways. First of all, it has indirect, supporting but major impact, as with effective in-situ star formation quenching, it increases the fraction of accreted stars (Hirschmann et al., 2012; Dubois et al., 2013), so the impact of dry mergers is much enhanced. Moreover, since completely dry mergers are less frequent due to the high gas fractions in satellite galaxies without AGN feedback, including AGN feedback can increase the frequency of dry mergers. Secondly, it has direct but probably minor impact, as AGN-driven gas outflows can produce fluctuations of the gravitational potential and puff-up the central region. It will also enhance the adiabatic expansion in response to the slow expulsion of gas from the central region during the quiescent mode of AGN activity.
References
- Agertz et al. (2007) Agertz, O., Moore, B., Stadel, J., et al. 2007, MNRAS, 380, 963
- Arav et al. (2013) Arav, N., Borguet, B., Chamberlain, C., Edmonds, D., & Danforth, C. 2013, MNRAS, 436, 3286
- Aumer et al. (2013) Aumer, M., White, S. D. M., Naab, T., & Scannapieco, C. 2013, MNRAS, 434, 3142
- Barnes & Hernquist (1991) Barnes, J. E., & Hernquist, L. E. 1991, ApJ, 370, L65
- Barro et al. (2013) Barro, G., Faber, S. M., Pérez-González, P. G., et al. 2013, ApJ, 765, 104
- Barro et al. (2014) —. 2014, ApJ, 791, 52
- Barro et al. (2017) Barro, G., Faber, S. M., Koo, D. C., et al. 2017, ApJ, 840, 47
- Bédorf & Portegies Zwart (2013) Bédorf, J., & Portegies Zwart, S. 2013, MNRAS, 431, 767
- Bell et al. (2004) Bell, E. F., Wolf, C., Meisenheimer, K., et al. 2004, ApJ, 608, 752
- Bell et al. (2012) Bell, E. F., van der Wel, A., Papovich, C., et al. 2012, ApJ, 753, 167
- Bezanson et al. (2009) Bezanson, R., van Dokkum, P. G., Tal, T., et al. 2009, ApJ, 697, 1290
- Biermann & Shapiro (1979) Biermann, P., & Shapiro, S. L. 1979, ApJ, 230, L33
- Bluck et al. (2014) Bluck, A. F. L., Mendel, J. T., Ellison, S. L., et al. 2014, MNRAS, 441, 599
- Bluck et al. (2016) —. 2016, MNRAS, 462, 2559
- Bondi (1952) Bondi, H. 1952, MNRAS, 112, 195
- Bondi & Hoyle (1944) Bondi, H., & Hoyle, F. 1944, MNRAS, 104, 273
- Brammer et al. (2009) Brammer, G. B., Whitaker, K. E., van Dokkum, P. G., et al. 2009, ApJ, 706, L173
- Brennan et al. (2018) Brennan, R., Choi, E., Somerville, R. S., et al. 2018, ApJ, 860, 14
- Brennan et al. (2017) Brennan, R., Pandya, V., Somerville, R. S., et al. 2017, MNRAS, 465, 619
- Buitrago et al. (2008) Buitrago, F., Trujillo, I., Conselice, C. J., et al. 2008, ApJ, 687, L61
- Cappellari (2013) Cappellari, M. 2013, ApJ, 778, L2
- Cassata et al. (2011) Cassata, P., Giavalisco, M., Guo, Y., et al. 2011, ApJ, 743, 96
- Chan et al. (2018) Chan, J. C. C., Beifiori, A., Saglia, R. P., et al. 2018, ApJ, 856, 8
- Cheung et al. (2012) Cheung, E., Faber, S. M., Koo, D. C., et al. 2012, ApJ, 760, 131
- Choi et al. (2014) Choi, E., Naab, T., Ostriker, J. P., Johansson, P. H., & Moster, B. P. 2014, MNRAS, 442, 440
- Choi et al. (2012) Choi, E., Ostriker, J. P., Naab, T., & Johansson, P. H. 2012, ApJ, 754, 125
- Choi et al. (2015) Choi, E., Ostriker, J. P., Naab, T., Oser, L., & Moster, B. P. 2015, MNRAS, 449, 4105
- Choi et al. (2017) Choi, E., Ostriker, J. P., Naab, T., et al. 2017, ApJ, 844, 31
- Cimatti et al. (2008) Cimatti, A., Cassata, P., Pozzetti, L., et al. 2008, A&A, 482, 21
- Ciotti et al. (2010) Ciotti, L., Ostriker, J. P., & Proga, D. 2010, ApJ, 717, 708
- Conselice et al. (2009) Conselice, C. J., Yang, C., & Bluck, A. F. L. 2009, MNRAS, 394, 1956
- Covington et al. (2011) Covington, M. D., Primack, J. R., Porter, L. A., et al. 2011, MNRAS, 415, 3135
- Crain et al. (2015) Crain, R. A., Schaye, J., Bower, R. G., et al. 2015, MNRAS, 450, 1937
- Crenshaw & Kraemer (2012) Crenshaw, D. M., & Kraemer, S. B. 2012, ApJ, 753, 75
- Cullen & Dehnen (2010) Cullen, L., & Dehnen, W. 2010, MNRAS, 408, 669
- Daddi et al. (2005) Daddi, E., Renzini, A., Pirzkal, N., et al. 2005, ApJ, 626, 680
- Damjanov et al. (2009) Damjanov, I., McCarthy, P. J., Abraham, R. G., et al. 2009, ApJ, 695, 101
- Damjanov et al. (2011) Damjanov, I., Abraham, R. G., Glazebrook, K., et al. 2011, ApJ, 739, L44
- Dehnen & Aly (2012) Dehnen, W., & Aly, H. 2012, MNRAS, 425, 1068
- Dekel & Burkert (2014) Dekel, A., & Burkert, A. 2014, MNRAS, 438, 1870
- Dekel et al. (2009) Dekel, A., Sari, R., & Ceverino, D. 2009, ApJ, 703, 785
- Di Matteo et al. (2005) Di Matteo, T., Springel, V., & Hernquist, L. 2005, Nature, 433, 604
- Diamond-Stanic et al. (2012) Diamond-Stanic, A. M., Moustakas, J., Tremonti, C. A., et al. 2012, ApJ, 755, L26
- Dubois et al. (2013) Dubois, Y., Gavazzi, R., Peirani, S., & Silk, J. 2013, MNRAS, 433, 3297
- Dubois et al. (2016) Dubois, Y., Peirani, S., Pichon, C., et al. 2016, MNRAS, 463, 3948
- Durier & Dalla Vecchia (2012) Durier, F., & Dalla Vecchia, C. 2012, MNRAS, 419, 465
- Faber et al. (1997) Faber, S. M., Tremaine, S., Ajhar, E. A., et al. 1997, AJ, 114, 1771
- Faber et al. (2007) Faber, S. M., Willmer, C. N. A., Wolf, C., et al. 2007, ApJ, 665, 265
- Fabian (1994) Fabian, A. C. 1994, Annual Review of Astronomy and Astrophysics, 32, 277
- Fan et al. (2008) Fan, L., Lapi, A., De Zotti, G., & Danese, L. 2008, ApJ, 689, L101
- Fang et al. (2013) Fang, J. J., Faber, S. M., Koo, D. C., & Dekel, A. 2013, ApJ, 776, 63
- Ferguson et al. (2004) Ferguson, H. C., Dickinson, M., Giavalisco, M., et al. 2004, ApJ, 600, L107
- Franx et al. (2008) Franx, M., van Dokkum, P. G., Schreiber, N. M. F., et al. 2008, ApJ, 688, 770
- Furlong et al. (2017) Furlong, M., Bower, R. G., Crain, R. A., et al. 2017, MNRAS, 465, 722
- Gammie (2001) Gammie, C. F. 2001, ApJ, 553, 174
- Genel et al. (2014) Genel, S., Vogelsberger, M., Springel, V., et al. 2014, MNRAS, 445, 175
- Genel et al. (2018) Genel, S., Nelson, D., Pillepich, A., et al. 2018, MNRAS, 474, 3976
- Gibson et al. (2009) Gibson, R. R., Jiang, L., Brandt, W. N., et al. 2009, ApJ, 692, 758
- Haardt & Madau (2001) Haardt, F., & Madau, P. 2001, in Clusters of Galaxies and the High Redshift Universe Observed in X-rays, ed. D. M. Neumann & J. T. V. Tran
- Hills (1980) Hills, J. G. 1980, ApJ, 235, 986
- Hilz et al. (2013) Hilz, M., Naab, T., & Ostriker, J. P. 2013, MNRAS, 429, 2924
- Hilz et al. (2012) Hilz, M., Naab, T., Ostriker, J. P., et al. 2012, MNRAS, 425, 3119
- Hirschmann et al. (2012) Hirschmann, M., Naab, T., Somerville, R. S., Burkert, A., & Oser, L. 2012, MNRAS, 419, 3200
- Hirschmann et al. (2013) Hirschmann, M., Naab, T., Davé, R., et al. 2013, MNRAS, 436, 2929
- Hopkins (2013) Hopkins, P. F. 2013, MNRAS, 428, 2840
- Hopkins et al. (2010) Hopkins, P. F., Bundy, K., Hernquist, L., Wuyts, S., & Cox, T. J. 2010, MNRAS, 401, 1099
- Hopkins et al. (2006) Hopkins, P. F., Hernquist, L., Cox, T. J., Robertson, B., & Springel, V. 2006, ApJS, 163, 50
- Hoyle & Lyttleton (1939) Hoyle, F., & Lyttleton, R. A. 1939, Proceedings of the Cambridge Philosophical Society, 34, 405
- Hu et al. (2014) Hu, C.-Y., Naab, T., Walch, S., Moster, B. P., & Oser, L. 2014, MNRAS, 443, 1173
- Iwamoto et al. (1999) Iwamoto, K., Brachwitz, F., Nomoto, K., et al. 1999, ApJS, 125, 439
- Janka (2012) Janka, H.-T. 2012, Annual Review of Nuclear and Particle Science, 62, 407
- Johansson et al. (2012) Johansson, P. H., Naab, T., & Ostriker, J. P. 2012, ApJ, 754, 115
- Karakas (2010) Karakas, A. I. 2010, MNRAS, 403, 1413
- Kauffmann et al. (2003) Kauffmann, G., Heckman, T. M., White, S. D. M., et al. 2003, MNRAS, 341, 54
- Kroupa (2001) Kroupa, P. 2001, MNRAS, 322, 231
- Lackner et al. (2012) Lackner, C. N., Cen, R., Ostriker, J. P., & Joung, M. R. 2012, MNRAS, 425, 641
- Leitner & Kravtsov (2011) Leitner, S. N., & Kravtsov, A. V. 2011, ApJ, 734, 48
- Longhetti et al. (2007) Longhetti, M., Saracco, P., Severgnini, P., et al. 2007, MNRAS, 374, 614
- López-Sanjuan et al. (2013) López-Sanjuan, C., Le Fèvre, O., Tasca, L. A. M., et al. 2013, A&A, 553, A78
- Lotz et al. (2011) Lotz, J. M., Jonsson, P., Cox, T. J., et al. 2011, ApJ, 742, 103
- Magorrian et al. (1998) Magorrian, J., Tremaine, S., Richstone, D., et al. 1998, AJ, 115, 2285
- Martizzi et al. (2013) Martizzi, D., Teyssier, R., & Moore, B. 2013, MNRAS, 432, 1947
- Martizzi et al. (2012) Martizzi, D., Teyssier, R., Moore, B., & Wentz, T. 2012, MNRAS, 422, 3081
- Milosavljević & Merritt (2001) Milosavljević, M., & Merritt, D. 2001, ApJ, 563, 34
- Moe et al. (2009) Moe, M., Arav, N., Bautista, M. A., & Korista, K. T. 2009, ApJ, 706, 525
- Muzzin et al. (2013) Muzzin, A., Marchesini, D., Stefanon, M., et al. 2013, ApJ, 777, 18
- Naab et al. (2009) Naab, T., Johansson, P. H., & Ostriker, J. P. 2009, ApJ, 699, L178
- Naab et al. (2006) Naab, T., Khochfar, S., & Burkert, A. 2006, ApJ, 636, L81
- Naab & Ostriker (2017) Naab, T., & Ostriker, J. P. 2017, ARA&A, 55, 59
- Newman et al. (2012) Newman, A. B., Ellis, R. S., Bundy, K., & Treu, T. 2012, ApJ, 746, 162
- Newman et al. (2010) Newman, A. B., Ellis, R. S., Treu, T., & Bundy, K. 2010, ApJ, 717, L103
- Nipoti et al. (2009) Nipoti, C., Treu, T., Auger, M. W., & Bolton, A. S. 2009, ApJ, 706, L86
- Nipoti et al. (2012) Nipoti, C., Treu, T., Leauthaud, A., et al. 2012, MNRAS, 422, 1714
- Núñez et al. (2017) Núñez, A., Ostriker, J. P., Naab, T., et al. 2017, ApJ, 836, 204
- Omand et al. (2014) Omand, C. M. B., Balogh, M. L., & Poggianti, B. M. 2014, MNRAS, 440, 843
- Oogi & Habe (2013) Oogi, T., & Habe, A. 2013, MNRAS, 428, 641
- Oser et al. (2012) Oser, L., Naab, T., Ostriker, J. P., & Johansson, P. H. 2012, ApJ, 744, 63
- Oser et al. (2010) Oser, L., Ostriker, J. P., Naab, T., Johansson, P. H., & Burkert, A. 2010, ApJ, 725, 2312
- Pandya et al. (2017) Pandya, V., Brennan, R., Somerville, R. S., et al. 2017, MNRAS, 472, 2054
- Patel et al. (2013) Patel, S. G., van Dokkum, P. G., Franx, M., et al. 2013, ApJ, 766, 15
- Pontzen & Governato (2012) Pontzen, A., & Governato, F. 2012, MNRAS, 421, 3464
- Porter et al. (2014) Porter, L. A., Somerville, R. S., Primack, J. R., & Johansson, P. H. 2014, MNRAS, 444, 942
- Proga & Kallman (2004) Proga, D., & Kallman, T. R. 2004, ApJ, 616, 688
- Rantala et al. (2018) Rantala, A., Johansson, P. H., Naab, T., Thomas, J., & Frigo, M. 2018, ArXiv e-prints, arXiv:1805.10295
- Rantala et al. (2017) Rantala, A., Pihajoki, P., Johansson, P. H., et al. 2017, ApJ, 840, 53
- Read & Hayfield (2012) Read, J. I., & Hayfield, T. 2012, MNRAS, 422, 3037
- Ritchie & Thomas (2001) Ritchie, B. W., & Thomas, P. A. 2001, MNRAS, 323, 743
- Rodriguez-Gomez et al. (2016) Rodriguez-Gomez, V., Pillepich, A., Sales, L. V., et al. 2016, MNRAS, 458, 2371
- Saitoh & Makino (2009) Saitoh, T. R., & Makino, J. 2009, ApJ, 697, L99
- Saitoh & Makino (2013) —. 2013, ApJ, 768, 44
- Sazonov et al. (2005) Sazonov, S. Y., Ostriker, J. P., Ciotti, L., & Sunyaev, R. A. 2005, MNRAS, 358, 168
- Sazonov et al. (2004) Sazonov, S. Y., Ostriker, J. P., & Sunyaev, R. A. 2004, MNRAS, 347, 144
- Shen et al. (2003) Shen, S., Mo, H. J., White, S. D. M., et al. 2003, MNRAS, 343, 978
- Somerville & Davé (2015) Somerville, R. S., & Davé, R. 2015, ARA&A, 53, 51
- Spergel et al. (2007) Spergel, D. N., Bean, R., Doré, O., et al. 2007, ApJS, 170, 377
- Springel (2005) Springel, V. 2005, MNRAS, 364, 1105
- Springel et al. (2005) Springel, V., Di Matteo, T., & Hernquist, L. 2005, MNRAS, 361, 776
- Stewart et al. (2009) Stewart, K. R., Bullock, J. S., Barton, E. J., & Wechsler, R. H. 2009, ApJ, 702, 1005
- Stone et al. (2017) Stone, N. C., Küpper, A. H. W., & Ostriker, J. P. 2017, MNRAS, 467, 4180
- Strömgren (1939) Strömgren, B. 1939, ApJ, 89, 526
- Szomoru et al. (2010) Szomoru, D., Franx, M., van Dokkum, P. G., et al. 2010, ApJ, 714, L244
- Tacchella et al. (2016) Tacchella, S., Dekel, A., Carollo, C. M., et al. 2016, MNRAS, 458, 242
- Taylor et al. (2010) Taylor, E. N., Franx, M., Glazebrook, K., et al. 2010, ApJ, 720, 723
- Thomas et al. (2016) Thomas, J., Ma, C.-P., McConnell, N. J., et al. 2016, Nature, 532, 340
- Toft et al. (2007) Toft, S., van Dokkum, P., Franx, M., et al. 2007, ApJ, 671, 285
- Trujillo et al. (2007) Trujillo, I., Conselice, C. J., Bundy, K., et al. 2007, MNRAS, 382, 109
- Trujillo et al. (2004) Trujillo, I., Rudnick, G., Rix, H.-W., et al. 2004, ApJ, 604, 521
- van de Sande et al. (2013) van de Sande, J., Kriek, M., Franx, M., et al. 2013, ApJ, 771, 85
- van der Wel et al. (2014) van der Wel, A., Franx, M., van Dokkum, P. G., et al. 2014, ApJ, 788, 28
- van Dokkum et al. (2008) van Dokkum, P. G., Franx, M., Kriek, M., et al. 2008, ApJ, 677, L5
- van Dokkum et al. (2010) van Dokkum, P. G., Whitaker, K. E., Brammer, G., et al. 2010, ApJ, 709, 1018
- van Dokkum et al. (2014) van Dokkum, P. G., Bezanson, R., van der Wel, A., et al. 2014, ApJ, 791, 45
- van Dokkum et al. (2015) van Dokkum, P. G., Nelson, E. J., Franx, M., et al. 2015, ApJ, 813, 23
- Volonteri (2010) Volonteri, M. 2010, A&A Rev., 18, 279
- Weinberger et al. (2017) Weinberger, R., Springel, V., Hernquist, L., et al. 2017, MNRAS, 465, 3291
- Wellons et al. (2015) Wellons, S., Torrey, P., Ma, C.-P., et al. 2015, MNRAS, 449, 361
- Wiersma et al. (2009) Wiersma, R. P. C., Schaye, J., & Smith, B. D. 2009, MNRAS, 393, 99
- Williams et al. (2009) Williams, R. J., Quadri, R. F., Franx, M., van Dokkum, P., & Labbé, I. 2009, ApJ, 691, 1879
- Williams et al. (2010) Williams, R. J., Quadri, R. F., Franx, M., et al. 2010, ApJ, 713, 738
- Woosley & Weaver (1995) Woosley, S. E., & Weaver, T. A. 1995, ApJS, 101, 181
- Wuyts et al. (2011) Wuyts, S., Förster Schreiber, N. M., Lutz, D., et al. 2011, ApJ, 738, 106
- Zolotov et al. (2015) Zolotov, A., Dekel, A., Mandelker, N., et al. 2015, MNRAS, 450, 2327