Limits of surface analysis of thin film compounds using LEIS
Abstract
Low Energy Ion Scattering (LEIS) was employed to study the surface composition of thin films of Ru on B, C and B4C films at different stages of growth. Effects of surface segregation of C were observed. Previously unknown matrix effects were observed in these samples, expressed in the decrease of LEIS signals of Ru, B and C at low Ru concentrations. The effect disappears for Ru-rich surfaces. Measurements with different He+ ion energies prove that the characteristic velocities of the elements involved change with surface composition. We suggest that these matrix effects appear due to the changes in neutralization efficiency in quasiresonant neutralization from the valence band (VB-qRN). This neutralization channel is present in elemental C and B due to a wide valence band with energy states as low as -20 eV, which are in a (quasi-)resonance with the He 1s level. This mechanism was earlier reported for graphitic carbon. We suggest that it can be applied to a much wider range of materials, leading to potential matrix effects in LEIS from a variety of surfaces, containing B, C and potentially O and N atoms, e.g. borides, carbides, oxides and nitrides, as well as alloys with B and C. This hypothesis is supported by additional LEIS measurements on oxidized Ru which show matrix effect in Ru-O LEIS signals as well. We argue that it is possible to avoid the matrix effects from compounded surfaces within certain ranges of composition by a proper choice of reference samples, while for other compositions knowledge of characteristic velocities is required for reliable quantification.
1 Introduction
Low Energy Ion Scattering (LEIS) is a surface analysis technique with extremely low information depth, normally only the topmost atomic layer [1, 2, 3]. Extreme surface sensitivity is given by very efficient neutralization processes of noble gas ions with energies below 8 keV. The downside of this is the dependence of the LEIS signal on neutralization efficiency. Usually the neutralization efficiency of He+ from a given surface atom does not depend on the surrounding atoms, in which case quantification of surface composition with LEIS is possible by comparing LEIS signals between given a sample and a reference sample with known surface composition and density [1]. However, occasionally neutralization processes and therefore LEIS signals can depend on the surrounding atoms. This phenomenon is called a matrix effect, and it can severely complicate the surface quantification. It is often considered that cases of matrix effects are few and limited to very specific situations.
In an earlier paper LEIS was used for studying the growth process of magnetron sputtered thin films of Ru on amorphous Si [4]. In this paper we extend this research to growth of thin films of Ru on several other amorphous substrates, namely B, C and B4C. The application of Ru thin films include catalysis [5], seeding and substrate layers for Cu [6, 7] or graphene [8, 9], bottom and top electrodes for DRAM capacitors [10]. Growth of Ru thin films on B, C and B4C substrates is important for a variety of multilayer structures for reflection of soft and hard X-Rays [11, 12, 13]. Interface width and composition of such systems is important to their performance, therefore they can benefit from the development of new techniques of thin film interface analysis.
Analogous to the LEIS studies of the Ru/Si combination [4], the thin film deposition and LEIS measurements were performed without breaking vacuum. This allows to perform almost in-situ quantification of the surface composition for different thicknesses of Ru, and therefore compose a deposition depth profile (growth profile) [4], as opposed to the more conventional sputter depth profile, which is produced by removing the top layer by sputtering and is consequently affected by sputter-induced intermixing and preferential sputtering.
An important aspect of this paper is related to the discovery of new matrix effects in Ru-B and Ru-C material combinations, and the limitations that these matrix effects impose on the quantification of Ru-B and Ru-C based thin films. We also study the origin of these matrix effects on the example of the Ru-B combination, and further extrapolate the findings to a much wider range of compounds. The results of this work are separated into two parts. In the first part (Section 3), LEIS measurements with 3 keV He+ for different Ru thicknesses are used to obtain deposition depth profiles, but it becomes evident that in a thickness range below 1 nm the quantification procedure cannot be trusted. In the second part of the paper (Section 4), the suspected matrix effect is studied for the Ru-B system by measuring LEIS signals at different energies.
2 Experimental
All samples studied in this work have been produced in a home-designed UHV magnetron sputtering chamber with a base pressure up to mbar and target-to-substrate distance of 8.6 cm. Depositions were performed with mbar of Kr as a sputter gas. DC magnetron sputtering was used for Ru, B4C and C, while RF magnetron sputtering was chosen for B and Si. The thicknesses of the deposited thin films were controlled by quartz crystal microbalances (QCM). QCM readings were calibrated in advance, using a set of calibration thin films of which the thicknesses were extracted from fitting of CuK Grazing Incidence X-Ray Reflectivity curves.
The deposition chamber was connected with a UHV transfer system to the LEIS chamber, sample transfer taking about 10 minutes between the deposition and the measurement. The LEIS setup was a Qtac100 instrument by ION-TOF, with a base pressure down to mbar, equipped with a double toroidal electrostatic analyzer and an electron impact ion source, with ion incidence angle normal to the surface of a sample and a scattering angle of 145∘. All LEIS spectra are obtained with He+ primary ions. The default He+ energy was 3 keV, and in a separate set of experiments with varied ion energies He+ ions from 1 to 5 keV were used. Typical ion current during analysis was 1 - 4 nA. Whenever ion sputtering was performed, a separate ion gun with 0.5 keV Ar+ ions at angle of incidence of 59∘ and ion current of 100 nA was used.
To obtain the deposition depth profiles for Ru on B, B4C and C a series of samples with a varied thickness of Ru layer was produced for each material combination. The general composition of samples was the following: the initial substrate was a superpolished Si wafer covered with its native oxide, then it was covered with 4 nm of amorphous Si, then 5 nm of the chosen substrate layer (B, C or B4C), then 0 – 35 nm of Ru. Immediately after deposition each sample was transferred to the LEIS chamber and analyzed, the delay between deposition and analysis was within 10 – 15 minutes. The results of these measurements are presented below.
It is worth noting that we distinguish individual samples of each series by the as-deposited thickness of Ru film, which is obtained from calibrated signal of a quartz crystal microbalance. Due to interaction of Ru with its substrate the density of the grown film is different from a bulk Ru film used for calibration. Therefore, the as-deposited Ru thickness is not equal to the actual Ru film thickness, but instead serves as a measure of the deposited amount of Ru.
3 LEIS measurements with 3 keV He+
3.1 LEIS spectra
Raw LEIS spectra of each material combination are shown in Fig. 1. Each spectrum has elemental surface peaks corresponding to 3 keV He+ backscattering from atoms of each element in the first atomic layer. Samples with Ru have a Ru “tail” at energies below the Ru peak, which represents scattering from Ru atoms located in deeper layers, followed by reionisation when the scattered particle leaves the surface.
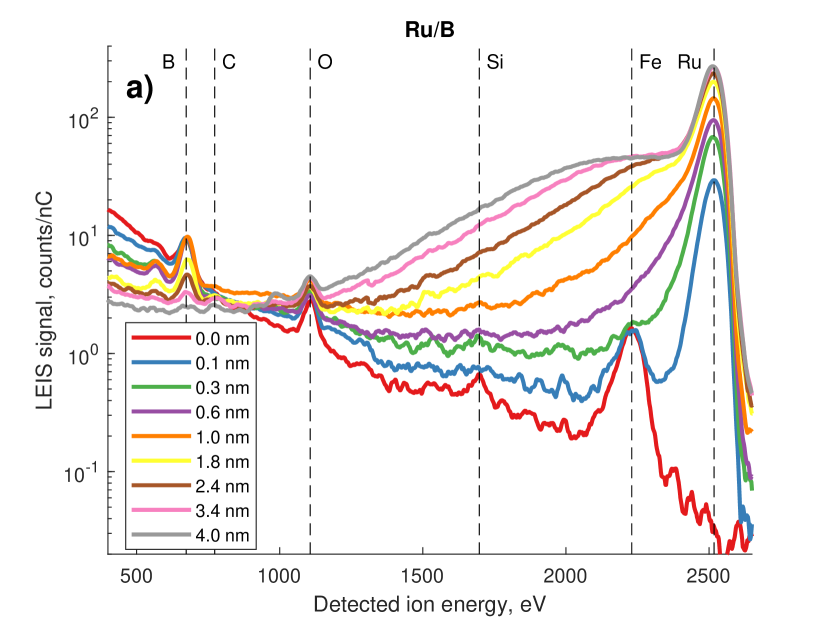
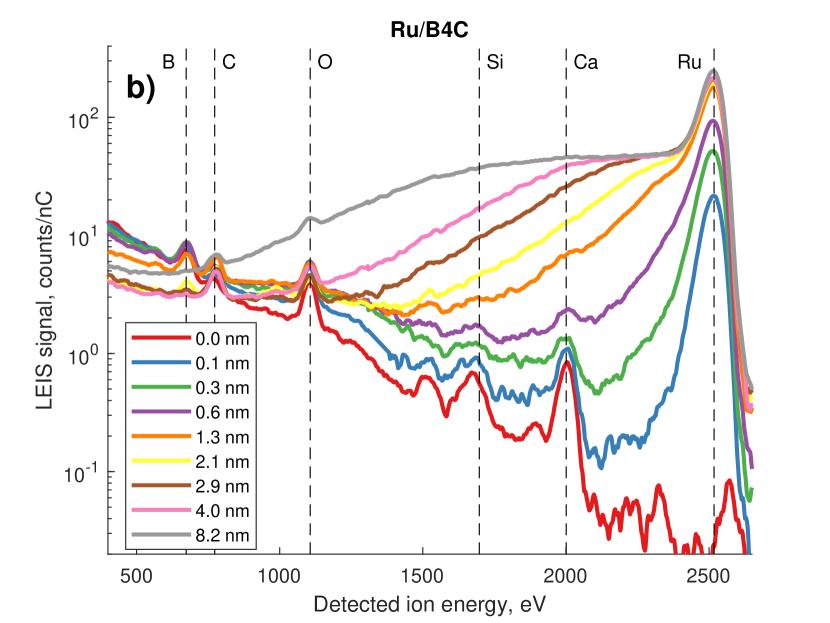
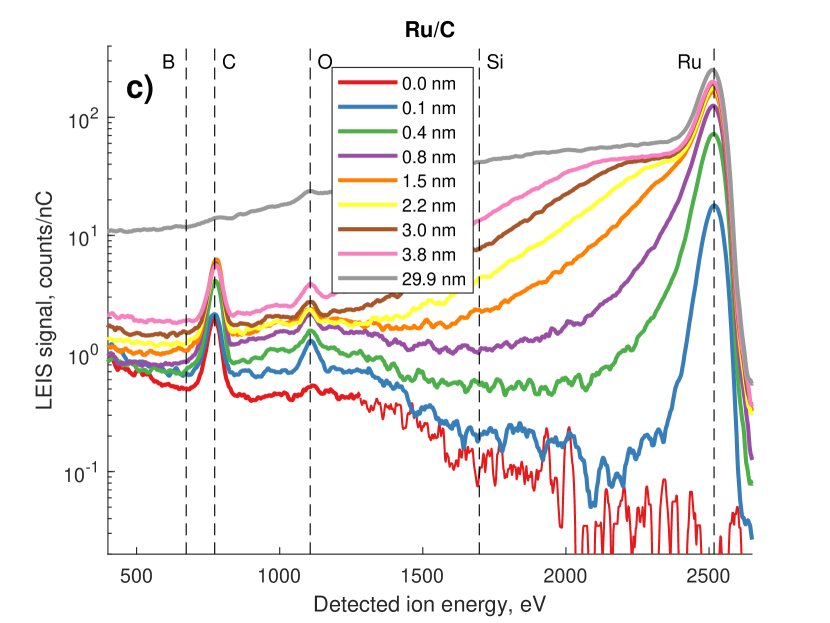
Except for three elements deposited (Ru, B, C), there are other elements observed on the surface. A small oxygen peak is always present in the spectra in roughly the same amount, suggesting a slight surface contamination during sample transfer time. B4C films have a negligible amount of Ca contamination, which may be present due to machining of the B4C target and is only visible on the surface of B4C due to the low surface energy of Ca [14]. Boron substrate films have some Fe contamination, which can be expected to happen in a stainless steel chamber with a stainless steel magnetron chimney due to the non-localized nature of the plasma during RF magnetron sputtering. Finally, most spectra feature a background exponentially rising at lower energies, which consists of ions that were sputtered from the sample surface by He+ ions.
3.2 Surface peaks in LEIS spectra
The integral area of a surface peak of an element i, expressed in counts per primary ion dose (here counts/nC), is given by the following equation [1]:
| (1) |
where is the electron charge, is the analyzer and detector instrumental factor, is a roughness factor, is the ion fraction, is the differential cross-section in area per solid angle and is the surface atomic density in (atoms/area). The quantification of surface composition is simple when most of these parameters are constant or known. In the ideal case, we expect . Such proportionality is obtained under the following assumptions. First, , because the same setup is used for the measurements, and analyzer and detector configurations are fixed. Second, and only depends on the ion-target atom combination, scattering geometry and ion energy. Third, as long as our thin films do not exhibit island growth, and we mostly deal with amorphous surfaces, we can assume . This factor is most probably (slightly) varying during growth, but without additional in-situ information of high frequency roughness development we have assumed a constant roughness. Finally, in the absence of matrix effects if measurements are done at the same energy. The involvement of matrix effects will be a subject of the Section 4.
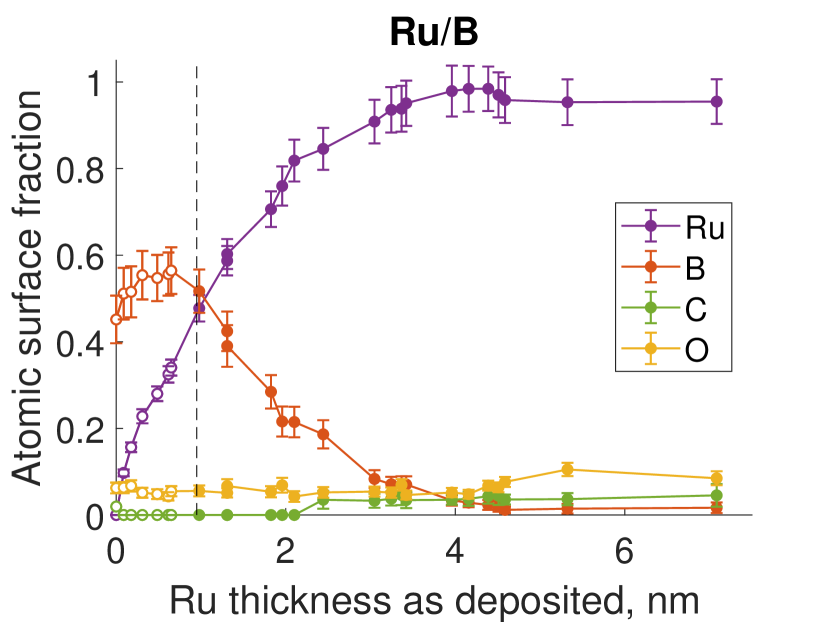
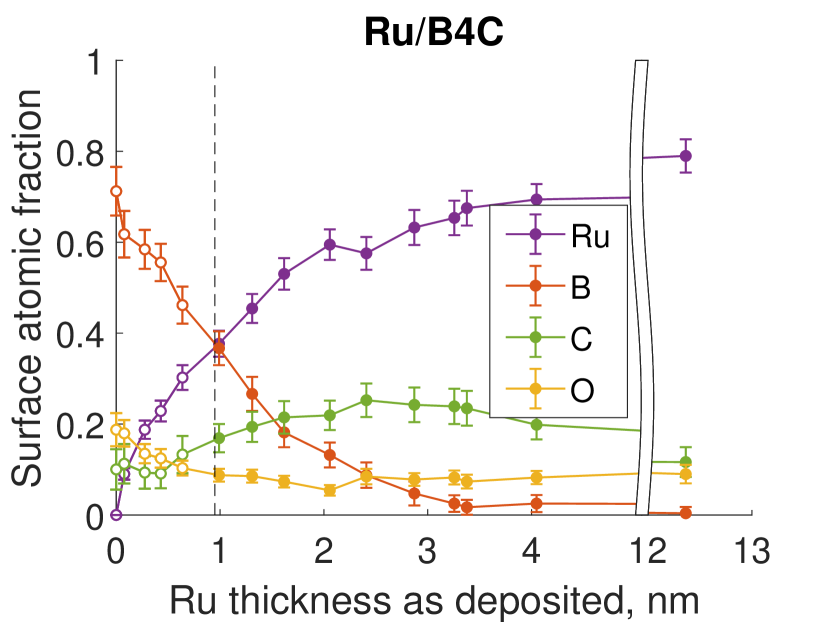
When matrix effects are absent, the incident ion energies are fixed and roughness is constant, Eq. 1 becomes a simple proportionality . Following Brongersma et. al. [1], we convert into surface coverage . Another surface quantity is the surface atomic fraction . The surface atomic fraction is a more representative quantity than surface coverage , because by definition, while only in absence of compaction/expansion during compound formation.
To calculate , and we need and of every element present in the spectra. Reference samples with sputter cleaned surfaces of Ru, B and C were prepared to obtain , and . Using this method, we obtain counts/nC, counts/nC and counts/nC. However, we will see in the next paragraph that there are problems with the obtained this way. The values of and were taken from reference [4]. Surface atomic densities for other elements were taken as 95% of their tabulated bulk values to account for the less dense films formed by magnetron sputtering.
Before calculation of , and we can perform an internal calibration of , and with the help of a so-called “matrix effect check”, in which two LEIS signals are plotted against each other. If we ignore a minor contribution of O contamination, Ru-C and Ru-B become binary systems, and in the absence of matrix effects and compaction/expansion we expect and . “Matrix effect checks” for the Ru-C and Ru-B pairs are shown in Fig. 2, where they are compared with the “matrix effect check” for the Ru-Si pair [4]. Ru-Si pair exhibits a behavior very close to linear: . The Ru-C pair exhibits more complicated behavior: at low Ru coverages both Ru and C signals increase together, but after approximately 50% Ru coverage it switches to the same linear dependence as the Ru-Si pair. The behavior of the Ru-B pair has similarity with the Ru-C pair.
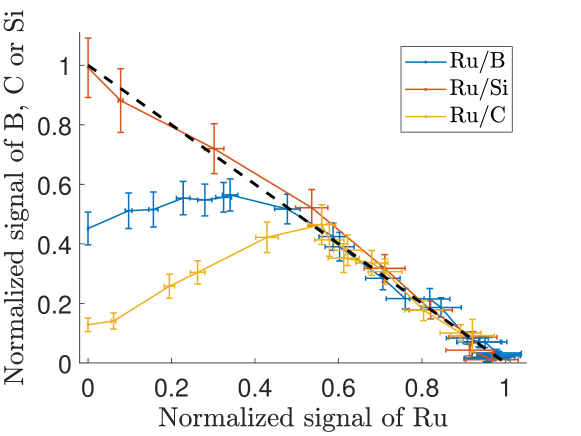
A strong non-linear behavior suggests the presence of a matrix effect. The proper way to study matrix effects involves measuring LEIS signals with different ion energies, which will be done in Section 4. Before the detailed study we can already assume that there are two different regimes of behavior of Ru-C and Ru-B curves in Fig. 2, separated by certain critical amount of Ru , achieved at nm of Ru. Any measurement that falls on the left side of the curve is suspected to have a matrix effect, and any measurement on the right side follows a straight line, which is expected in absence of matrix effects. If this assumption is correct, the right side of the curve can be used for internal calibration of and when not affected by the matrix effect.
For the Ru-C pair, the extrapolation gives counts/nC and counts/nC. The value for Ru is not very different from a clean sputtered reference, however for C the difference is almost 8 times. These references values can be used to quantify the linear part of the Ru-C binary system. For the Ru-B pair we extract counts/nC and counts/nC. The new reference value for B is two times higher than the original. For Ru/B4C samples we use the reference signals of Ru, B and C as for Ru/B and Ru/C separately.
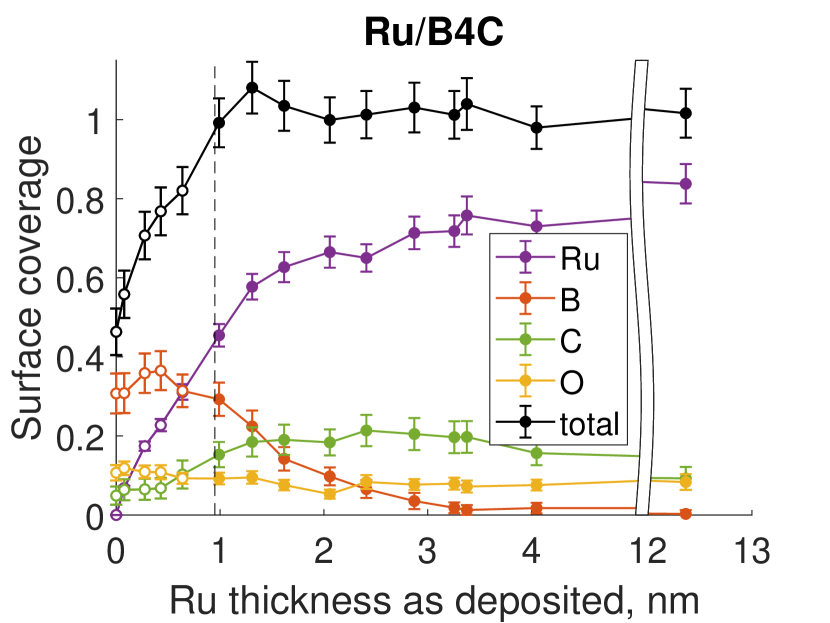
3.3 Deposition depth profiles
After the discussion of the aspects of quantification of the surface composition, we demonstrate the deposition depth profiles of Ru on different substrates (Fig. 3). Both surface coverages and surface atomic fractions for each element are presented. All data points that are subject to matrix effect are marked differently, and not used in the discussion. There are several observations to be made from these depth profiles. The fraction of Ru on the surface is monotonously increasing with the amount of Ru, the fraction of the substrate atoms is monotonously dropping – B in Ru/B, C in Ru/C, fractions of B and C added together in Ru/B4C.
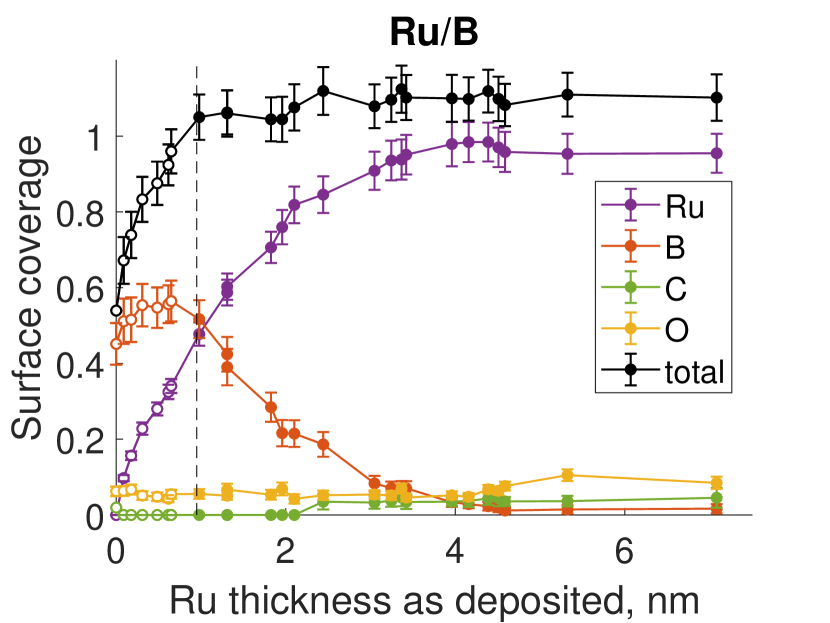
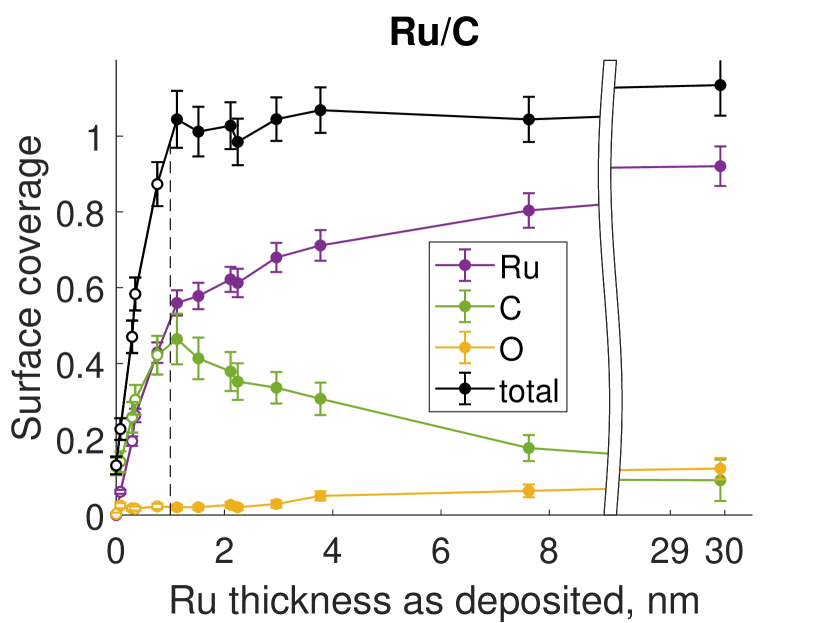
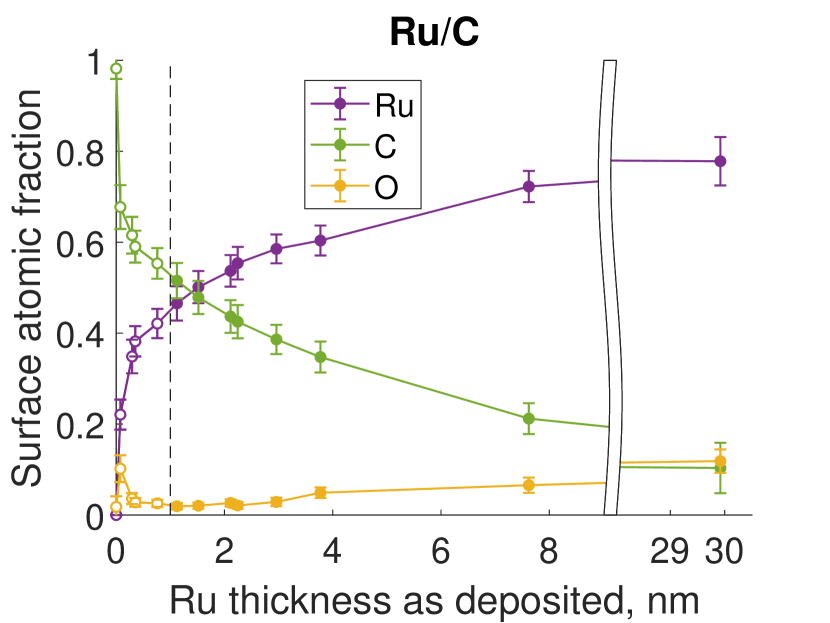
It is unexpected that these changes are occurring relatively slow – in the worst case, i.e. in Ru/C, some carbon atoms are still visible after 30 nm of Ru is deposited on top of the C film. There are three possible explanations: it can be caused an extremely deep intermixing, growth of Ru in large islands, or surface segregation of C. Island growth is disproved by AFM measurements of the samples at different stages of growth. The root mean squared roughness was measured from 1.5 and 15 nm Ru films on C, B and B4C. All of these samples exhibited stochastic roughness with an RMS value from 0.14 to 0.21 nm, similar to the initial substrate roughness, or to Ru grown on Si [4]. Therefore, island growth modes can be excluded.
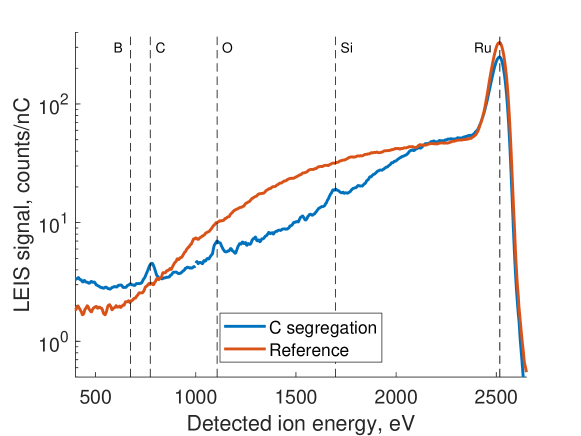
To prove that a very slow disappearance of C from the surface cannot be explained by simple intermixing of C with Ru, we created a sample with a drastically reduced amount of C. A thickness of 3.2 nm of Ru was deposited on top of 0.4 nm of B4C on a Si substrate. The LEIS spectrum of the surface of this sample is shown in Fig. 4. The surface coverage of C in this spectrum is about 10%. A simple estimation shows that if all of the C atoms from the B4C layer were spread homogenously in the Ru layer, it would result in 3% volume concentration of C. This means that the C content within the Ru film cannot be constant or decaying toward the surface, but must increase at some point. Therefore, a surface segregation phenomenon is required to explain the observed effect.
The surface segregation of C on Ru is a well-known phenomenon in graphene growth [9], and we can apply it to Ru on C growth as well. Even after the interface transition from C to Ru is finished and the Ru layer becomes bulk, some C still continues to stay on the surface, only very slowly dissolving in the Ru matrix under the incoming flux of Ru atoms. Previous experiments [4] showed that Si is also segregating on top of Ru. We cannot exclude the possibility of surface segregation of B as well.
Another notable feature, which we will call “uplifting”, is related to the behavior of C is found in Ru/B4C deposition depth profiles (Fig. 3). While the fraction of Ru increases and the fraction of B decreases, the fraction of C has a more complex behavior – initially it increases, and only starts to drop when B disappears. This effect goes well beyond the thickness range involved in the matrix effect. We can assume that this feature is associated to surface segregation of C as well. If we assume that surface segregation only occurs on certain sites on a Ru surface, then the initial increase of the C signal is associated with the increase of the amount of the available sites. Upward diffusion of C atoms slows down with increasing thickness of the Ru layer, and after nm of Ru it is overcome by the process of removal of already segregated C atoms by arriving flux of fresh Ru atoms.
Due to the fact that B and C fractions behave independently in Fig. 3, we conclude that B4C is decomposing during the deposition of Ru. Decomposition of B4C was already shown by XPS studies of this layer system [15].
The last observation from Fig. 3 is about the presence of C in the Ru/B deposition depth profile. In a pure B sample there is no detectable amount of C, but a small and nevertheless certain amount of C appears after 2 nm of Ru are deposited (also beyond the thickness range involved in the matrix effect). For comparison, no C signal was detected in Ru/Si growth [4]. The B target that was used for deposition always has 1-3% C doping. This amount of C is undetectable in a pure B sample. Its appearance in later samples is a sign of surface segregation of C on Ru, which brings C atoms to the surface.
4 LEIS measurements with different He+ energies
The matrix effects in Ru-B and Ru-C in Fig. 2 require additional attention. In this section we study the origin of matrix effects with focus on Ru-B material combination. We follow the established technique to study matrix effects in LEIS [16, 17], which we earlier used to study matrix effects in La-containing surfaces. The measure of neutralization efficiency is a so-called characteristic velocity , which is in an integrated electron transfer rate from the surface to an ion. To obtain characteristic velocity for a given ion-target combination, LEIS signal needs to be measured at different incident ion energies and then plotted as a function of ion velocity in the special coordinate set given by Eq. (5) in [17].
To measure characteristic velocity of pure Ru and pure B as reference samples, 20 nm Ru and 15 nm B thin films were deposited on Si wafers. LEIS signals of Ru or B were measured with several incident ion energies ranging from 1 to 5 keV. Before each measurement the surface was sputtered by a 0.5 keV Ar+ beam until signal saturation. The data for Ru is shown in Fig. 5 and the data for B is shown in Fig. 5. The next step was to perform similar measurements for the mixtures of Ru and B of different compositions, for which samples of 0.9 and 0.5 nm Ru on 5 nm B on Si wafer were chosen. To extend the range of measured surface compositions without depositing more samples, after the initial LEIS measurement each of these samples was sputtered with 0.5 keV Ar+ ion beam of atoms/cm2 fluence and measured again.
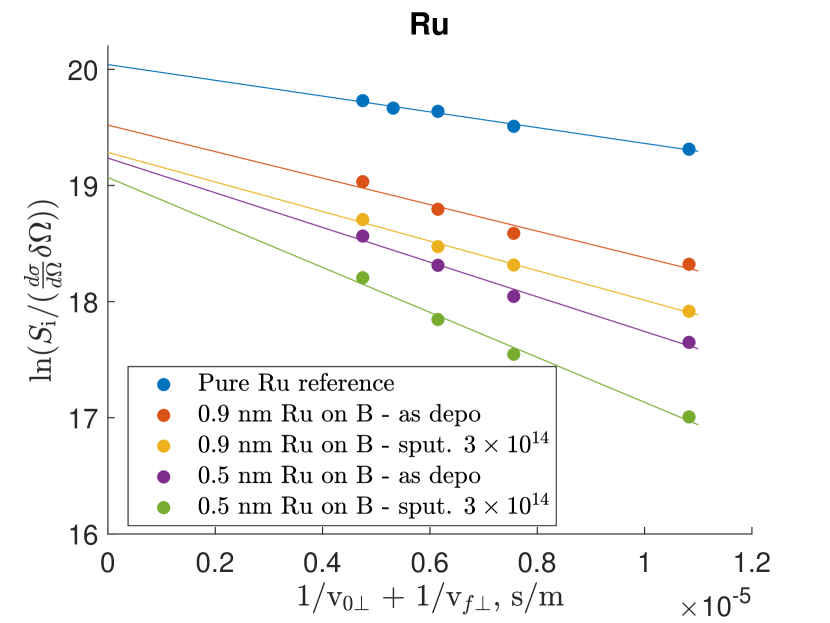
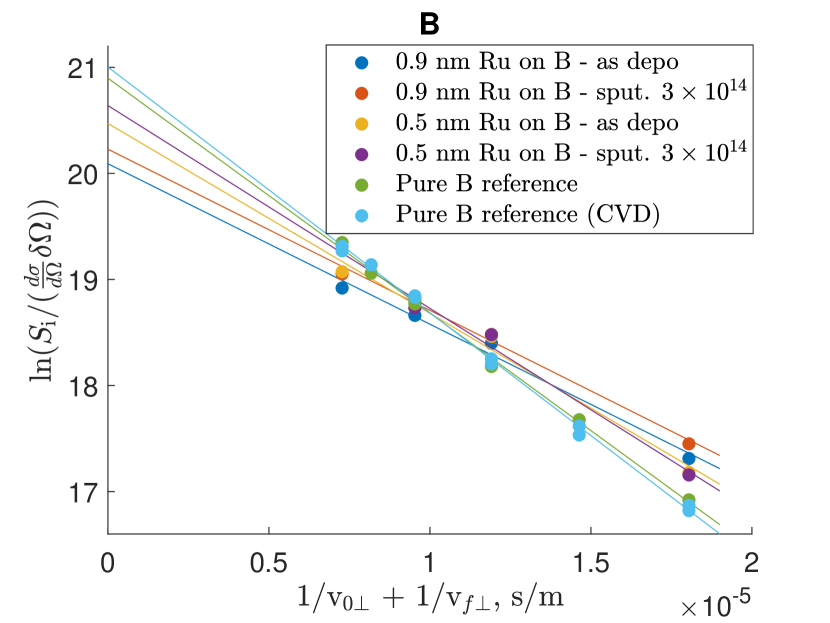
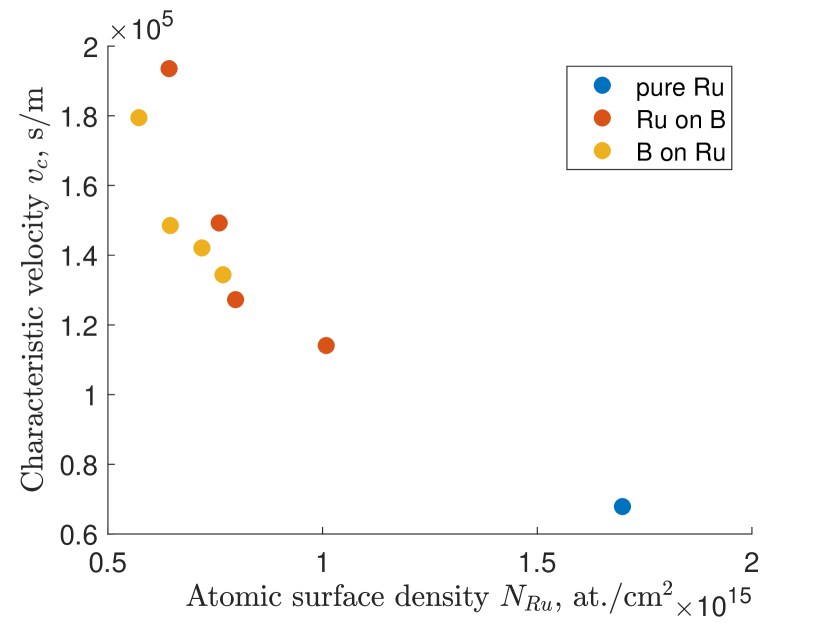
The next step of data analysis is to extract characteristic velocities and from the slopes of linear fits of the inversed velocity plots and the atomic surface densities and from the intersection points of the linear fits, following the same procedure as in [17]. The results are shown in Fig. 6 separately for Ru and for B. Additional measurements were also performed on a reverse layer system as well: a sample of 0.5 nm B on 10 nm Ru was deposited and measured in the same fashion. To achieve different surface compositions for the reverse system, instead of a single sputter step, 3 sputter steps were done: with 1.5, 3 and 4.5 atoms/cm2 fluences. The data for B/Ru films is shown in Fig. 6 as well. A simple conclusion from Fig. 6 is that the characteristic velocities of both Ru and B strongly change with the surface composition regardless of the layer ordering. This proves the existence of matrix effect in the Ru-B material combination and associates it with the composition of the surface and not a specific atomic arrangement.
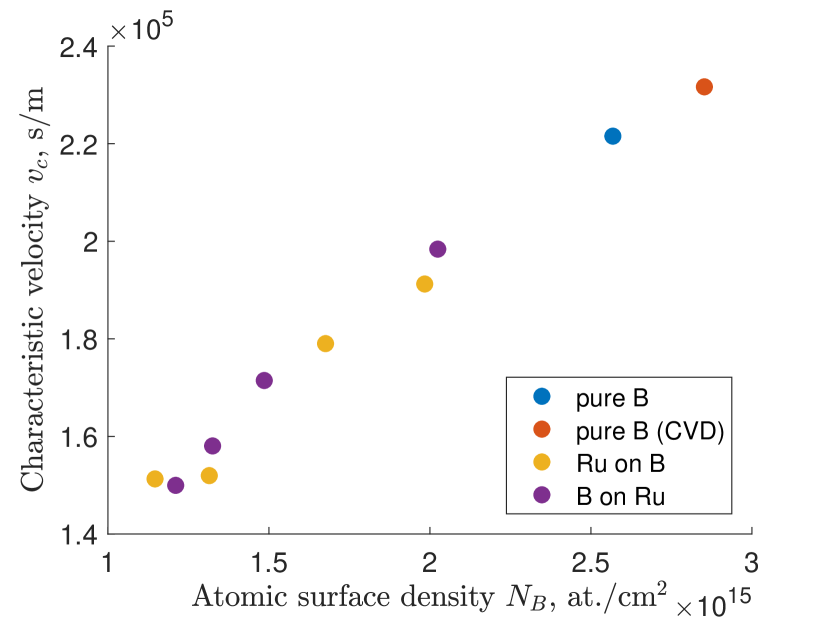
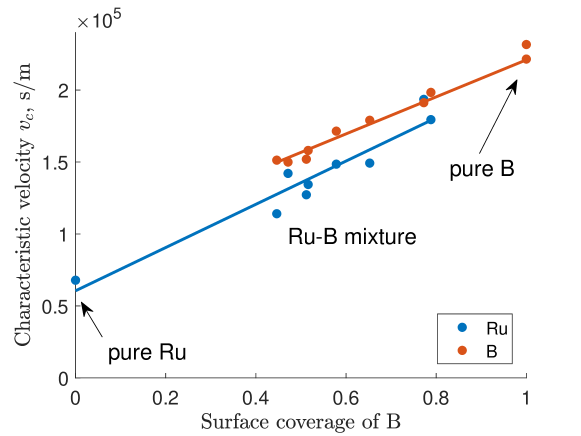
To understand the mechanism of this matrix effect we need to study its behavior. changes almost linearly with composition, while shows noticeable deviation from a linear behavior. However, can be plotted as a function of , as it is done in Fig. 7. In these coordinates both and change linearly with the amount of B on the surface. The slopes of both lines are also rather close, which suggests that the relative changes of characteristic velocities of Ru and B happen together, i.e. these changes depend on the surface composition but are not element-specific. It means that neutralization mechanism responsible for the matrix effect is of non-local nature, and also justifies the use of the Hagstrum model for the calculation of the inversed velocity from the incident ion energy [17] in Fig. 5.
Due to the abovementioned issues the work function cannot explain the observed matrix effect. It means that among two matrix effects observed for La in Chapter [17] the low work function effect (matrix effect in C-RN) is not involved; and oscillatory matrix effect matrix effect (matrix effect in qRCT) is not applicable in the current state as is expressed in changes of structuring of the ion yield curve, while our present matrix effect changes characteristic velocity. While this disqualifies matrix effect in qRCT, we should note that we cannot exclude presence of weak oscillations in Ru and B ion yields simply because of the lack of density of experimental points. However, none of these elements have atomic levels in proximity of He 1s level [18], which are required for presence of qRCT in the first place.
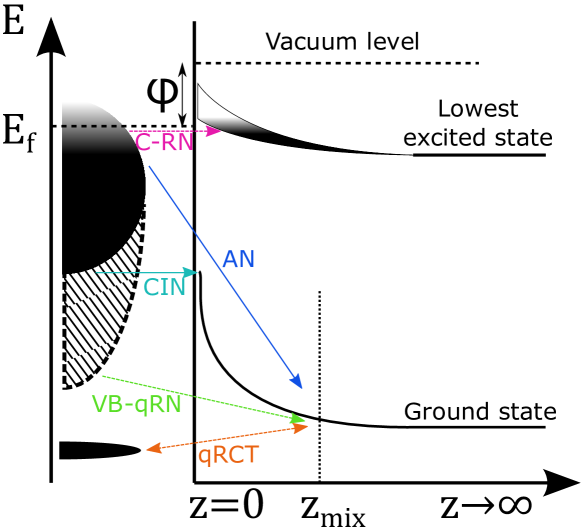
5 (Quasi-)resonant neutralization from the valence band
Matrix effects in C-RN and qRCT are not the only two matrix effects recognized in LEIS field. There is also a separately classified matrix effect in graphitic carbon, which appears due to a neutralization mechanism solely mentioned in connection to this matrix effect: (quasi-)resonant neutralization from the valence band of the target to the ground state of the projectile [19, 20] (Fig. 8). Due to the lack of standardized abbreviation we will call it VB-qRN in this thesis. VB-qRN is a non-local mechanism, because much like C-RN or CIN it originates from a wide band which spans multiple atoms in the solid. VB-qRN can only occur when the valence band is wide enough to become resonant with the ground state of the projectile; as demonstrated in [20] this condition is satisfied for graphitic carbon. For most other materials, resonance between the bottom of the valence band and the projectile ground state is only possible at very small distances due to promotion of projectile levels in a close collision (CIN, collision-induced neutralization, or resonant neutralization in close collision). VB-qRN can be viewed as an intermediate case between CIN and qRCT. It is an extreme case of CIN with a threshold energy close to zero, when no promotion is required. It is also an extreme case of qRCT with a very wide band [21], which severely reduces the probability of reionization due to small hole lifetime within the band, and therefore makes for more efficient neutralization. It also causes severe dampening of ion yield oscillations as a function of inversed ion velocity [20].
VB-qRN relies on the unusually wide valence band of the target. We performed a literature search for calculations of the density of states (DOS) of valence electrons of different states of C, B and Ru, and the results are shown in Table 1. Instead of comparing the full DOS, we only focus on the difference between the energy of the lowest state of the valence band and the Fermi level. We will call this energy . The uncertainty of such calculations is significant, therefore comparisons of obtained with different techniques can be misleading. For an example of graphite, we were able to find from 26 eV [22], obtained from AES measurements, to 20 eV [23], calculated by the tight binding model. Such uncertainties cannot be avoided, but in several cases a relative comparison of can be done for the calculations performed in the same source.
Assuming typical value of work function of 4 eV, the valence band will be resonant with He 1s level as long as eV. By this measure graphitic C will be subject to VB-qRN mechanism. Metal carbides, e.g. MoC [24], have much narrower valence band and will not have this neutralization channel. Therefore C in graphite will have much higher characteristic velocity than C in MoC, leading to a matrix effect.
| Material |
|
|
Source | ||||
| C, graphite | 26 | - | [22] | ||||
| C, graphite | 20 | - | [23] | ||||
| C, diamond | 24 | - | [23] | ||||
| C, amorph. 100% sp2 | 21 | - | [23] | ||||
| C, amorph. 0% sp2 | 23.5 | - | [23] | ||||
| MoC | 11 | - | [24] | ||||
| -B | 16 | 19 | [25], [26] | ||||
| -B | 22 | 26 | [27] | ||||
| a-B similar to -B | 16 | - | [28] | ||||
| RuB4 | 20 | - | [29] | ||||
| RuB3 | 16 | - | [29] | ||||
| RuB2 | 14 | - | [29] | ||||
| Ru | 7.5 | - | [30] |
Comparison of graphitic C with diamond and amorphous C [23] shows that all of these states of C have eV, which means that VB-qRN should be present in all elemental C and not only in graphite. We believe that all of the conclusions from the work of Průsa et al. [20] can be applied to diamond and amorphous C as well. This allows to explain the behavior of Ru-C LEIS signal pair in Fig. 2. The range of compositions starts with a pure amorphous C film, which has strong valence band neutralization, which reduces all LEIS signal (similar to situation with graphitic C). This effect is non-local, since it originates from the valence band, therefore Ru signal is affected as well. Ru carbides do not form at normal conditions [31, 32], therefore with increasing amount of Ru on the surface of the sample amount of electrons originating from valence band of C film proportionally reduces, and additional neutralization channel weakens. The decrease in the strength of neutralization causes an increase of the signals of both Ru and C, which is reason for a positive slope of the left side of Ru-C curve in Fig. 2.
The right part of the curve behaves differently. Our assumption is that after a certain critical amount of Ru (, achieved at nm of Ru) is deposited on the surface of the sample, no carbon atoms are bonded to each other in sufficient quantity to form a wide valence band, and additional neutralization channel disappears; matrix effect no longer present. This is represented by linear Ru-C dependence on the right side of Ru-C curve in Fig. 2.
Table 1 shows that while the of elemental B also varies between allotropes and different calculations, it can be expected in the range of 16 to 22 eV. Most of the calculations feature one or several sub-bands below the valence band, which may or may not be separated in the actual sample due to additional broadening of the levels. It means that bottom of the valence band of elemental B can potentially be in the strict resonance with He 1s level, and otherwise is in the quasiresonance with an energy mismatch of up to 4 eV. For qRN such energy mismatch still yields strong resonances [1, 17], therefore we can expect VB-qRN in elemental B as well. B-rich ruthenium borides can have high [29], which is noticeably decreasing with decreasing amount of B (from 20 for RuB4 to 14 for RuB2). The strength of quasiresonance decreases with increasing energy mismatch, therefore VB-qRN will gets weaker with decreasing amount of B. Ru has a much smaller [30], for which VB-qRN is impossible. It means that in the transition B - RuBx - Ru strength of VB-qRN is constantly decreasing, leading to a constant decrease of characteristic velocity, leading to a matrix effect in Ru-B material combination.
With the help of VB-qRN we can explain additional details of the matrix effect in Ru-B that were observed in the section 4. First of all, matrix effect is observed in both Ru and B LEIS signals, and relative change of characteristic velocity with composition is the same for B and Ru (Fig. 7). VB-qRN is a non-local neutralization mechanism, which explains why it has the same effect on He ions scattered from both Ru and B atoms. Second, we can explain why in Fig. 6 changes linearly with , while deviates from a straight line in Fig. 6 but behaves more linearly in Fig. 7. The reason for this is that VB-qRN originates from the bottom part of the valence band, which is formed by B-B and Ru-B bonds [29] and therefore depends on the amount of B more than Ru.
In this section we established that the matrix effect in Ru-B mixtures occurs in a wide range of compositions (Fig. 7), from approximately 1:1 mixture to pure B, but from this figure we are unable to say at which critical concentration of B in the mixture the matrix effect disappears. It appears that there are and change linearly with B concentration, but if the linear trend is extrapolated to , it would lead to conclusion that a small amount of B added to Ru leads to change in . However, at or pure Ru a small change should not lead to appearance of VB-qRN. Therefore, there must be a critical concentration at which the linear trend is no longer sustained. The only estimation of critical concentration remains from Fig. 2, therefore a question of quantification of Ru-rich mixtures with LEIS can be considered open until more measurements of characteristic velocities are done.
6 Discussion
Ru-B and Ru-C material combinations are not the only cases where matrix effects related to a band structure can be observed. Technically, all borides and carbides should exhibit such matrix effects if corresponding pure elements are chosen as reference samples. This is simply because VB-qRN is present in elemental B and C but absent in other elements, therefore of at least one of the elements will be different in the mixture. The matrix effects should also propagate to situations where both elements have VB-qRN, for example a boron-carbon mixture (B4C), because valence band shape and therefore neutralization efficiency in B4C is different from any elemental B or C.
We expect that in a lot of cases matrix effects can be avoided by a proper choice of reference samples. For example, when measuring surface composition of certain metal carbide, one can use a pure surface of that metal as a reference for its LEIS signal, but reliable reference of C should only be obtained from extrapolation of a linear part of the pairwise signal comparison (Fig 2), and not from any form of elemental carbon. This approach will work for any metal-rich surface composition that does not yet exhibit VB-qRN. For very carbon-rich surfaces in the presence of VB-qRN, the neutralization efficiency will be changing as a function of surface composition, and therefore the only reliable quantification method will be to measure the LEIS signal at different incident ion energies and extrapolate to infinite energy. With regard to transition metal borides with very delocalized B 2s-2p states, similar to RuBx (OsBx [29], CoBx, RhBx and IrBx [33], ZrB2 and HfB2 [34, 35]), the compositional range of a constant neutralization efficiency might be narrow (see Section 4), therefore the quantification of surface composition of transition metal borides will most probably require measurements at different energies.
A slightly different situation arises with regard to hexaborides, as well as metal oxides and nitrides. Alkaline earth and rare earth hexaborides have much more localized B 2s-2p states [36, 37], which do not belong to a wide continuous valence band, yet are located at energies of 16 eV below the Fermi level. Metal oxides have O 2s states with similar energies: 19 eV for RuO2 in different phases [38], 19 eV for TiO2 in different phases [39], 17 eV for ZrO2 [40], 19 eV for MgO and 20 eV for Al2O3 [41]. Metal nitrides have N 2s states at 17 eV for Cr-Ti nitrides [42], 16-18 eV for different Ru nitrides [30], 16-17 eV for different phases of MoN [43] or 14 eV for MoN [24], 16 eV for CrN and TiN [24], 18 eV for VN [24].
These isolated bands from B 2s-2p, O 2s or N 2s states can also be in a (quasi-)resonance with He 1s. This is the charge exchange process commonly known as qRN or qRCT. In the paper [17] we treated the target levels associated with qRCT as atomic levels, without taking their broadening into account. However, being a part of a solid, these levels can be treated as electron bands of a certain width. It is known that width of a band involved in a resonance affects the effectiveness of neutralization channel [21], which is expressed in dampening the oscillations of ion yield and increasing the characteristic velocity. It is also known that the radial distribution function of electron probability distribution is more narrow for d-electrons than for p- and s-electrons, which also means that energy splitting of d-electrons is lower and d-bands are more localized in space and in energy compared to p-bands. All strong oscillations in LEIS ion yield were produced by resonances with d-bands only [1]. In our earlier work [17] we observed much weaker oscillation of ion yield in He+ scattering from La in different chemical states. We attributed the oscillations to quasiresonance between He 1s and La 5p levels, but the reason for severe dampening of oscillations was unclear. Now we can say that the broadening of p-orbitals compared to d-orbitals is the most likely explanation, that does not involve the use of an orbital symmetry rule, contrary to, for example, Souda et. al. [44].
There is a lot of similarity between qRN from deep lying valence band states and qRN from relatively wide (i.e. s- or p-) non-valence bands. Changes in width and position of those bands can also affect the neutralization efficiency. Damplening of oscillations and increase of neutralization efficiency are caused by the same effect [21]. In the earlier paper [17] we explained the changes in of La by low work function matrix effect, however part of these changes might originate from qRN from B 2s-2p in LaB6 and O 2s in La2O3. For the surfaces that are not subject to low work function matrix effect, for example for transition metal oxides, the change of characteristic velocity due to qRN can become dominant. Therefore, we can potentially expect qRN-related matrix effects in a variety of metal borides, carbides, oxides and nitrides.
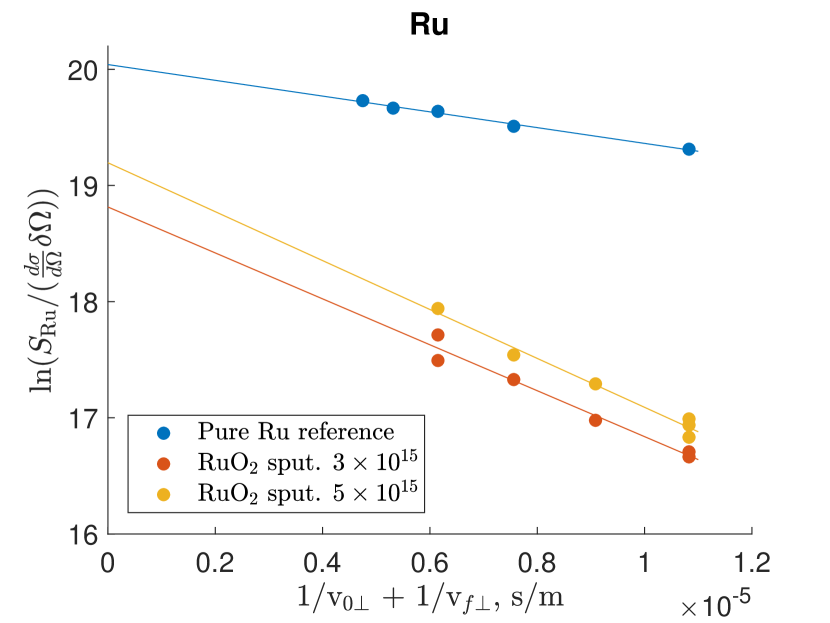
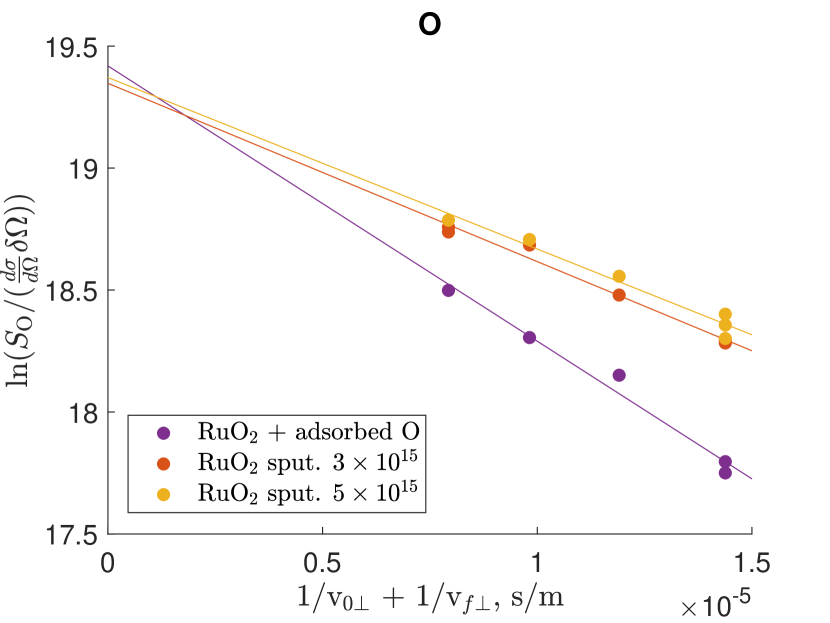
To experimentally verify this prediction at least for Ru oxide, a simple proof-of-principle experiment was performed. A pure thin film of Ru was deposited by magnetron sputtering, and without breaking the vacuum exposed to atomic oxygen from a plasma source at a pressure of mbar for ¿1 hr at room temperature. The procedure should result in the formation of stoichiometric RuO2 thin film of 1 nm thickness. LEIS measurements of sample surfaces after the treatment did not show any quantifiable amount of Ru on the surface, which can be attributed to additional adsorbed O atoms on the surface. After mild 0.5 keV Ar+ sputtering LEIS signals of both Ru and O atoms can be reliably measured. The results of the measurements are shown in Fig. 9 for both Ru and O peaks. There is a noticeable difference in characteristic velocities of pure Ru and oxidized Ru. There is also a difference between characteristic velocities of O from untreated surface (RuO2 + adsorbed O) and sputter-cleaned surface (RuO2 only). Understanding of the actual behavior of neutralization mechanisms in Ru oxides goes beyond the scope of this work, but this proof-of-principle experiment supports our prediction about existence of matrix effects related to neutralization O 2s levels.
7 Conclusions
In this work 3 keV He+ scattering was used to measure the surface composition of thin films of Ru on B, C and B4C films at different stages of growth. Surface segregation of C on Ru and strong intermixing were observed in all cases. Matrix effects in He+ scattering from surfaces with a low Ru concentration (, achieved at nm of Ru) were observed. Dedicated studies of matrix effects were performed on the Ru-B material combination. After measuring the Ru and B signals with several He+ energies we observed a roughly linear increase of the characteristic velocities of Ru and B with the increase of B content. This phenomenon cannot be explained by a low work function matrix effect, which originates in from resonant neutralization from the conduction band of the target to excited levels of He+. Yet, we explain this effect by the presence of quasiresonant neutralization from the valence band of B and RuBx targets. Elemental B and Ru borides have wide valence bands with low lying states ( to 14 eV) that can be in quasiresonance with the He 1s level, while the valence band of elemental Ru cannot participate in such quasiresonance ( eV). This difference results in the changes of neutralization efficiency and therefore in LEIS signals, which gives the matrix effect in Ru-B surfaces. A similar matrix effect is observed for Ru-C surfaces.
We further predict that qRN-related matrix effects of a similar mechanism can be applied to a much larger variety of compounds, i.e. metal borides, carbides, oxides and nitridies. A proof-of-principle experiment on oxidized Ru film shows a matrix effect in the Ru-O material combination as well, which can be attributed to qRN from O 2s levels. Further validation of this prediction necessitates systematic comparisons of characteristic velocities between pure elements and their compounds. We suggest that such measurements are necessary for reliable surface quantification in LEIS. We hope that this work will encourage more research on matrix effects originating from VB-qRN and qRN, and henceworth the limits of quantification of compounds by LEIS imposed by the presence of matrix effects.
8 Acknowledgements
This work was carried out in the Industrial Focus Group XUV Optics at the MESA+ Institute for Nanotechnology at the University of Twente, and we acknowledge the support of the industrial partners ASML, Carl Zeiss SMT, Malvern Panalytical, and TNO as well as the Province of Overijssel and the Dutch Organization for Scientific Research NWO. The authors express gratitude to Prof. Hidde Brongersma for helpful discussions as well as to Dr. Maria Berdova for providing the CVD B thin film sample.
References
- [1] H Brongersma, M Draxler, M de Ridder, and P Bauer. Surface composition analysis by low-energy ion scattering. Surface Science Reports, 62(3):63–109, 2007.
- [2] R. Cortenraad, S. N. Ermolov, B. Moest, a. W. Denier Van Der Gon, V. G. Glebovsky, and H. H. Brongersma. Crystal-face dependence of low-energy ion scattering signals. Nuclear Instruments and Methods in Physics Research, Section B: Beam Interactions with Materials and Atoms, 174(1-2):173–180, 2001.
- [3] D. Primetzhofer, M. Spitz, E. Taglauer, and P. Bauer. Resonant charge transfer in low-energy ion scattering: Information depth in the reionization regime. Surface Science, 605(21-22):1913–1917, 2011.
- [4] R. Coloma Ribera, R. W. E. van de Kruijs, J. M. Sturm, A. E. Yakshin, and F. Bijkerk. In vacuo growth studies of Ru thin films on Si, SiN, and SiO2 by high-sensitivity low energy ion scattering. Journal of Applied Physics, 120(6):065303, 2016.
- [5] Naghi Saadatjou, Ali Jafari, and Saeed Sahebdelfar. Ruthenium Nanocatalysts for Ammonia Synthesis: A Review. Chemical Engineering Communications, 202(4):420–448, 2015.
- [6] Seungmin Yeo, Sang Hyeok Choi, Ji Yoon Park, Soo Hyun Kim, Taehoon Cheon, Byoung Yong Lim, and Sunjung Kim. Atomic layer deposition of ruthenium (Ru) thin films using ethylbenzen-cyclohexadiene Ru(0) as a seed layer for copper metallization. Thin Solid Films, 546:2–8, 2013.
- [7] Shu-Huei Hsieh, Wen Chen, and Chu-Mo Chien. Structural Stability of Diffusion Barriers in Cu/Ru/MgO/Ta/Si. Nanomaterials, 5(4):1840–1852, 2015.
- [8] Peter W Sutter, Jan-Ingo Flege, and Eli a Sutter. Epitaxial graphene on ruthenium. Nature materials, 7(5):406–11, 2008.
- [9] J. Wintterlin and M. L. Bocquet. Graphene on metal surfaces. Surface Science, 603(10-12):1841–1852, 2009.
- [10] Seong Keun Kim, Wan Don Kim, Kyung Min Kim, Cheol Seong Hwang, and Jaehack Jeong. High dielectric constant TiO2 thin films on a Ru electrode grown at 250∘C by atomic-layer deposition. Applied Physics Letters, 85(18):4112–4114, 2004.
- [11] D G Stearns, S. P. Vernon, and R. S. Rosen. Normal-incidence x-ray mirror for 7 nm. Optics Letters, 16(16):1283, 8 1991.
- [12] Eberhard A. Spiller and Ki-Byoung Youn. Studies toward the optimization of ion polishing for multilayer x-ray mirrors. In Richard B. Hoover, editor, Proc. SPIE 2011, Multilayer and Grazing Incidence X-Ray/EUV Optics II, number February 1994, pages 288–298, 2 1994.
- [13] Dmitriy Ksenzov, Christoph Schlemper, and Ullrich Pietsch. Resonant soft x-ray reflectivity of Me/B(4)C multilayers near the boron K edge. Applied optics, 49(25):4767–4773, 2010.
- [14] L. Z. Mezey and J Giber. The surface free energies of solid chemical elements calculation from internal free enthalpies of atomization. Japanese Journal of Applied Physics, 21(11), 1982.
- [15] T. Tsarfati, R.W.E. van de Kruijs, E. Zoethout, E. Louis, and F. Bijkerk. Reflective multilayer optics for 6.7nm wavelength radiation sources and next generation lithography. Thin Solid Films, 518(5):1365–1368, 2009.
- [16] R. Cortenraad, A. W. Denier van der Gon, H. H. Brongersma, S. N. Ermolov, and V. G. Glebovsky. Work function dependent neutralization of low-energy noble gas ions. Physical Review B, 65(19):195414, 2002.
- [17] Andrey A. Zameshin, Andrey E. Yakshin, Jacobus M. Sturm, Hidde H. Brongerma, and Fred Bijkerk. Double matrix effect in Low Energy Ion Scattering from La surfaces. Applied Surface Science, 440:570–579, 2018.
- [18] William M. Haynes. CRC Handbook of Chemistry and Physics, 96th Edition. 2015.
- [19] Hidde H. Brongersma and Jean-Paul Jacobs. Application of low-energy ion scattering to studies of growth. Applied Surface Science, 75(1-4):133–138, 1994.
- [20] Stanislav Průša, Pavel Procházka, Petr Bábor, Tomáš Šikola, Rik ter Veen, Michael Fartmann, Thomas Grehl, Philipp Brüner, Dietmar Roth, Peter Bauer, and Hidde H. Brongersma. Highly Sensitive Detection of Surface and Intercalated Impurities in Graphene by LEIS. Langmuir, 31(35):9628–9635, 9 2015.
- [21] Shinji Tsuneyuki, Nobuyuki Shima, and Masaru Tsukada. Band effect on the charge exchange process at solid surfaces. Surface Science, 186(1-2):26–44, 7 1987.
- [22] V.V. Khvostov, V.G. Babaev, E.a. Dementjeva, and M.B. Guseva. Electronic structure of Cs-graphite surface studied by Auger-spectroscopy. Surface Science, 345(3):L44–L48, 1996.
- [23] J. Robertson and E. P. O’Reilly. Electronic and atomic structure of amorphous carbon. Physical Review B, 35(6):2946–2957, 2 1987.
- [24] A. Zaoui, S. Kacimi, B. Bouhafs, and A. Roula. First-principles study of bonding mechanisms in the series of Ti, V, Cr, Mo, and their carbides and nitrides. Physica B: Condensed Matter, 358(1-4):63–71, 2005.
- [25] Dasari L.V.K. Prasad, Musiri M. Balakrishnarajan, and Eluvathingal D. Jemmis. Electronic structure and bonding of -rhombohedral boron using cluster fragment approach. Physical Review B - Condensed Matter and Materials Physics, 72(19):1–6, 2005.
- [26] Yoji Imai, Masakazu Mukaida, Minoru Ueda, and Akio Watanabe. Band-calculation of the electronic densities of states and the total energies of boron-silicon system. Journal of Alloys and Compounds, 347(1-2):244–251, 2002.
- [27] David R Armstrong, John Bolland, and Peter G Perkins. The electronic structure of alpha-B12, B12P2 and B12As2.pdf. Theoretica Chimica Acta, 64:501–514, 1984.
- [28] Murat Durandurdu. Densification of amorphous boron under pressure. Journal of Non-Crystalline Solids, 471(June):274–279, 2017.
- [29] Yachun Wang, Tiankai Yao, Li-Min Wang, Jinlei Yao, Hui Li, Jingwu Zhang, and Huiyang Gou. Structural and relative stabilities, electronic properties and possible reactive routing of osmium and ruthenium borides from first-principles calculations. Dalton Transactions, 42(19):7041, 2013.
- [30] M. G. Moreno-Armenta, J. Diaz, A. Martinez-Ruiz, and G. Soto. Synthesis of cubic ruthenium nitride by reactive pulsed laser ablation. Journal of Physics and Chemistry of Solids, 68(10):1989–1994, 2007.
- [31] G Harikrishnan, K M Ajith, Sharat Chandra, and M C Valsakumar. Evolutionary algorithm based structure search for hard ruthenium carbides. Modelling and Simulation in Materials Science and Engineering, 23:85006, 2015.
- [32] S. V. Meschel and O. J. Kleppa. Thermochemistry of alloys of transition metals and lanthanide metals with some IIIB and IVB elements in the periodic table. Journal of Alloys and Compounds, 321(2):183–200, 2001.
- [33] Yachun Wang, Lailei Wu, Yangzheng Lin, Qingyang Hu, Zhiping Li, Hanyu Liu, Yunkun Zhang, Huiyang Gou, Yansun Yao, Jingwu Zhang, Faming Gao, and Ho Kwang Mao. Structures and stability of novel transition-metal (M = Co, Rh, Co and Ir) borides. Physical Review B - Condensed Matter and Materials Physics, 92(17):1–8, 2015.
- [34] Xinghong Zhang, Xiaoguang Luo, Jiecai Han, Jinping Li, and Wenbo Han. Electronic structure, elasticity and hardness of diborides of zirconium and hafnium: First principles calculations. Computational Materials Science, 44(2):411–421, 2008.
- [35] Yong Pan, Huawei Huang, Xia Wang, and Yuanhua Lin. Phase stability and mechanical properties of hafnium borides: A first-principles study. Computational Materials Science, 109:1–6, 2015.
- [36] Bo Huang, Yong Hua Duan, Yong Sun, Ming Jun Peng, and Shuai Chen. Electronic structures, mechanical and thermodynamic properties of cubic alkaline-earth hexaborides from first principles calculations. Journal of Alloys and Compounds, 635:213–224, 2015.
- [37] Lina Bai, Ning Ma, and Fengli Liu. Structure and chemical bond characteristics of LaB6. Physica B: Condensed Matter, 404(21):4086–4089, 2009.
- [38] N. Mehtougui, D. Rached, R. Khenata, H. Rached, M. Rabah, and S. Bin-Omran. Structural, electronic and mechanical properties of RuO 2 from first-principles calculations. Materials Science in Semiconductor Processing, 15(4):331–339, 2012.
- [39] Lin Chen, Yao Qu, Xuan Yang, Bin Liao, Wenbin Xue, and Wei Cheng. Characterization and first-principles calculations of WO 3 /TiO 2 composite films on titanium prepared by microarc oxidation. Materials Chemistry and Physics, 201:311–322, 2017.
- [40] Yan Zhang, Li Duan, and Vincent Ji. The detailed crystal and electronic structures of the cotunnite-type ZrO2. Solid State Communications, 239:27–31, 2016.
- [41] S. P. Kowalczyk, F. R. McFeely, L. Ley, V. T. Gritsyna, and D. A. Shirley. The electronic structure of SrTiO3 and some simple related oxides (MgO, Al2O3, SrO, TiO2). Solid State Communications, 23(3):161–169, 1977.
- [42] F Levy, P Hones, P E Schmid, R Sanjines, M Diserens, and C Wiemer. Electronic states and mechanical properties in transition metal nitrides. Surface & Coatings Technology, 120:284–290, 1999.
- [43] M. B. Kanoun, S. Goumri-Said, and M. Jaouen. Structure and mechanical stability of molybdenum nitrides: A first-principles study. Physical Review B - Condensed Matter and Materials Physics, 76(13):2–5, 2007.
- [44] R. Souda, T. Aizawa, C. Oshima, S. Otani, and Y. Ishizawa. Electronic excitation in impact scattering of low-energy He+ from solid surfaces. Physical Review B, 40(6):4119–4131, 1989.