Exponential Scaling in Early-stage Agglomeration of Adhesive Particles in Turbulence
Abstract
We carry out direct numerical simulation together with an adhesive discrete element method calculation (DNS-DEM) to investigate agglomeration of particles in homogeneous isotropic turbulence (HIT). We report an exponential-form scaling for the size distribution of early-stage agglomerates, which is valid across a wide range of particle inertia and inter-particle adhesion values. Such scaling allows one to quantify the state of agglomeration using a single scale parameter. An agglomeration kernel is then constructed containing the information of agglomerate structures and the sticking probability. An explicit relationship between the sticking probability and microscale particle properties is also proposed based on the scaling analysis of the equation for head-on collisions. Our results extend Smoluchowski’s theory to the condition of non-coalescing solid adhesive particles and can reproduce DNS-DEM results with a simple one-dimensional simulation.
I Introduction
Clustering of particles suspended in turbulence has been extensively studied in experiments Saw et al. (2008); Lu et al. (2010), in simulations Bec et al. (2014) and by theoretical approaches Gustavsson et al. (2014); Balachandar and Eaton (2010). To predict the evolution of cluster or agglomerate size, Smoluchowski’s equation, built on statistical collision kernels, is one of the few theoretical tools that can be applied to large-scale systems Smoluchowski (1917); Friedlander (2000); Pumir and Wilkinson (2016). For particles in turbulence, the collision kernel is usually expressed as the production of the mean relative radial velocity and the radial distribution functions (RDFs) of particle pairs at the distance of contact. For zero-inertial particles, these two quantities can be statistically determined from those of turbulence flows Saffman and Turner (1956). In contrast, inertial particles preferentially sample certain regions of the flow due to the centrifugation effect, giving rise to higher values of both relative radial velocity and spatial concentration Abrahamson (1975); Sundaram and Collins (1997); Wang et al. (2000); Zhou et al. (2001); Gustavsson and Mehlig (2016). As the inertia of particles further increases, particles from different regions of the flow come together. A larger relative velocity, consequently a larger collision rate, is then observed. Such effect is termed as “caustics” Wilkinson and Mehlig (2005); Gustavsson and Mehlig (2011) or “sling effect” Falkovich and Pumir (2007).
Based on these models of geometric collision kernel, Smoluchowski’s theory can be then used to describe the growth of clusters assuming that colliding particles merge immediately to form new larger spherical particles. The assumption of unity coagulation efficiency is normally valid for droplets. However, it is not applicable to the agglomeration of solid non-coalescing adhesive particles. Such systems are quite ubiquitous, ranging from electrostatic agglomerators Jaworek et al. (2018), flocculation during water treatment Jarvis et al. (2005), assemblage of preplanetary grains Blum et al. (2000) to the growth of dendrites during aerosol filtration Tien et al. (1977); Chen et al. (2016). The solid adhesive particles, across to microns, have two significant differences from Brownian nanoparticles or coalescing droplets: (1) the interparticle adhesion due to van der Waals attraction is short-ranged and relatively soft Marshall and Li (2014). It leads to the sticking/rebound behavior of colliding particles (i.e., non-unity coagulation efficiency). (2) Formed agglomerates are usually non-spherical, whose structure will evolve due to restructuring and breakage. It has been reported that even the simplest elastic repulsion between particles considerably changes the picture of agglomeration Bec et al. (2013). Constructing a kernel function that can reflect the influence of complicated inter-particle interactions is a crucial problem that has not been settled.
Solving this problem requires a fundamentally different approach - discrete element methods (DEM) - that tracks the dynamics of individual particles both while they are traveling alone through the fluid and while they are colliding with other particles Marshall and Li (2014). To properly simulate the agglomeration, particle collisions should be resolved with a time step much smaller than the Kolmogorov time scale. Moreover, all the possible modes of particle interaction, i.e., normal impact, sliding, twisting, and rolling, should be taken into account Marshall (2009); Dizaji and Marshall (2017). Constructing kernel functions or stochastic agglomeration models Sommerfeld (2001); Almohammed and Breuer (2016) based on data from DEM simulations then allows large-scale simulation of the agglomeration process.
In this work, we perform direct numerical simulations (DNS) to study the agglomeration of non-coalescing solid particles in homogeneous isotropic turbulence (HIT) with focus on the effect of van der Waals adhesion. A novel adhesive DEM is employed to fully resolve the translational and rotational motions of particles. We report an exponential-form scaling for the size distribution of early-stage agglomerates as , where is the number density of agglomerates of size . This exponential distribution allows one to describe the growth of agglomerates using a single scale parameter . Based on the simulation results, we are able to extend the Smoluchowski’s theory to describe adhesion-enhanced agglomeration by introducing a turbulence agglomeration kernel depending on the fractal structure of agglomerates and an adhesion-controlled sticking probability.
II NUMERICAL METHOD AND SIMULATION CONDITIONS
II.1 DNS-DEM
II.1.1 Fluid phase
In our simulation, the homogeneous isotropic turbulent flow is calculated by DNS on a cubic, triply-periodic domain. A pseudospectral method with second-order Adams-Bashforth time stepping is applied to solve the continuity and momentum equations of the incompressible flow,
| (1a) | ||||
| (1b) | ||||
Here, and are the fluid velocity and vorticity, respectively. is the pressure, is the fluid density, is the kinematic viscosity. The small wavenumber forcing term is used to maintain the turbulence with an approximately constant kinetic energy. As suggest in Lundgren (2003); Rosales and Meneveau (2005), we assume the forcing vector to be proportional to the fluid velocity and added to wavenumbers with magnitude . is the particle body force, which is calculated at each Cartesian grid node using . Here, is the location of grid node , is the fluid force on particle located at and is a regularized delta function. The influence of the particle phase on the flow phase has a non-negligible effect on the agglomeration even when the particle volume fraction . Since we also consider interactions between particles, our simulation is four-way coupled Balachandar and Eaton (2010).
It should be noted that all the equations and variables in our simulation have been nondimensionalized by choosing typical length, velocity and mass scales that are relevant to the agglomeration of solid microparticles. The typical length scale is set as , where is the particle radius. The typical velocity is and the typical mass is , where is the fluid density. The typical length scale is given by .Other dimensional input parameters are the fluid viscosity , the particle density and the surface energy . Hereinafter, all the variables appear in their dimensionless form and, for simplicity, we use the same notations as the dimensional variables.
Before the particles are added into the domain, a preliminary computation is conducted for time steps with (dimensionless) to allow the turbulence to reach a statistically stationary state. The turbulence kinetic energy and dissipation rate are obtained from integration of the power spectrum ,
| (2) |
II.1.2 Solid phase: adhesive discrete element method
We use discrete element method (DEM) to model the particles’ motion in turbulent flows, which solves the linear and angular momentum equations of particles
| (3a) | |||
| (3b) | |||
where and are mass and moment of inertia of particle and and are the translational velocity and the rotation rate of the particle. The forces and torques are induced by both the fluid flow ( and ) and the interparticle contact ( and ). In this work, the dominant fluid force is the Stokes drag given by
| (4a) | |||
| (4b) | |||
where , and are velocity, vorticity and viscosity of the fluid and and are the velocity and the diameter of particles. The friction factor , given by Di Felice (1994), is used to correct for the crowding of particles. For particle Reynolds number in the range to , can be written as
| (5) |
The particle Reynolds number is defined as . In addition to the Stokes drag, we also include the Saffman and Magnus lift forces in Saffman (1965); Rubinow and Keller (1961).
When two particles and are in contact, the normal force , the sliding friction , the twisting torque , and the rolling torque acting on particle from particle can be expressed as
| (6a) | ||||
| (6b) | ||||
| (6c) | ||||
| (6d) | ||||
The normal force contains an elastic term derived from the JKR (Johnson-Kendall-Roberts) contact theory. combines the effects of van der Waals attraction and the elastic deformation and its scale is set by the critical pull-off force, , where is the reduced particle radius and is the surface energy of the particle. The dimensionless variable is calculated by normalizing the radius of the contact region by its value at the zero-load equilibrium state , expressed as (Marshall, 2009), where is the effective elastic modulus. In DEM, is calculated inversely from the normal particle overlap, , through
| (7) |
where is the critical overlap. The bond between two contacting particles will break when . The sliding friction , twisting torque , and rolling torque (Eq. (6b) - (6d)) are all calculated using spring-dashpot-slider models, where , , and are the relative sliding, twisting, and rolling velocities. in Eq. (6) is the tangential stiffness. The second term of Eq. (6a-6d) are the viscoelastic damping forces, which are proportional to the rate of motions in each of the respective directions, and , and are the dissipation coefficients for relative compression, sliding and rolling motions. The normal dissipation coefficient is calculated as , where is the effective mass of two colliding particles with mass and . For details, see Marshall (2009); Chen et al. (2019).
When these resistances reach their critical limits, , or , a particle will irreversibly slide, twist or roll relative to its neighboring particle. The critical limits are expressed as Marshall (2009):
| (8a) | ||||
| (8b) | ||||
| (8c) | ||||
Here is the friction coefficient and is the critical rolling angle. We set these values according to experimental measurements Sümer and Sitti (2008). The adhesive DEM has been validated by a series of experimental measurements. The details of these validations and the determination of the value of parameters in DEM can be found in Yang et al. (2013); Chen et al. (2019).
The scales of the elastic term in Eq. (6a) and the critical force and torques in Eq. (8) are all in proportion to the surface energy , which is the work required to separate two touching surfaces per unit area. An adhesion parameter , which is defined as the ratio between and the kinetic energy of particles (per unit area), can be used to quantify the effect of adhesion. is expressed as Li and Marshall (2007); Chen et al. (2019); Marshall and Li (2014)
| (9) |
In this equation, is the characteristic velocity scale of particles. For particles transported in turbulence, we simply set equal to the root-mean-square turbulent fluctuation velocity . An alternative choice of the velocity scale is discussed in Sec. III.5. For large values of the adhesion parameter, particles tend to stick together upon collision, forming particle agglomerates. In contrast, colliding particles tend to rebound from each other when is small. has been successfully used to estimate the critical sticking velocity of two colliding particles Chen et al. (2015) and predict the packing structure of adhesive particles Liu et al. (2015, 2017); Chen et al. (2016).
It is known that the fluid squeeze-film between particles near contact significantly reduces the approach velocity and further influences the collision and agglomeration process. In this work, viscous damping force derived from the classical lubrication theory is also included, given by
| (10) |
is initiated at surface separation distance and a minimum value is set at the instant of particle contact according to experiments Marshall (2011); Yang and Hunt (2006).
II.1.3 Multiple-time step framework
Our DNS-DEM computational framework is designed with multiple-time steps Li and Marshall (2007); Marshall (2009); Marshall and Li (2014). The flow field is updated using a fluid time step . To correctly identify inter-particle collisions, a smaller particle convective time step is adopted to update the force, velocity, and position of particles that do not collide with other particles. Such a small ensures that the distance each particle travels during a time step is only a small fraction of the particle or the grid size. In addition, we build a local list at each fluid step to record the neighboring particles that each particle may collide as it is advected over a fluid time step. Once a particle is found to collide with other particles during a particle time step, we then recover its information (i.e., its force, velocity, and position) to the start of this particle time step and instead advect it using a collision time step . The value of is small enough to resolve the rapid variation of contacting forces, velocity, and position of the particles.
II.2 Simulation conditions
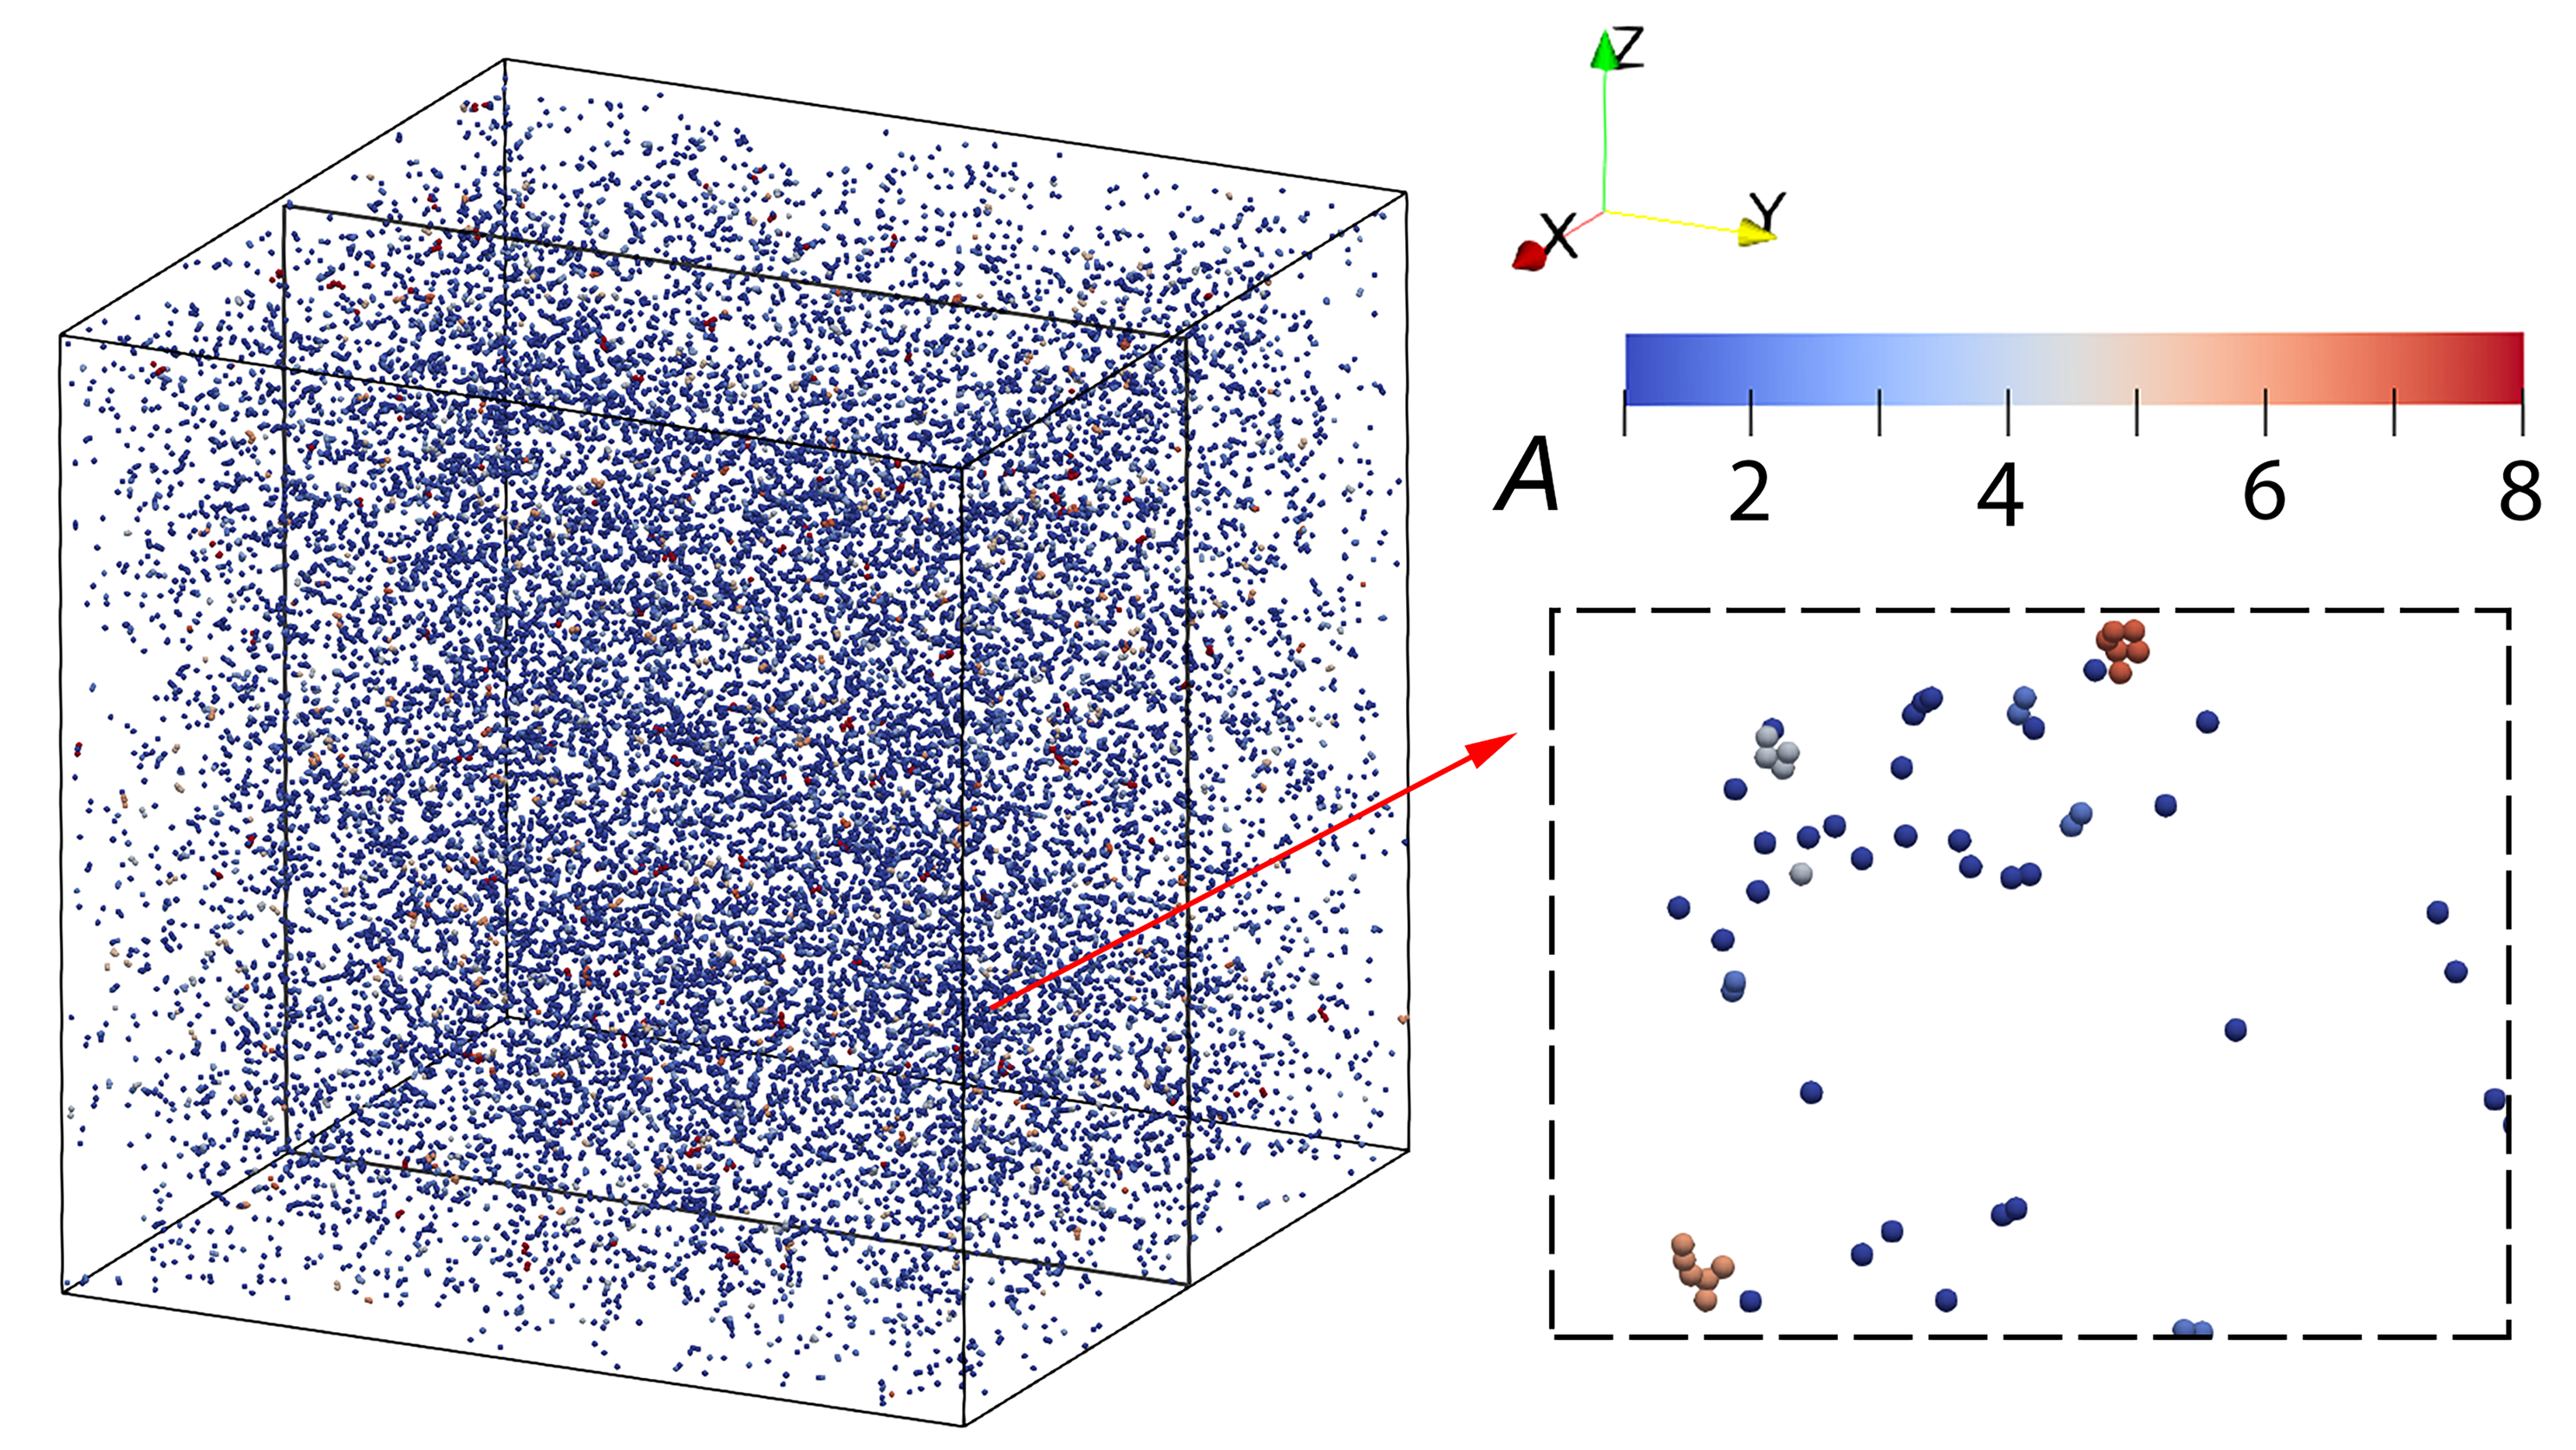
The system studied in this work is illustrated in Fig. 1. We consider non-Brownian solid particles suspended in the homogeneous isotropic turbulent flow in the absence of gravity. The triply periodic computational domain has a dimension of with grid points. The Taylor Reynolds number is fixed as in this work. Similar values of have also been used in previous studies involving particle-laden flows Wang et al. (2000); Fayed and Ragab (2013); Jin and Marshall (2017). By setting this value of , we can easily compare our results with those in literature. Other dimensionless flow parameters, including the fluctuating velocity , the dissipation rate , the kinematic viscosity , Kolmogorov length , Kolmogorov time , and the large-eddy turnover time , are listed in Table 1.
The particle radius is fixed as . We choose the value of particle radius so that the particle size and the Kolmogorov length scale are comparable. We choose this relatively large value of particle size to increase the collision rates, which helps ensure good statistics on agglomeration within a feasible computing time. The particle volume concentration is , which is small so that the system can be regarded as a dilute system. The fluid density is set as 1 (non-dimensional), and five different values (10, 40, 80, 160 and 320) are used as particle density to achieve different values of particle response time. We have neglected the influence of gravity in the present study since it does not play an important role in the agglomeration of particles with radius less than Pruppacher and Klett (1997). For detailed discussions on the effect of gravity on collision rate for large particles (with size above ), we refer to Onishi et al. (2009); Ireland et al. (2016a)
One of the most important parameters governing the agglomeration is the Kolmogorov-scale Stokes number, , where is the particle response time and is the Kolmogorov time. In the classical theory of turbulent collision of nonadhesive particles, significantly influences the value of the collision kernel. In the presence of adhesion, the adhesion parameter is used to quantify the adhesion effect Marshall and Li (2014). The particle surface energy can be determined according to experimental measurements Sümer and Sitti (2008); Krijt et al. (2013) or calculated from the Hamaker coefficients of the materials Marshall and Li (2014). In this work, we systematically vary (by varying ) in a wide range at five different values (0.72, 2.9, 5.8, 12 and 23) to show the effect of adhesion on the agglomeration.
| 0.28 | 0.0105 | 0.001 | 93.0 | 0.0175 | 0.31 | 7.4 |
II.3 Smoluchowski’s theory
Before showing the DNS-DEM results, we introduce the Smoluchowski coagulation equation and discuss how to apply the theory to the agglomeration of non-coalescing adhesive particles. In Smoluchowski’s theory, the growth of agglomerates can be described using the population balance equation (PBE) Smoluchowski (1917)
| (11) |
where is the averaged rate constant (kernel) for agglomerates of size colliding with agglomerates of size and should reflect all the factors affecting agglomeration. It is defined as with being the collision rate per unit volume and being the average number concentration of size group . The first term on the right-hand side of Eq. (11) is the source term that accounts for the rate at which agglomerates of size are created. The second term is a sink that describes agglomerate disappearance due to its coalescence with other agglomerates.
PBE can be readily used to predict the growth of droplets in clouds with an underlying assumption - colliding particles coalesce instantaneously to form larger particles Chen et al. (2018). Therefore, the growth rate of agglomerates is equivalent to the collision rate. The collision between adhesive non-coalescing microparticles, however, does not ensure the growth of an agglomerate. Both sticking and rebound could happen as a result of the competition between the particles’ kinetic energy and the surface energy. Thus, it is natural to introduce a sticking probability, , defined as the ratio of the number of collisions that lead to agglomeration to the total number of collisions. We then have an agglomeration kernel, which reads
| (12) |
The sticking probability has a minimum value for non-adhesive particle systems and a maximum value , corresponding to the hit-and-stick case in conventional PBE simulations. We can then simulate the agglomeration with different adhesion level, by simply replacing in Eq. (11) by . We will show below that such simple modification can well reproduce DNS-DEM results in a statistical manner.
The structure of agglomerates is another crucial factor affecting the agglomeration rate. For non-coalescing adhesive particles, the formed agglomerates usually have fractal structures, which distinguishes our system from those of droplets Dizaji and Marshall (2016, 2017). In systems involving Brownian nanoparticles, theoretical collision kernels can be extended to fractal agglomerates when substituting the particle radius with the radius of effective collision spheres (ECSs) for an agglomerate Jiang and Logan (1991); Flesch et al. (1999). We will show below that the idea of the effective radius can also be applied to non-Brownian inertial particles.
III Results and Discussions
III.1 Collision rate, agglomerate size, and structure
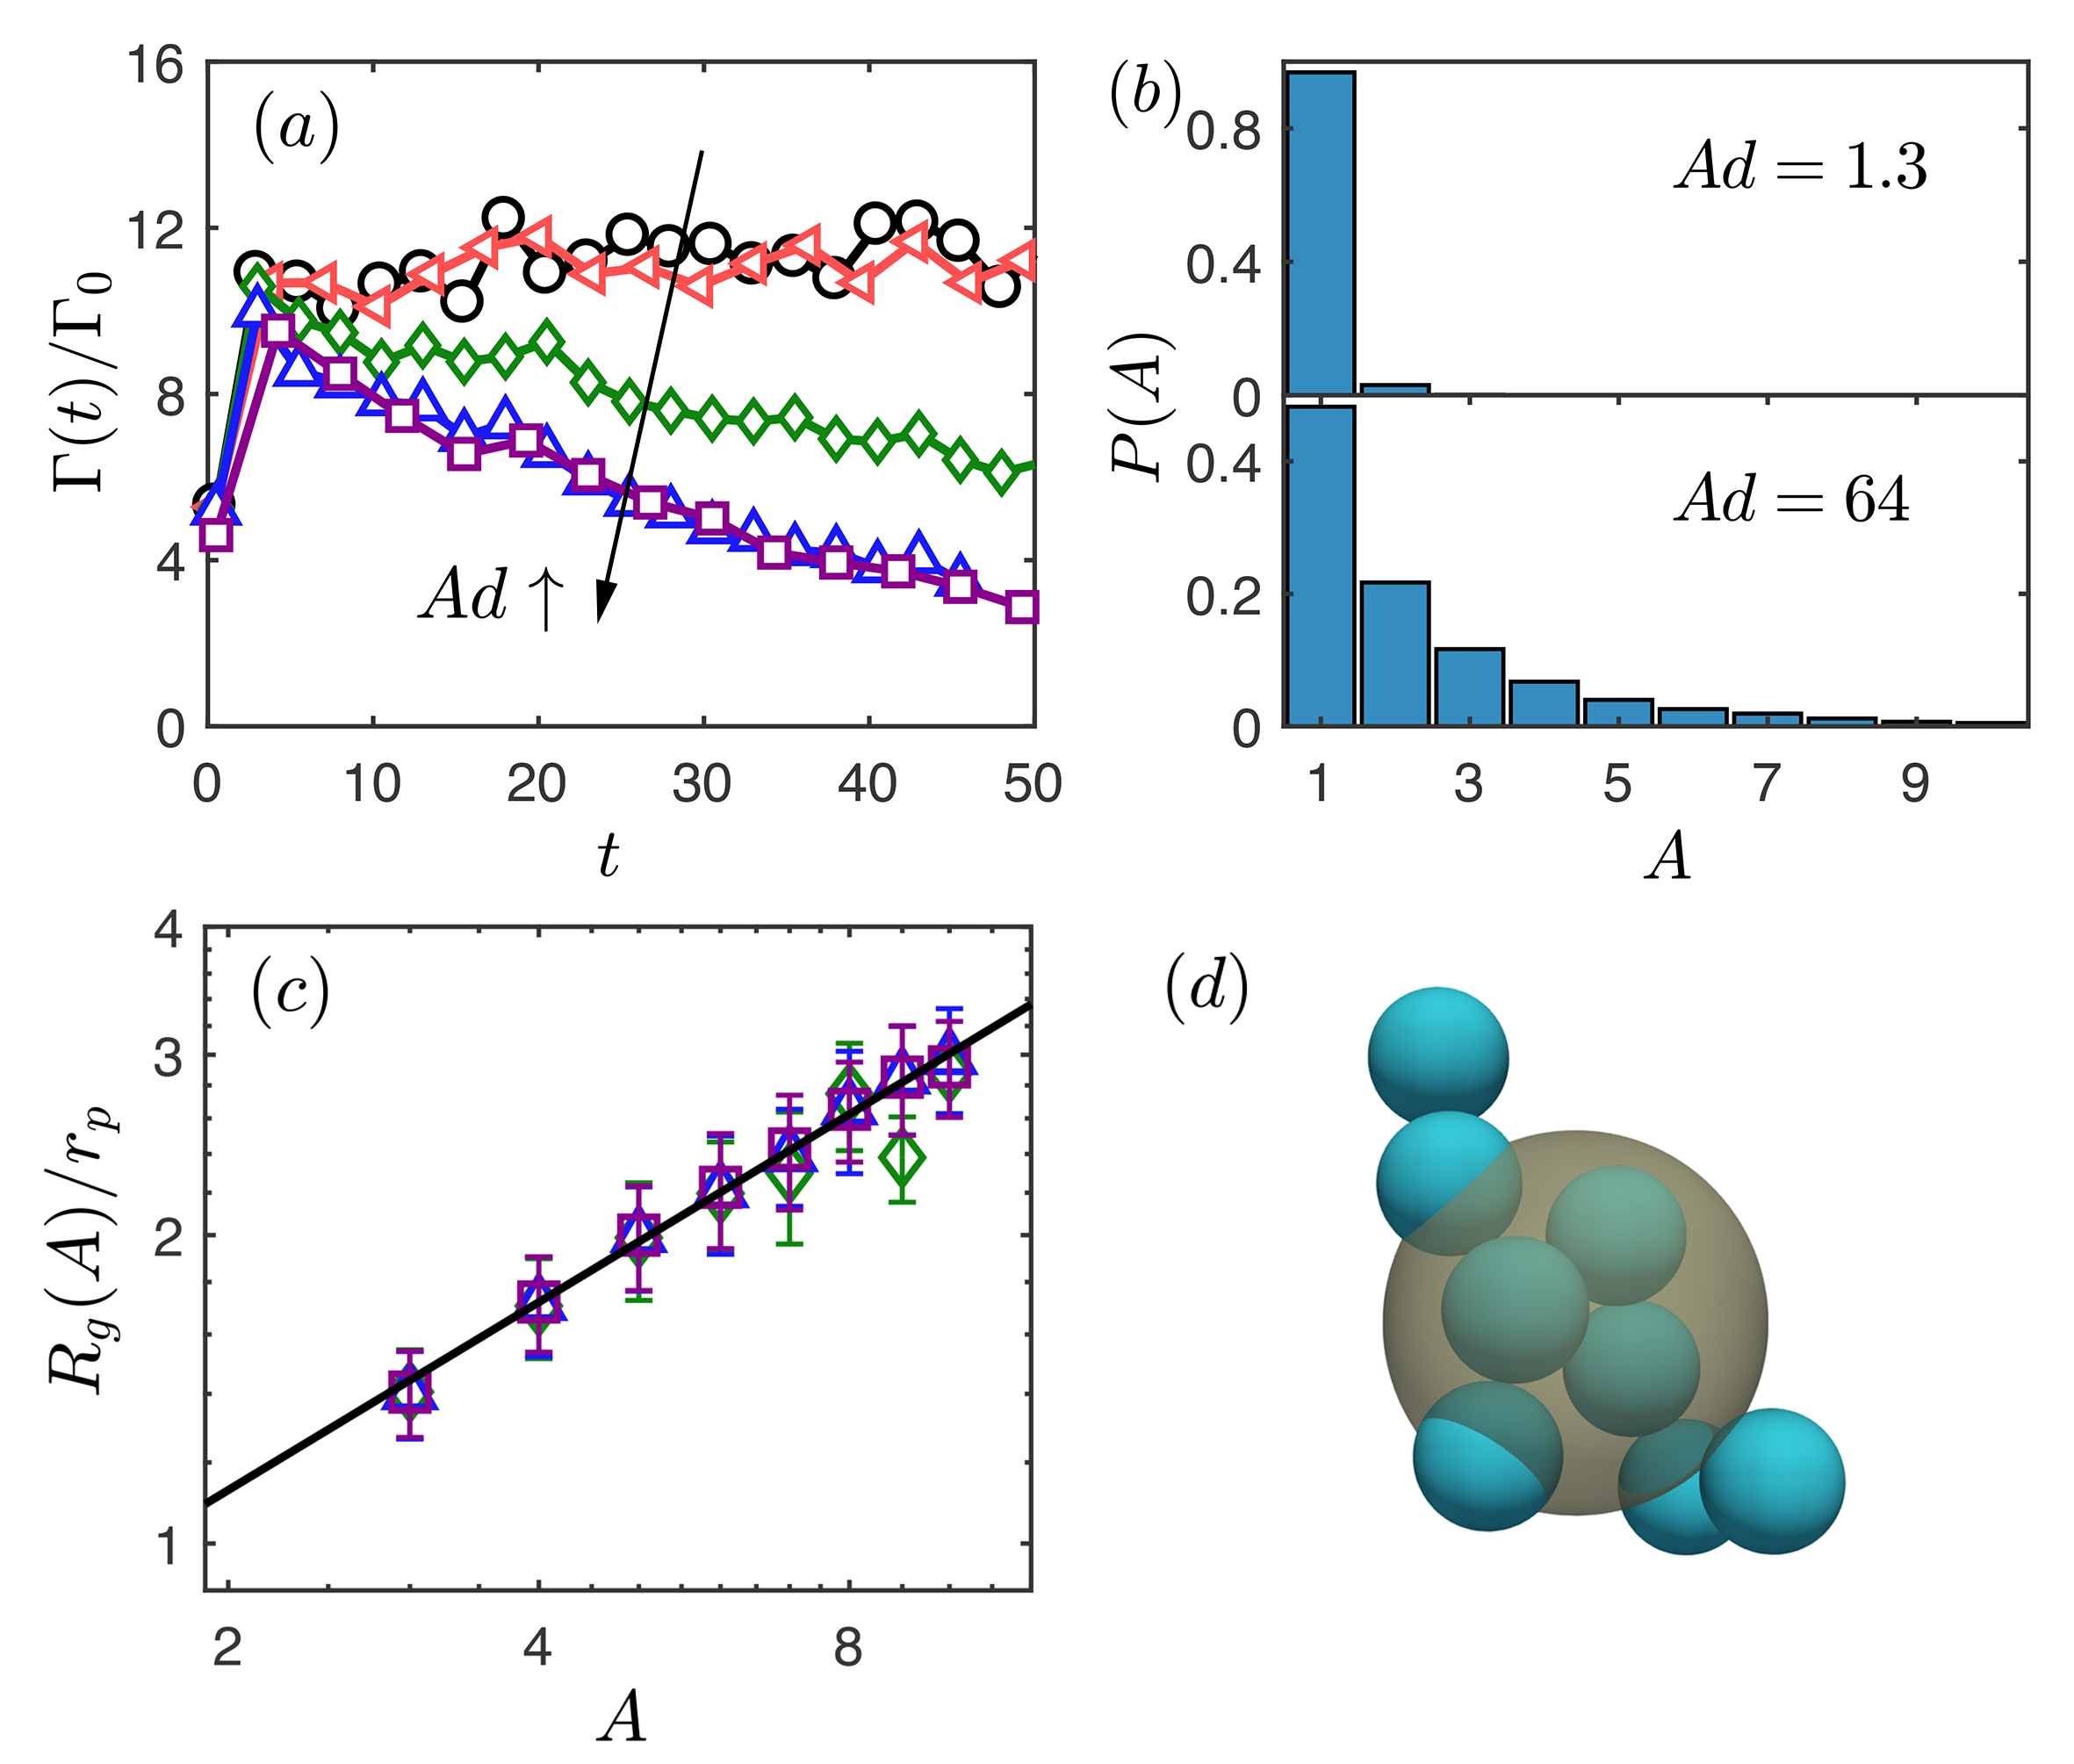
We first measure the temporal evolution of the collision kernel in a system with and varying from to . To show the adhesion effect, here we simply regard the system as a monodisperse system and count the collisions between every primary particle. The collision kernel is then calculated as , where is the number density of primary particles. The temporal evolution of the collision kernel , normalized by the collision kernel for zero-inertia particles Saffman and Turner (1956), is shown in Fig. 2 (a). When the adhesion is extremely weak ( and ), the collision kernel rapidly reaches a statistically steady state with . This value is quite close to the previous DNS results for nonadhesive particles with the same inertia Wang et al. (2000). As increases, the collision kernel is significantly reduced and the system is pushed away from equilibrium. Since adhesion number only affects the interaction between contacting particles, we attribute these phenomena to adhesion-enhanced agglomeration. When is larger than , further increase of does not change the curve of collision kernel. Because in this strong-adhesion limit, the sticking probability for colliding particles is essentially unit and every collision event will lead to agglomeration. The overall collision kernel is determined by the size distribution of the agglomerates in the system, which is mainly determined by the turbulent transport and is insensitive to the adhesion in this large limit.
In Fig. 2 (b), the agglomeration at is clearly displayed in the form of the fraction of particles contained in an agglomerate of size . The agglomerate size is defined as the number of primary particles contained in that agglomerate. For small , most particles remain as singlets () and only a small number of particles () are contained in agglomerates of size . In contrast, cases with large yield a considerable number of agglomerates with size up to .
To model the agglomeration process in the framework of Smoluchowski’s equation, a measure of agglomerate structure in the form of the equivalent sphere is necessary. One such quantity is the radius of gyration, defined for an agglomerate with or more primary particles () by , where denotes the position of particle within the agglomerate and is the centre of mass of the agglomerate. For agglomerates with 2 primary particles, we use the explicit expression suggested by Waldner et al. (2005).
In Fig. 2 (d), we show an agglomerate generated from DNS-DEM simulation and its equivalent sphere with the radius of gyration. We calculate for all the agglomerates produced in the simulations in Fig. 2(a) at and plot the ratio as a function of agglomerate size in Fig. 2 (c) (large size agglomerates with only contain particles thus are neglected here). The results fall onto a power-law curve
| (13) |
with the factor and the fractal dimension . The value measured here is consistent with experimental measurements of Waldner et al. Waldner et al. (2005), who measured the radius of gyration for early-stage agglomerates formed in a stirred tank using small angle static light scattering Waldner et al. (2005). The value of fractal dimension fitted from experimental results is , which is consistent with results of our simulations. Selomulya et al. adopted the same experimental technique to measure the shear-induced agglomeration of latex particles and reported values of between and Selomulya et al. (2001). Their results are close to but slightly larger than the values of measured in our DNS-DEM results. The possible reason for the deviation is that Selomulya et al. assumed the factor to be in their measurements. Such a small value of may give that is larger than the actual value. It should be noted that we focus on the agglomeration at early-stage in the current study, when the restructuring and breakage of agglomerates are normally not involved Waldner et al. (2005). These phenomena will lead to a variation of factor and the fractal dimension Liu et al. (2018), which is left for future work.
III.2 Effect of Stokes number
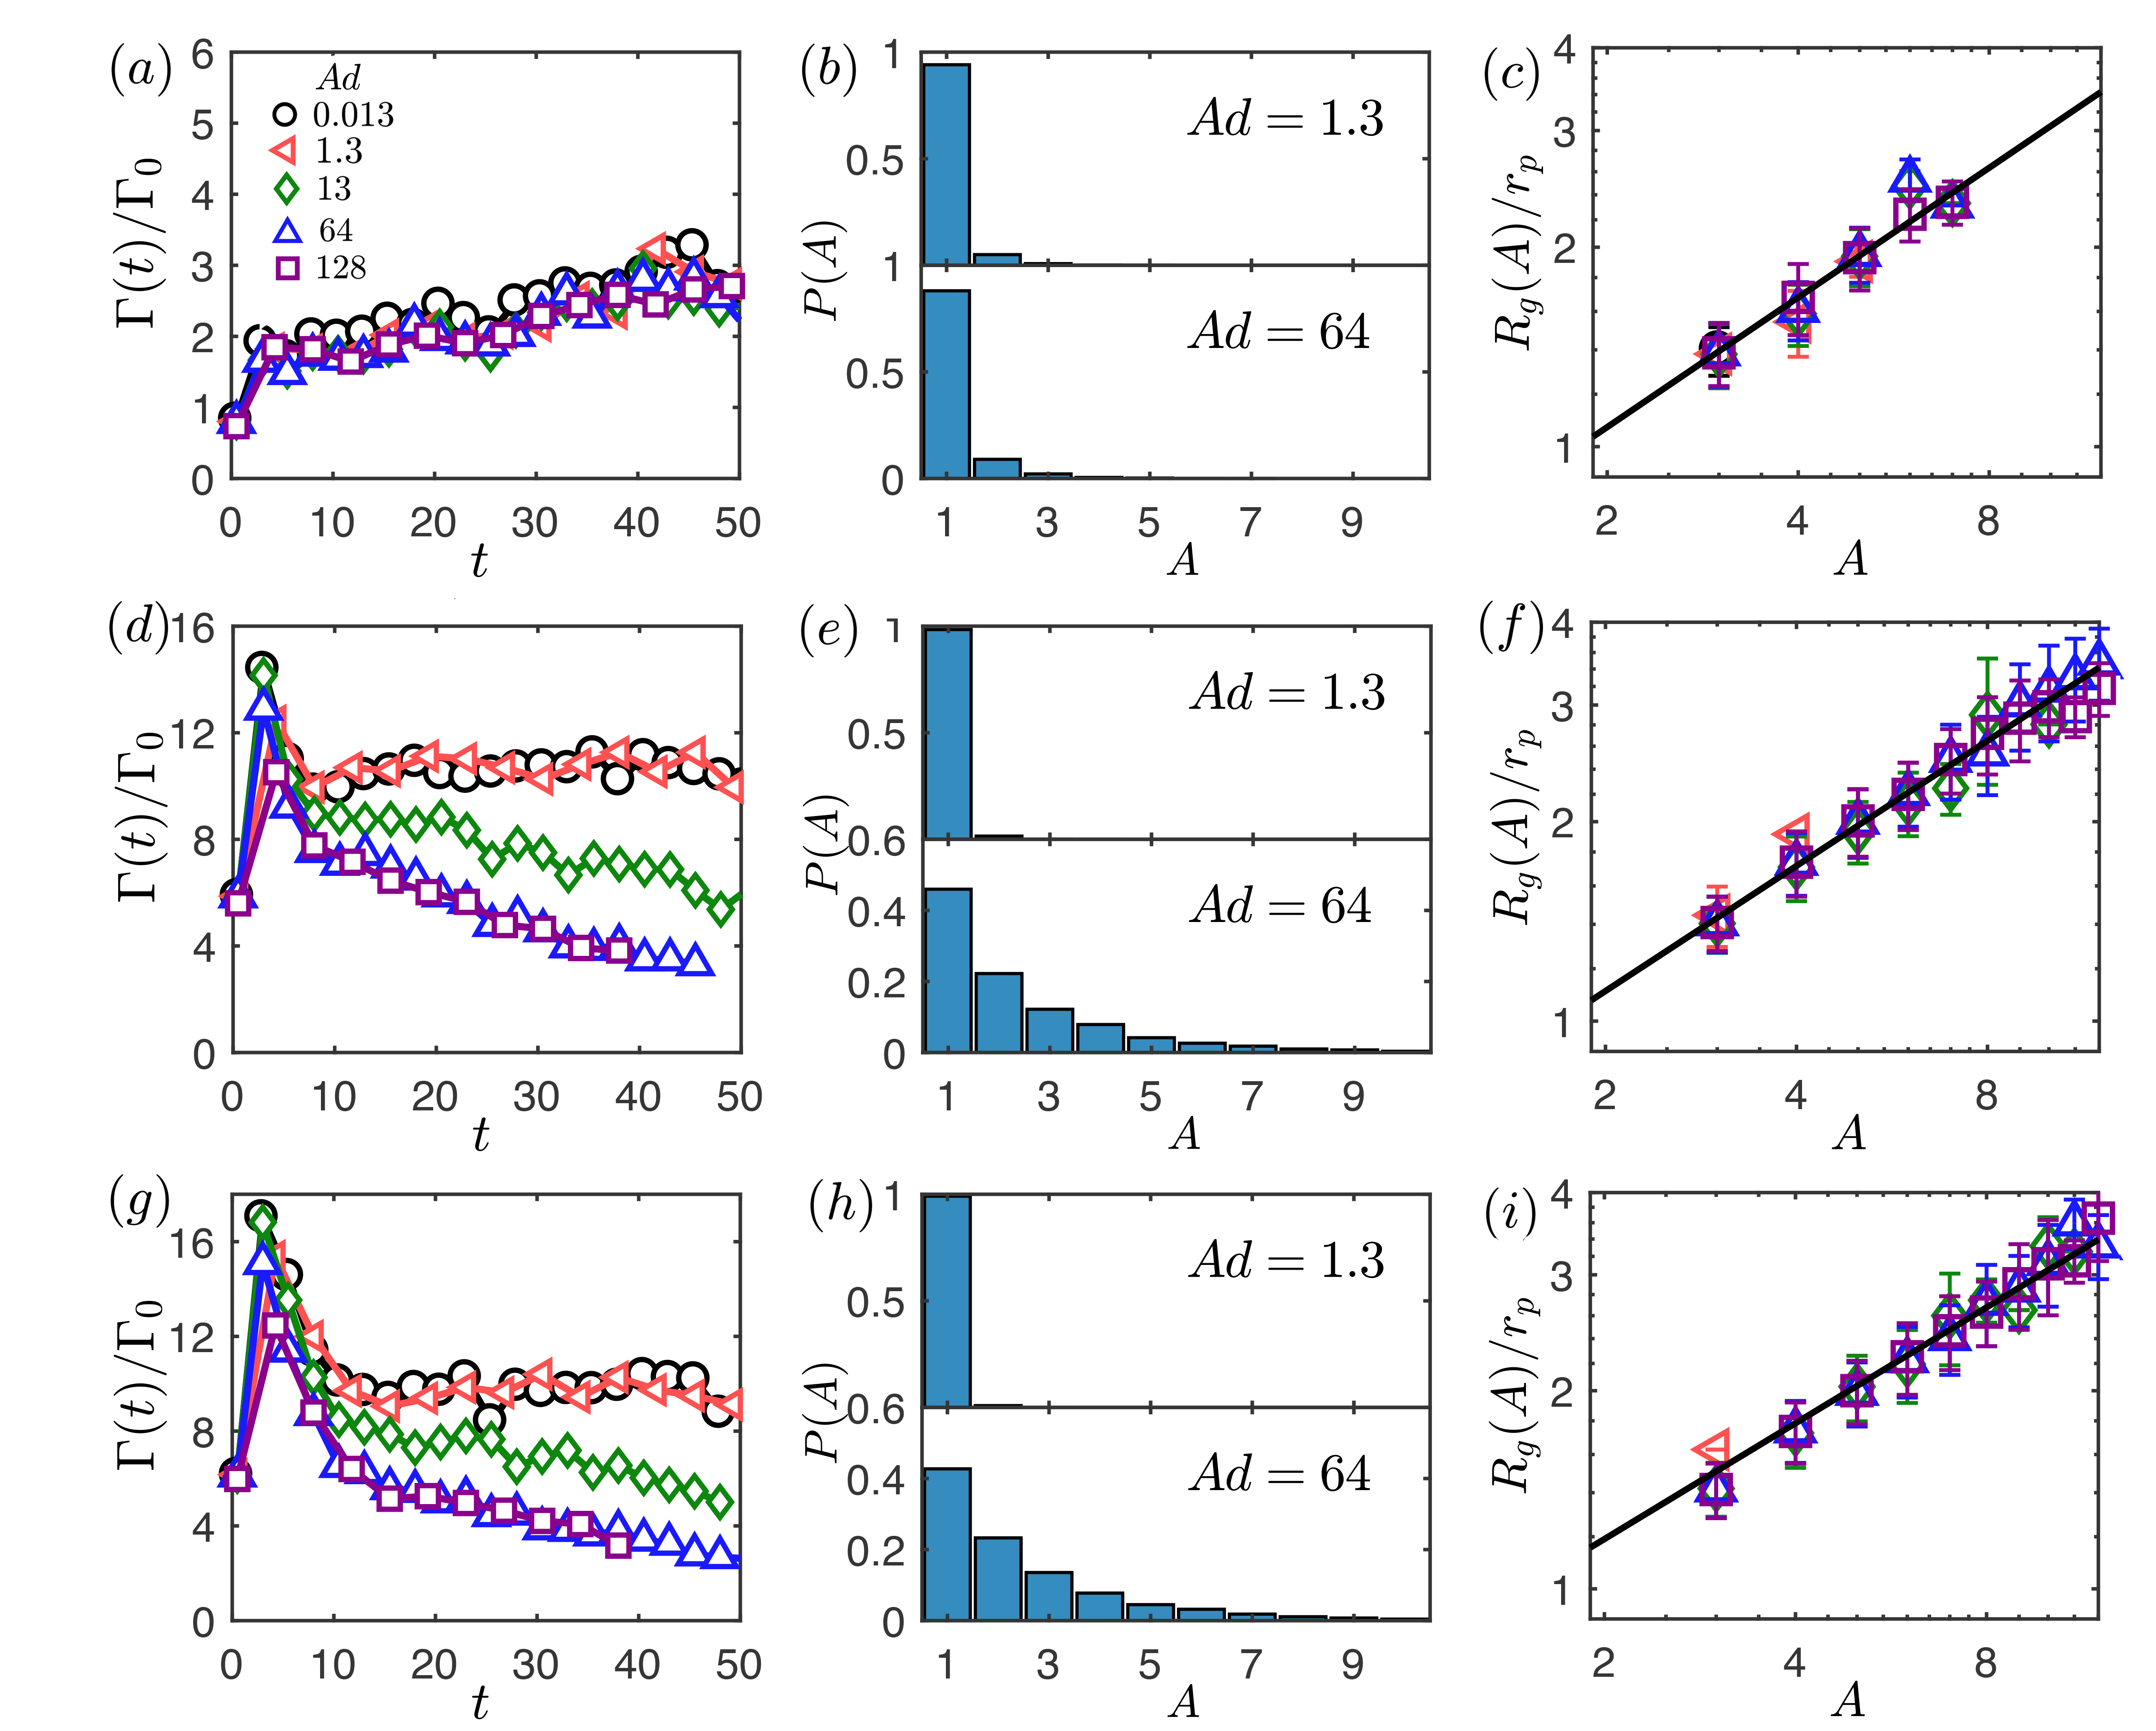
The temporal evolution of the collision kernel , the fraction of particles, , contained in agglomerates of size , and the gyration radius of agglomerates for cases with different Stokes number and adhesion parameter are plotted in Fig. 3. For particles with small inertia (), the increase of adhesion parameter only has a limited effect on the temporal evolution of the collision kernel (Fig. 3(a)). Moreover, there is no obvious statistical steady state for the system with . The reason is that the lubrication force between particles near contact significantly reduces the collision rate for particles with small inertia Marshall (2011) and the collision rate is too small to form a considerable number of agglomerates even if the adhesion is strong. The system thus behaves as a monodisperse system. This is further displayed in the form of the fraction of particles contained in an agglomerate of size (Fig. 3(b)). In both strong and weak adhesion cases, most particles remain as singlets.
For particles with higher Stokes number, or , similar results are observed as those for in Fig.2. In both cases, a statistical steady state can be identified in the temporal evolution of the collision kernel at the small limit (Fig. 3(d) and (g)). When , further increase of does not change the curves. The results once again confirm the existence of the strong adhesion limit. In this limit, one can simply adopt the hit-and-stick assumption - two particles will stick together once there is a contact between them - to simulate the agglomeration without performing DEM calculations. In Fig. 3(e) and (d), we observe similar results as those for in Fig.2(b).
For all the three values of , the radius of gyration for agglomerates of different size can be well described using the power-law function in Eq. (13) (see Fig. 3(c), (f) and (i)). For a given , the factor and fractal dimension are insensitive to the value of adhesion parameter . It suggests that the interparticle adhesion strongly affects the growth rate of early-stage agglomerates but have no obvious impact on their structures. Interestingly, as we mentioned in the previous subsection, the agglomerates formed in different experimental conditions also have similar values of , which further implies that the influences of flow conditions and interparticle adhesion on the structure of agglomerates may be significant only if the size of agglomerates is sufficiently large Liu et al. (2018).
III.3 Exponential scaling of early stage agglomerate size
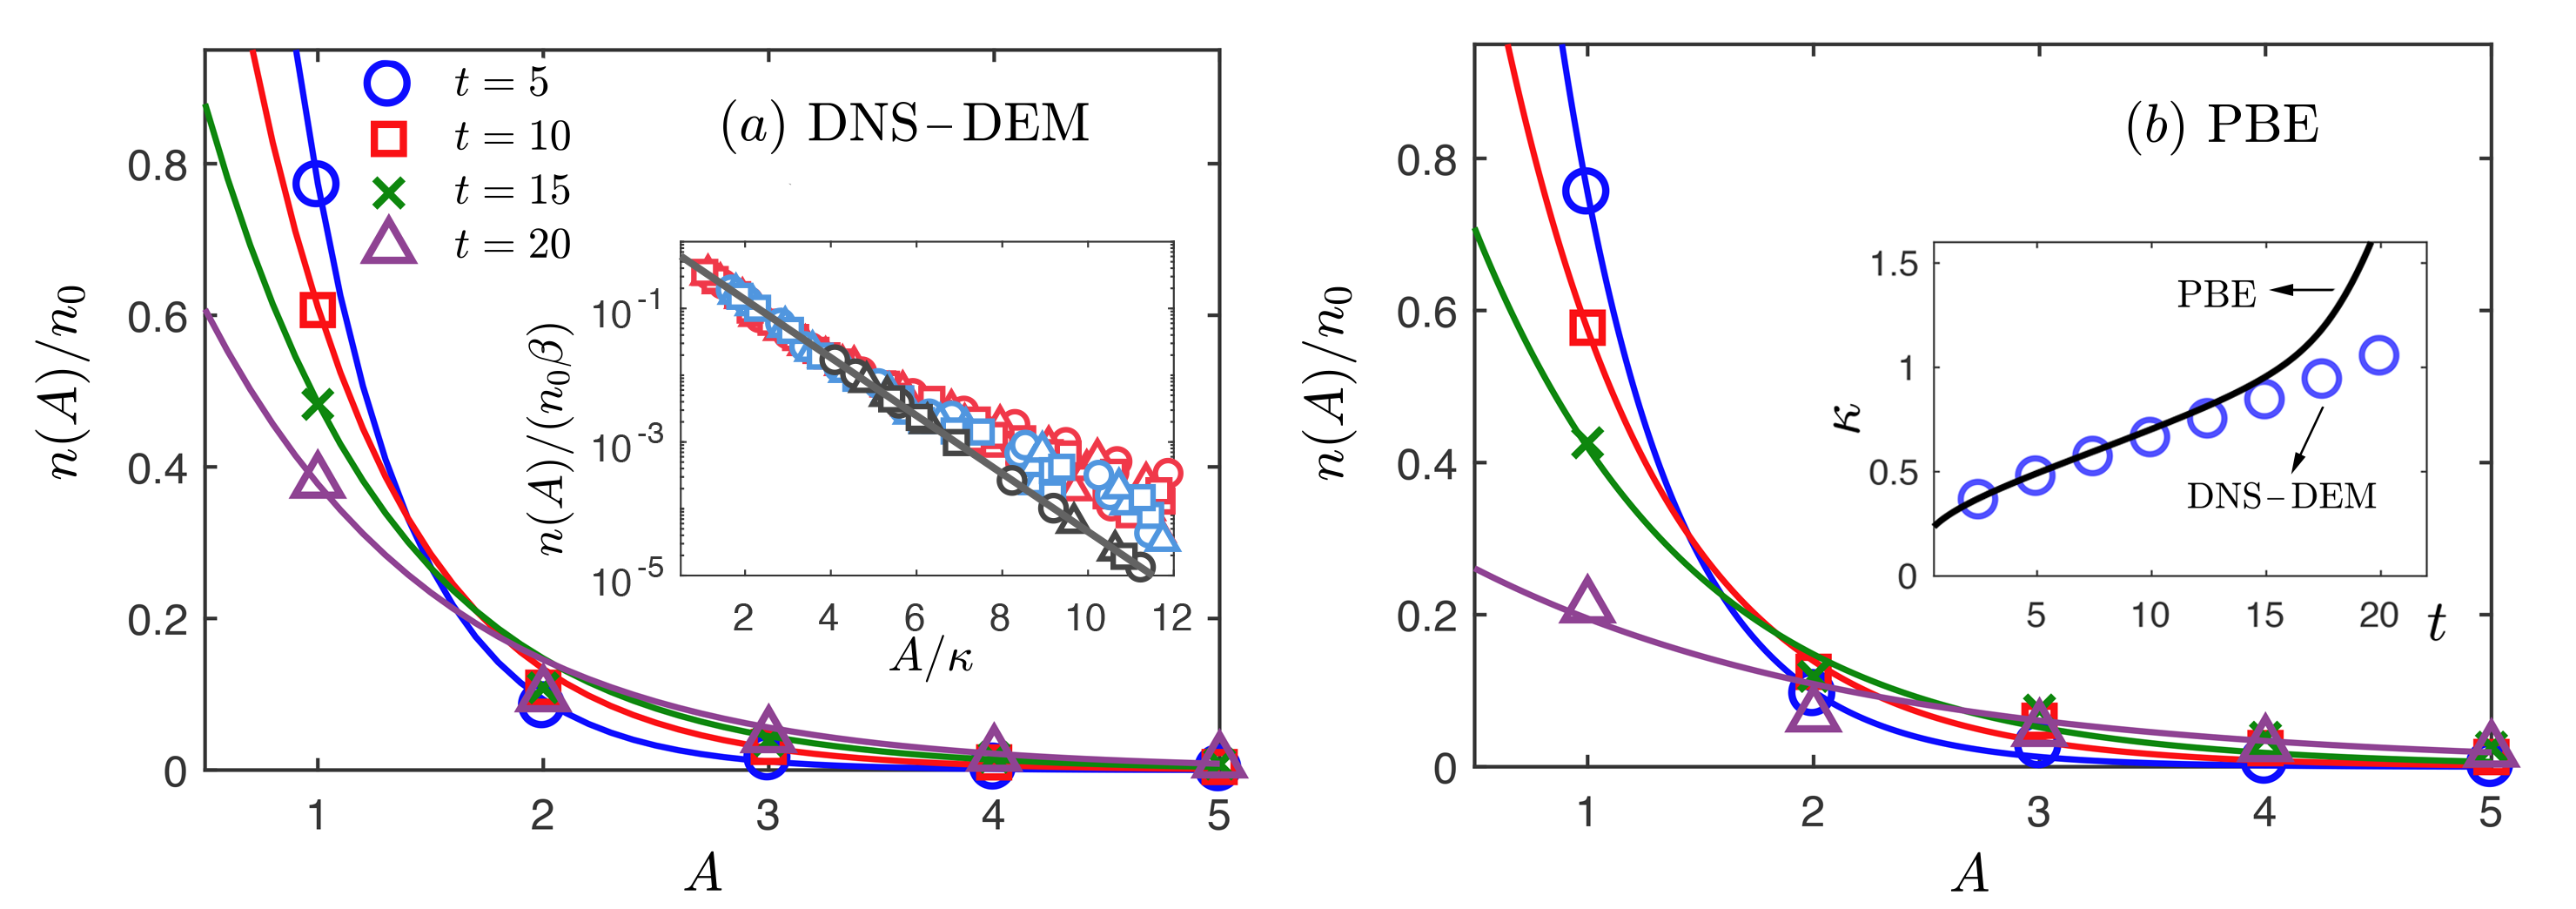
Fig. 4(a) shows the distributions of number density of agglomerates as a function of size at early-stage (). These distributions, when scaled by the initial number density of primary particles , follow an exponential equation (solid lines in Fig. 4(a))
| (14) |
with the coefficients and depending on time. Based on the conservation of the total number of primary particles, , the prefactor can be expressed as . Therefore, the size distribution of early-stage agglomerates is determined by a single scale parameter , which gives a typical value of the size of agglomerates. A larger value of means that there are more particles contained in agglomerates with larger size and the growth of early-stage agglomerates can be characterized by the increase of . In the inset of Fig. 4(a), the number density distributions for cases with , , and and , , and are plotted in a rescaled form, . Except for the deviation in tail caused by agglomerates with , the results center around the curve , suggesting that the exponential scaling for early-stage agglomeration is valid for inertial particles across a wide range of adhesion force magnitudes.
A comparison between the exponential distribution and the well-known self-preserving size distribution for Brownian nanoparticles Friedlander and Wang (1966); Vemury and Pratsinis (1995); Eggersdorfer and Pratsinis (2014) would be of interest. If the collision kernels are homogeneous functions of the volume of colliding particles and the degree of homogeneity smaller than unity, the particle size distribution will reach a self-preserving shape (normally bell-shaped). In that case, tracking the evolution of the mean agglomerate size is sufficient to describe the growth of agglomerates. Although, both the exponential distribution in Eq. (14) and the self-preserving size distribution are single-parameter distributions, there is a fundamental difference between them. The exponential distribution describes the transition behavior at the early-stage of the agglomeration when most particles remain as singlets and is no longer valid when there is a considerable number of large agglomerates. In contrast, the self-preserving size distribution is an asymptotic limit which is invariant with time.
Now we introduce how to construct the agglomeration kernel that can be applied to Smoluchowski’s theory based on DNS-DEM results. We first look at the strong adhesion case by assuming that particles will stick together upon collisions (i.e., ) and then show how adhesion influences the sticking probability. For spherical particles, is given by
| (15) |
where is the collision radius, is the average radial relative velocity and is the radial distribution function at contact. Explicit expressions of these quantities are summarized in Zhou et al. (2001). Since turbulence parameters are fixed here, , and are determined by particle size and . For collisions between agglomerates, we simply use the radius of gyration in Eq. (13) with known values of and instead of the particle radius to calculate all the quantities in Eq. (15) Jullien and Meakin (1989); Jiang and Logan (1991); Elimelech et al. (1998). For instance, the collision radius for an agglomerate with primary particles and that with primary particles is calculated as . The gyration radius is given by Eq. (13) when and and for and , respectively. Given the initial conditions, and for , PBEs in Eq. (11) are numerically integrated using a sufficiently small time step with the agglomerate size truncated at (i.e., assuming for ). As a result, we can get the evolution of the number density for each size group. PBE calculations are much faster than DNS-DEM, since PBEs only solve for the number density at each time step rather than resolve the motion of every particle.
We plot the scaled number density calculated from PBE in Fig. 4(b). It is shown that results from PBE well reproduce the results of DNS-DEM in Fig.4(a) when . We then fit the scaled distribution using the Eq. (14) at each and get the evolution of the scale parameter , which is in good agreement with the DNS results when (see the inset of Fig. 4(b)). It indicates that the kernel constructed in the form of gyration radius readily reflects the effect of the fractal structure of agglomerates on the agglomeration. At , the distribution of from PBE still follows the exponential form, however, a non-negligible deviation between PBE results and those from DNS-DEM is observed. Such deviation may be attributed to two reasons. First, does not contain information of breakage or rearrangement, which is expected to be significant for large-size agglomerates Dizaji and Marshall (2017). Moreover, statistics may also get worse when the total number of agglomerates reduces.
III.4 Effect of adhesion on growth of agglomerates
When the adhesion is relatively weak, a collision between two particles or agglomerates does not ensure the formation of a larger agglomerate. The adhesive DEM approach can capture the effect of adhesion on the agglomeration without any additional models. However, when designing large-scale devices, one does not need to know the information of every single particle, instead, knowing the size distribution is enough. In those cases, solving the population balance equations is more feasible. Therefore, it is of significance to check if the complicated effect of particle-particle contacting interactions on the growth kinetics of agglomerates can be captured by the sticking probability (given in Eq. (12)).
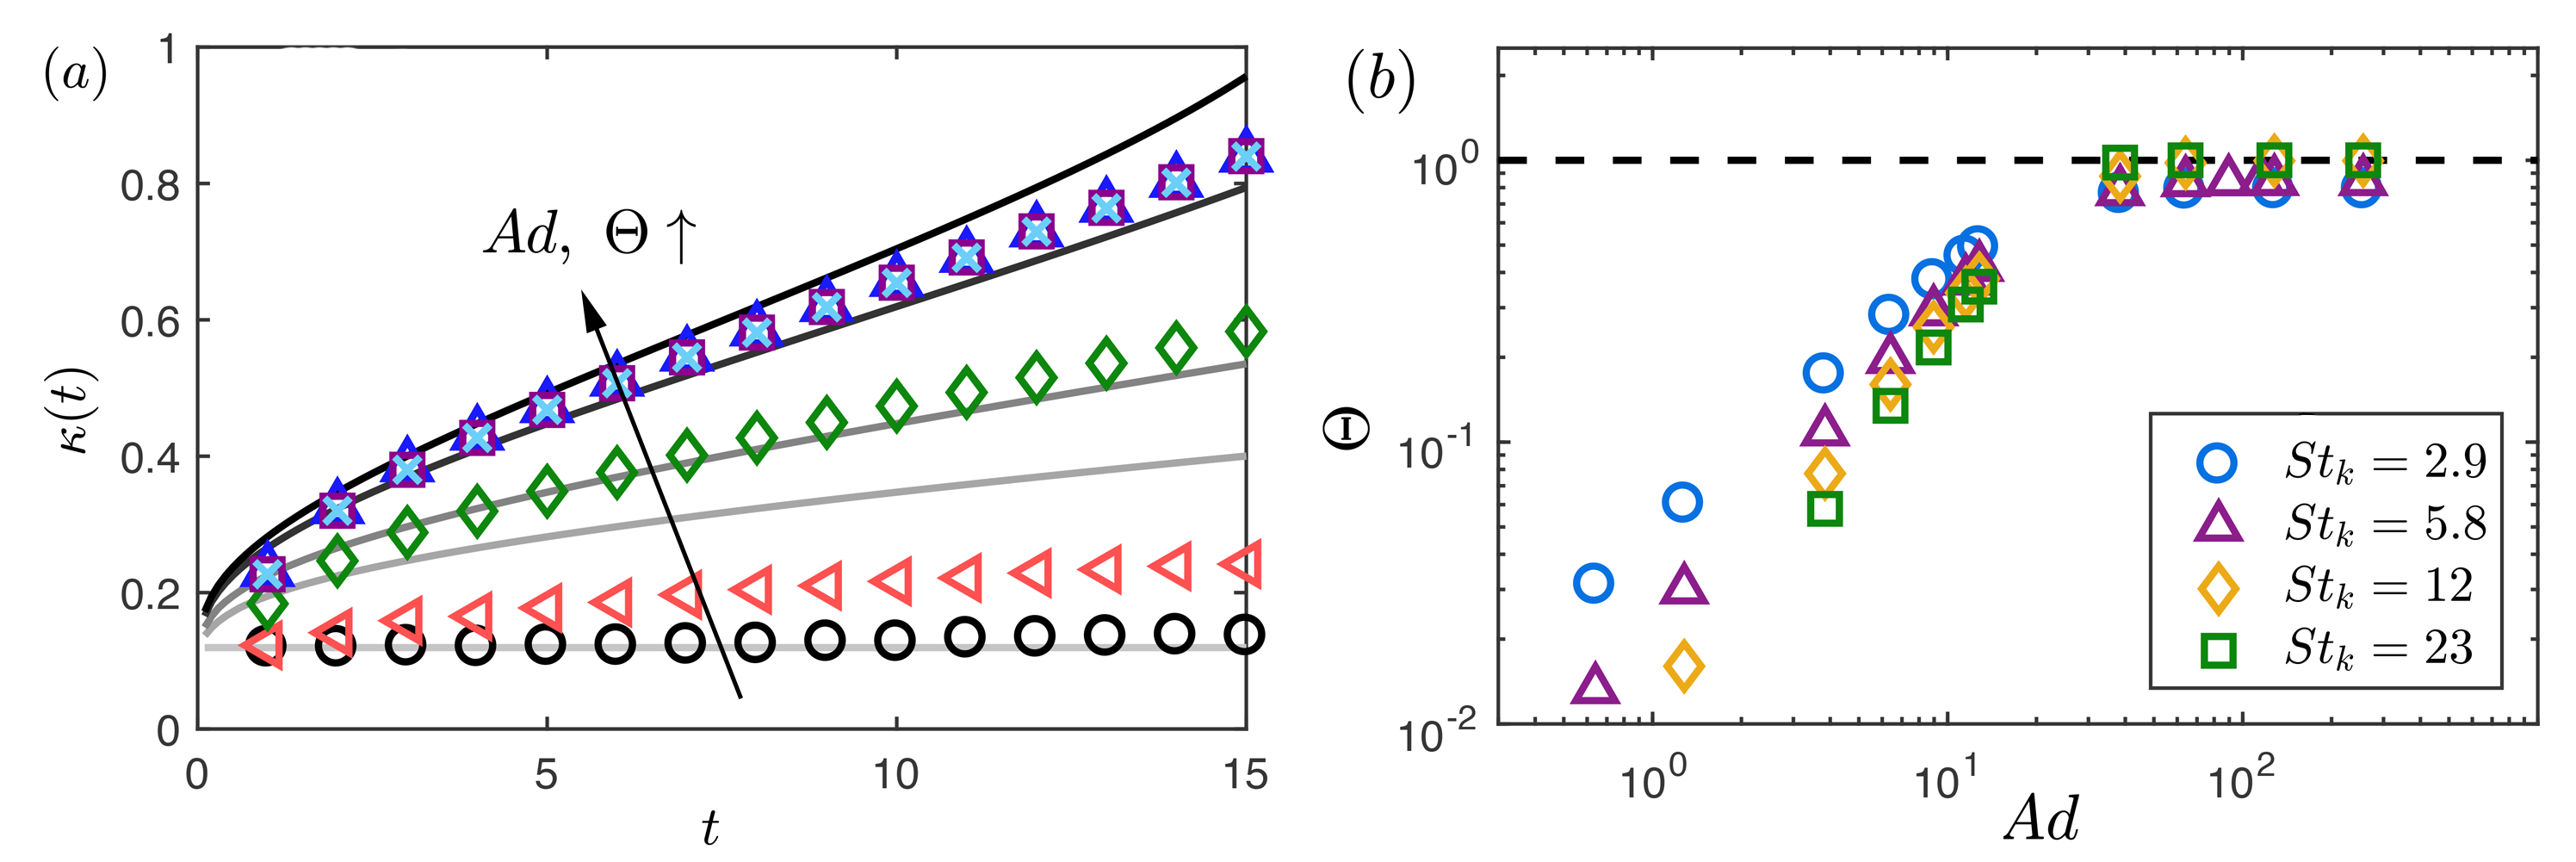
We solve PBE using agglomeration kernel with increasing from to (see Eq. (12)). The evolution of the scale parameter is shown as solid lines in Fig. 5(a). It is evident from the results that a smaller sticking probability leads to a lower growth rate of agglomerates. We also plot corresponding results from DNS-DEM simulations with different values of adhesion parameter as data points in Fig. 5(a). For , is close to the PBE results with sticking probability , indicating that almost no agglomerates are formed given such a weak adhesive force. As increases beyond , the curves converge to the PBE result with sticking probability . This strong adhesion case corresponds to the conventional PBE simulations, where the hit-and-stick assumption is made. Our results here suggest that PBE can also simulate the agglomeration process for particles with relatively weak adhesion once the sticking probability is adopted.
We then determine the value of the sticking probability in a statistical manner based on our DNS-DEM data. For a given , we extract the instantaneous value of the scaling parameter from DNS-DEM simulations and map this point out on Fig. 5(a) and find the PBE curve of that the point sits on. This procedure instantaneously correlates to . Then time-averaging is performed to get the sticking probability at this given :
| (16) |
In Fig. 5(b), we plot for , , , and . With , the sticking probability for any is smaller than and the data points of different are rather scattered. In contrast, when , there is an adhesion-controlled regime, in which is mainly determined by . Particularly, the unit sticking probability, , which corresponds to the hit-and-stick situation, is achieved when is larger than .
III.5 Modelling sticking probability
Describing turbulence-induced agglomeration using PBE requires knowledge of the sticking probability a priori. Therefore, it is of significance to relate to the particle-level properties. We consider a head-on collision between two primary particles with being the relative collision velocity. For simplicity, only the normal forces in Eq. (6a) are taken into account and the interparticle overlap evolves according to
| (17) |
with the initial conditions and . The contact between the particles is built up when and is broken when . Normalizing the overlap using its critical value and the time using , we have the following non-dimensional form of Eq. (17):
| (18) |
The damping coefficient is an input parameter and the scaled radius can be calculated inversely through Eq. (7). The results of a collision are determined by the parameter , which is defined as
| (19) |
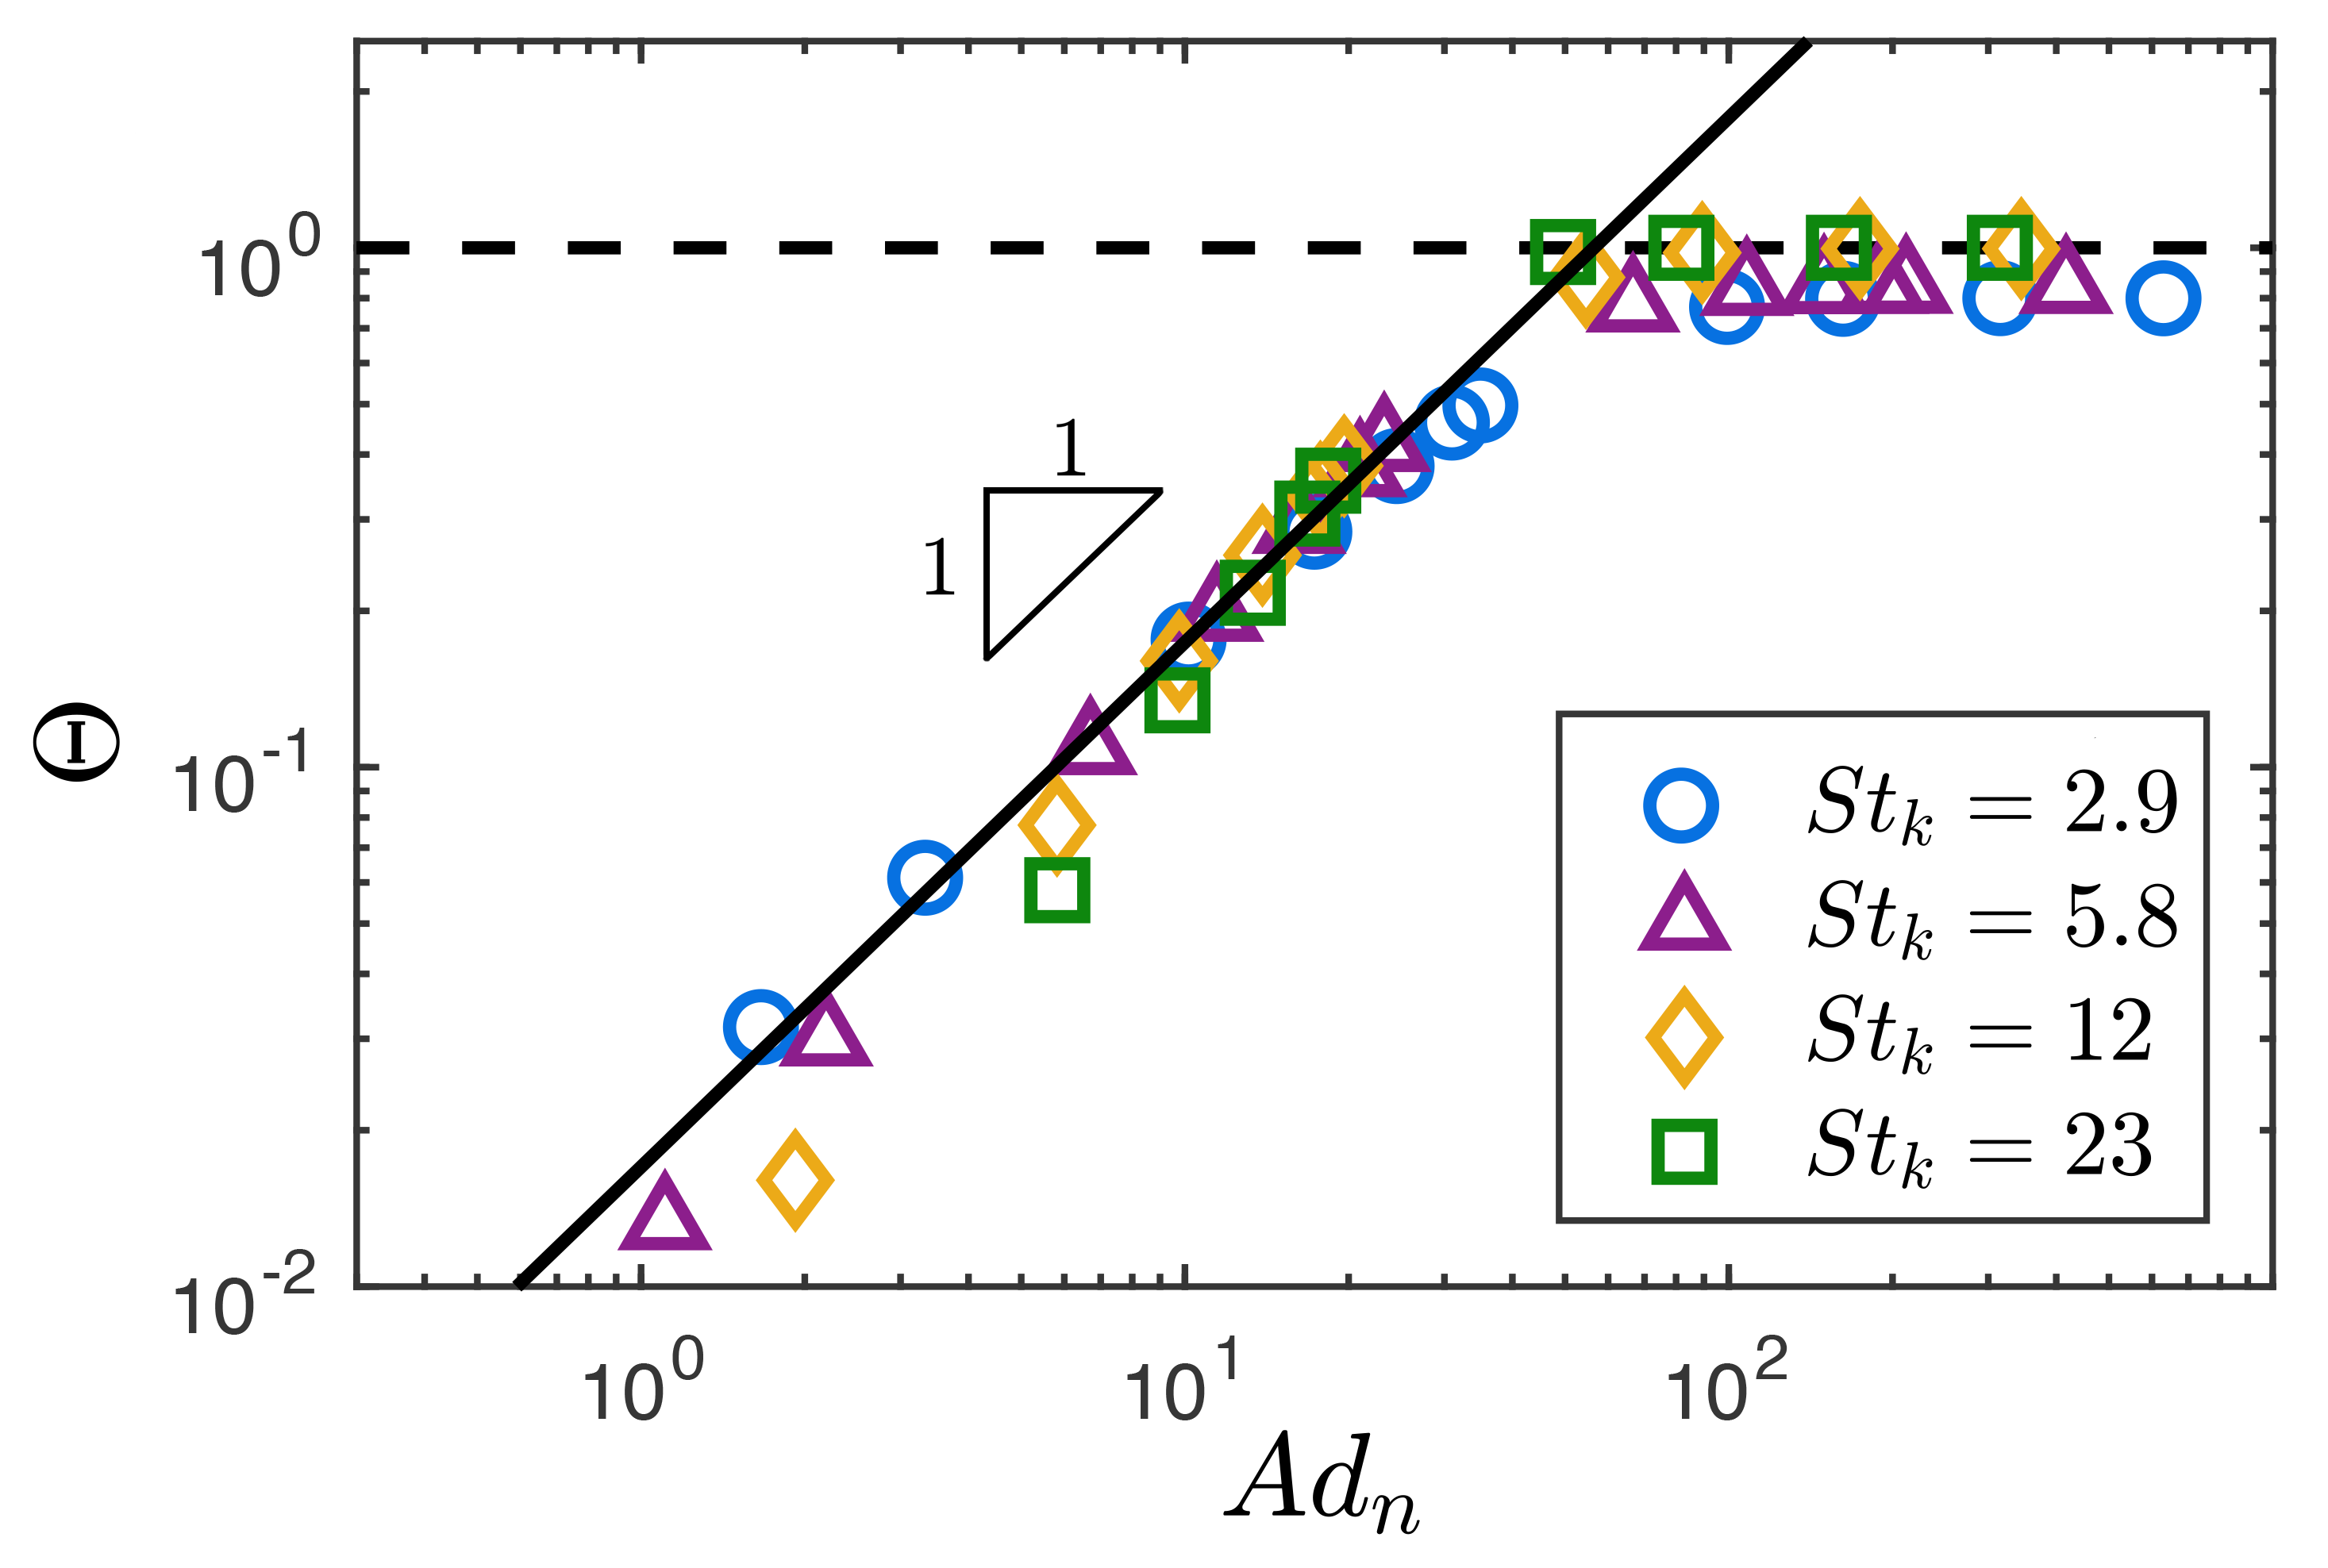
From Eq. (19) and a simple dimensional analysis, it is obvious that the effect of the adhesion (i.e., the surface energy ) on the sticking probability is determined by the dimensionless adhesion parameter , which is defined based on the normal collision velocity . We measure the value of for every collision event in each simulation run and use the mean value as the typical velocity scale. A modified adhesion parameter then is given as
| (20) |
In Fig. 6, we replot the data of Fig. 5(b) in the plane and all the data points collapse onto two curves:
| (21) |
The results in Fig. 6 indicate that the mean relative collision velocity is an appropriate choice to scale the effect of adhesion and the sticking probability can be well estimated once is known. Here, the data points for cases with are neglected, since the sticking probability is less than , which is too small to ensure good statistics. It should be noted that current values of are measured from DNS-DEM. To avoid computationally expensive DNS-DEM calculation, one can also adopt analytical expressions to estimate the value of (see Pan and Padoan (2013, 2010); Ayala et al. (2008); Rani et al. (2014)).
IV Conclusions
In summary, for adhesive inertial particles suspended in turbulence, we measure both the collision rate, the structure and the size distribution of early-stage agglomerates with varying adhesion. We find that the collision rate is significantly reduced due to the adhesion-induced agglomeration. As the value of adhesion parameter increases, the system reaches a strong-adhesion limit, in which the sticking probability for colliding particles is unit and further increase of does not affect the dynamics of agglomeration. We also find that the size distribution of early-stage agglomerates follows an exponential equation regardless of the adhesion force magnitude. The transient dynamics of agglomeration at early-stage thus can be characterized using a single scale parameter . This finding may help to reduce the computing complexity of the population balance equation (PBE) to that of monodisperse systems since only one parameter needs to be solved. The evolution of then serves as an indicator for the quantitative comparison between DNS-DEM and PBE simulations. We show that, by introducing an agglomeration kernel constructed in terms of gyration radius of agglomerates and a sticking probability , PBE can well reproduce the results of DNS-DEM. A relationship between the sticking probability and particle properties is then proposed based on the scaling analysis of the equation for head-on collisions.
There are several interesting directions for future study. First, the current work focuses on the early-stage agglomeration, where the breakage and the rearrangement of agglomerates are not significant. It is unclear to what extend the framework developed here can be extended to situations with large agglomerates Dizaji et al. (in press, 2019). It requires one to construct kernel functions that contain information about breakage and restructuring Spicer and Pratsinis (1996); Pandya and Spielman (1983). Moreover, we fix the value of Taylor-microscale Reynolds number in the current work. It is reported that the relative velocity and the collision rate for inertial particles increase strongly with increasing Wang et al. (2000); Zhou et al. (2001); Ireland et al. (2016b). However, a stronger clustering effect may suppress the agglomeration Liu and Hrenya (2018). A quantitative characterization of competing effects of the increasing collision rate and the decreasing sticking probability as increases would be of great interest.
Acknowledgements
SQL acknowledges support from the National Fund for Distinguished Young Scholars of China (51725601) and National Key Research and Development Program of China (2016YFB0600602). The authors thank Prof. Q. Yao at Tsinghua, Prof. L. Mädler at the University of Bremen and Dr. W. Liu at University of Surrey for useful suggestions.
References
- Saw et al. (2008) E. W. Saw, R. A. Shaw, S. Ayyalasomayajula, P. Y. Chuang, and A. Gylfason, “Inertial clustering of particles in high-Reynolds-number turbulence,” Physical Review Letters 100, 214501 (2008).
- Lu et al. (2010) J. Lu, H. Nordsiek, E. W. Saw, and R. A. Shaw, “Clustering of charged inertial particles in turbulence,” Physical Review Letters 104, 184505 (2010).
- Bec et al. (2014) J. Bec, H. Homann, and S. S. Ray, “Gravity-driven enhancement of heavy particle clustering in turbulent flow,” Physical Review Letters 112, 184501 (2014).
- Gustavsson et al. (2014) K. Gustavsson, S. Vajedi, and B. Mehlig, “Clustering of particles falling in a turbulent flow,” Physical Review Letters 112, 214501 (2014).
- Balachandar and Eaton (2010) S. Balachandar and J. K. Eaton, “Turbulent dispersed multiphase flow,” Annual Review of Fluid Mechanics 42, 111–133 (2010).
- Smoluchowski (1917) M Smoluchowski, “Versuch einer mathematischen theorie der koagulationskinetik kolloider lösungen,” Zeitschrift für physikalische Chemie 92, 129–168 (1917).
- Friedlander (2000) S. K. Friedlander, Smoke, Dust, and Haze: Fundamentals of Aerosol Dynamics (2000).
- Pumir and Wilkinson (2016) A. Pumir and M. Wilkinson, “Collisional aggregation due to turbulence,” Annual Review of Condensed Matter Physics 7, 141–170 (2016).
- Saffman and Turner (1956) P.G.F. Saffman and J.S. Turner, “On the collision of drops in turbulent clouds,” Journal of Fluid Mechanics 1, 16–30 (1956).
- Abrahamson (1975) J. Abrahamson, “Collision rates of small particles in a vigorously turbulent fluid,” Chemical Engineering Science 30, 1371–1379 (1975).
- Sundaram and Collins (1997) S. Sundaram and L. R. Collins, “Collision statistics in an isotropic particle-laden turbulent suspension. Part 1. direct numerical simulations,” Journal of Fluid Mechanics 335, 75–109 (1997).
- Wang et al. (2000) L. P. Wang, A. S. Wexler, and Y. Zhou, “Statistical mechanical description and modelling of turbulent collision of inertial particles,” Journal of Fluid Mechanics 415, 117–153 (2000).
- Zhou et al. (2001) Y. Zhou, A. S. Wexler, and L. P. Wang, “Modelling turbulent collision of bidisperse inertial particles,” Journal of Fluid Mechanics 433, 77–104 (2001).
- Gustavsson and Mehlig (2016) K. Gustavsson and B. Mehlig, “Statistical model for collisions and recollisions of inertial particles in mixing flows,” The European Physical Journal E 39, 55 (2016).
- Wilkinson and Mehlig (2005) M. Wilkinson and B. Mehlig, “Caustics in turbulent aerosols,” Europhysics Letters 71, 186 (2005).
- Gustavsson and Mehlig (2011) K. Gustavsson and B. Mehlig, “Distribution of relative velocities in turbulent aerosols,” Physical Review E 84, 045304 (2011).
- Falkovich and Pumir (2007) G. Falkovich and A. Pumir, “Sling effect in collisions of water droplets in turbulent clouds,” Journal of the Atmospheric Sciences 64, 4497–4505 (2007).
- Jaworek et al. (2018) A. Jaworek, A. Marchewicz, A. T. Sobczyk, A. Krupa, and T. Czech, “Two-stage electrostatic precipitators for the reduction of PM2.5 particle emission,” Progress in Energy and Combustion Science 67, 206–233 (2018).
- Jarvis et al. (2005) P. Jarvis, B. Jefferson, J. Gregory, and S. A. Parsons, “A review of floc strength and breakage,” Water Research 39, 3121–3137 (2005).
- Blum et al. (2000) J. Blum, G. Wurm, S. Kempf, T. Poppe, H. Klahr, T. Kozasa, M. Rott, T. Henning, J. Dorschner, R. Schräpler, et al., “Growth and form of planetary seedlings: Results from a microgravity aggregation experiment,” Physical Review Letters 85, 2426 (2000).
- Tien et al. (1977) C. Tien, C. S. Wang, and D. T. Barot, “Chainlike formation of particle deposits in fluid-particle separation,” Science 196, 983–985 (1977).
- Chen et al. (2016) S. Chen, W. Liu, and S. Q. Li, “Effect of long-range electrostatic repulsion on pore clogging during microfiltration,” Physical Review E 94, 063108 (2016).
- Marshall and Li (2014) J. S. Marshall and S. Q. Li, Adhesive Particle Flow (Cambridge University Press, 2014).
- Bec et al. (2013) J. Bec, S. Musacchio, and S. S. Ray, “Sticky elastic collisions,” Physical Review E 87, 063013 (2013).
- Marshall (2009) J. S. Marshall, “Discrete-element modeling of particulate aerosol flows,” Journal of Computational Physics 228, 1541–1561 (2009).
- Dizaji and Marshall (2017) F. F. Dizaji and J. S. Marshall, “On the significance of two-way coupling in simulation of turbulent particle agglomeration,” Powder Technology 318, 83–94 (2017).
- Sommerfeld (2001) M. Sommerfeld, “Validation of a stochastic lagrangian modelling approach for inter-particle collisions in homogeneous isotropic turbulence,” International Journal of Multiphase Flow 27, 1829–1858 (2001).
- Almohammed and Breuer (2016) N. Almohammed and M. Breuer, “Modeling and simulation of agglomeration in turbulent particle-laden flows: A comparison between energy-based and momentum-based agglomeration models,” Powder Technology 294, 373–402 (2016).
- Lundgren (2003) T. S. Lundgren, Linearly forces isotropic turbulence, Tech. Rep. (MINNESOTA UNIV MINNEAPOLIS, 2003).
- Rosales and Meneveau (2005) C. Rosales and C. Meneveau, “Linear forcing in numerical simulations of isotropic turbulence: Physical space implementations and convergence properties,” Physics of Fluids 17, 095106 (2005).
- Di Felice (1994) R. Di Felice, “The voidage function for fluid-particle interaction systems,” International Journal of Multiphase Flow 20, 153–159 (1994).
- Saffman (1965) P. G. T. Saffman, “The lift on a small sphere in a slow shear flow,” Journal of Fluid Mechanics 22, 385–400 (1965).
- Rubinow and Keller (1961) S. I. Rubinow and J. B. Keller, “The transverse force on a spinning sphere moving in a viscous fluid,” Journal of Fluid Mechanics 11, 447–459 (1961).
- Chen et al. (2019) S. Chen, Wenwei Liu, and Shuiqing Li, “A fast adhesive discrete element method for random packings of fine particles,” Chemical Engineering Science 193, 336–345 (2019).
- Sümer and Sitti (2008) B. Sümer and M. Sitti, “Rolling and spinning friction characterization of fine particles using lateral force microscopy based contact pushing,” Journal of Adhesion Science and Technology 22, 481–506 (2008).
- Yang et al. (2013) Mengmeng Yang, Shuiqing Li, and Qiang Yao, “Mechanistic studies of initial deposition of fine adhesive particles on a fiber using discrete-element methods,” Powder Technology 248, 44–53 (2013).
- Li and Marshall (2007) S. Q. Li and J. S. Marshall, “Discrete element simulation of micro-particle deposition on a cylindrical fiber in an array,” Journal of Aerosol Science 38, 1031–1046 (2007).
- Chen et al. (2015) S. Chen, S. Q. Li, and M. Yang, “Sticking/rebound criterion for collisions of small adhesive particles: Effects of impact parameter and particle size,” Powder Technology 274, 431–440 (2015).
- Liu et al. (2015) W. Liu, S. Q. Li, A. Baule, and H. A. Makse, “Adhesive loose packings of small dry particles,” Soft Matter 11, 6492–6498 (2015).
- Liu et al. (2017) W. Liu, Y. Jin, S. Chen, H. A. Makse, and S. Q. Li, “Equation of state for random sphere packings with arbitrary adhesion and friction,” Soft Matter 13, 421–427 (2017).
- Marshall (2011) J. S. Marshall, “Viscous damping force during head-on collision of two spherical particles,” Physics of Fluids 23, 013305 (2011).
- Yang and Hunt (2006) F. L. Yang and M. L. Hunt, “Dynamics of particle-particle collisions in a viscous liquid,” Physics of Fluids 18, 121506 (2006).
- Fayed and Ragab (2013) H. E. Fayed and S. A. Ragab, “Direct numerical simulation of particles-bubbles collisions kernel in homogeneous isotropic turbulence,” The Journal of Computational Multiphase Flows 5, 167–188 (2013).
- Jin and Marshall (2017) X. Jin and J. S. Marshall, “The role of fluid turbulence on contact electrification of suspended particles,” Journal of Electrostatics 87, 217–227 (2017).
- Pruppacher and Klett (1997) Hans R Pruppacher and James D Klett, Microphysics of Clouds and Precipitation (Kluwer, 1997).
- Onishi et al. (2009) Ryo Onishi, Keiko Takahashi, and Satoru Komori, “Influence of gravity on collisions of monodispersed droplets in homogeneous isotropic turbulence,” Physics of Fluids 21, 125108 (2009).
- Ireland et al. (2016a) Peter J Ireland, Andrew D Bragg, and Lance R Collins, “The effect of Reynolds number on inertial particle dynamics in isotropic turbulence. Part 2. simulations with gravitational effects,” Journal of Fluid Mechanics 796, 659–711 (2016a).
- Krijt et al. (2013) S. Krijt, C. Güttler, D. Heißelmann, C. Dominik, and A. G. G. M. Tielens, “Energy dissipation in head-on collisions of spheres,” Journal of Physics D: Applied Physics 46, 435303 (2013).
- Chen et al. (2018) S. Chen, M. K. Yau, and P. Bartello, “Turbulence effects of collision efficiency and broadening of droplet size distribution in cumulus clouds,” Journal of the Atmospheric Sciences 75, 203–217 (2018).
- Dizaji and Marshall (2016) F. F. Dizaji and J. S. Marshall, “An accelerated stochastic vortex structure method for particle collision and agglomeration in homogeneous turbulence,” Physics of Fluids 28, 113301 (2016).
- Jiang and Logan (1991) Q. Jiang and B. E. Logan, “Fractal dimensions of aggregates determined from steady-state size distributions,” Environmental Science & Technology 25, 2031–2038 (1991).
- Flesch et al. (1999) J. C. Flesch, P. T. Spicer, and S. E. Pratsinis, “Laminar and turbulent shear-induced flocculation of fractal aggregates,” AIChE journal 45, 1114–1124 (1999).
- Waldner et al. (2005) M. H. Waldner, J. Sefcik, M. Soos, and M. Morbidelli, “Initial growth kinetics and structure of colloidal aggregates in a turbulent coagulator,” Powder Technology 156, 226–234 (2005).
- Selomulya et al. (2001) Cordelia Selomulya, Rose Amal, Graeme Bushell, and T David Waite, “Evidence of shear rate dependence on restructuring and breakup of latex aggregates,” Journal of Colloid and Interface Science 236, 67–77 (2001).
- Liu et al. (2018) D. Liu, Z. Wang, X. Chen, and M. Liu, “Simulation of agglomerate breakage and restructuring in shear flows: Coupled effects of shear gradient, surface energy and initial structure,” Powder Technology (2018).
- Friedlander and Wang (1966) S. K. Friedlander and C. S. Wang, “The self-preserving particle size distribution for coagulation by brownian motion,” Journal of Colloid and interface Science 22, 126–132 (1966).
- Vemury and Pratsinis (1995) S. Vemury and S. E. Pratsinis, “Self-preserving size distributions of agglomerates,” Journal of Aerosol Science 26, 175–185 (1995).
- Eggersdorfer and Pratsinis (2014) Maximilian L Eggersdorfer and Sotiris E Pratsinis, “Agglomerates and aggregates of nanoparticles made in the gas phase,” Advanced Powder Technology 25, 71–90 (2014).
- Jullien and Meakin (1989) R. Jullien and P. Meakin, “Simple models for the restructuring of three-dimensional ballistic aggregates,” Journal of Colloid and Interface Science 127, 265–272 (1989).
- Elimelech et al. (1998) M. Elimelech, X. Jia, J. Gregory, and R. Williams, Particle Deposition and Aggregation: Measurement, Modelling and Simulation (Elsevier, 1998).
- Pan and Padoan (2013) Liubin Pan and Paolo Padoan, “Turbulence-induced relative velocity of dust particles. i. identical particles,” The Astrophysical Journal 776, 12 (2013).
- Pan and Padoan (2010) Liubin Pan and Paolo Padoan, “Relative velocity of inertial particles in turbulent flows,” Journal of Fluid Mechanics 661, 73–107 (2010).
- Ayala et al. (2008) Orlando Ayala, Bogdan Rosa, and Lian-Ping Wang, “Effects of turbulence on the geometric collision rate of sedimenting droplets. Part 2. theory and parameterization,” New Journal of Physics 10, 075016 (2008).
- Rani et al. (2014) S. L. Rani, R. Dhariwal, and D. L. Koch, “A stochastic model for the relative motion of high stokes number particles in isotropic turbulence,” Journal of Fluid Mechanics 756, 870–902 (2014).
- Dizaji et al. (in press, 2019) F. Dizaji, J. S. Marshall, and J. R. Grant, “Collision and breakup of fractal particle agglomerates in a shear flow,” Journal of Fluid Mechanics (in press, 2019).
- Spicer and Pratsinis (1996) P. T. Spicer and S. E. Pratsinis, “Coagulation and fragmentation: Universal steady-state particle-size distribution,” AIChE journal 42, 1612–1620 (1996).
- Pandya and Spielman (1983) J. D. Pandya and L. A. Spielman, “Floc breakage in agitated suspensions: effect of agitation rate,” Chemical Engineering Science 38 (1983).
- Ireland et al. (2016b) P. J. Ireland, A. D. Bragg, and L. R. Collins, “The effect of Reynolds number on inertial particle dynamics in isotropic turbulence. Part 1. simulations without gravitational effects,” Journal of Fluid Mechanics 796, 617–658 (2016b).
- Liu and Hrenya (2018) Peiyuan Liu and Christine M Hrenya, “Cluster-induced deagglomeration in dilute gravity-driven gas-solid flows of cohesive grains,” Physical Review Letters 121, 238001 (2018).