SNSN-323-63
Measurement of differential cross-sections with ATLAS at
Rui Zhang, on behalf of the ATLAS Collaboration111Copyright [2018] CERN for the benefit of the [ATLAS Collaboration]. CC-BY-4.0 license.
Physikalisches Institut, University of Bonn, Bonn, Germany
The cross-section to produce a boson in association with a top quark is measured differentially with respect to several particle-level final-state observable quantities. The measurements are performed using fb-1 of collision data at collected in 2015 and 2016, by the ATLAS detector at the LHC. Cross-sections are measured in a fiducial phase-space defined by the presence of two charged leptons and exactly one jet identified as containing hadrons. Measurements are normalised to the fiducial cross-section, causing several of the main uncertainties to cancel. The results are found to be in good agreement with predictions from several Monte Carlo generators.
PRESENTED AT
International Workshop on Top Quark Physics
Braga, Portugal, September 17–22, 2017
1 Introduction
Single-top-quark production via electroweak interactions involving a vertex at leading order is an excellent probe of the couplings. Among all the possible mechanisms, the top-quark production in association with a boson () is the second largest process at the LHC. This cross-section has been measured by the ATLAS [1] and CMS [2] collaborations using collision data. These proceedings describe differential cross-section measurements by the ATLAS collaboration in the dilepton final state, which explore different kinematic regimes in a more detailed way, and thus will be able to improve Monte Carlo (MC) modelling.
2 Analysis strategy
The data correspond to an integrated luminosity of at collected by ATLAS [3] in 2015 and 2016. Events are required to have exactly two oppositely charged leptons (henceforth “lepton” refers to an electron or muon) with and , respectively, at least one of which has to be triggered on. Additionally, events are required to have exactly one jet with which is -tagged (-jet). Finally a certain amount of missing transverse momentum, , is required depending on the invariant mass of two leptons, to further reduce background from events.
A boosted decision tree (BDT) technique [4] is used to combine several observables with increased separation power into a single discriminant. The variables considered are derived from the kinematic properties of subsets of the objects involved in the final states. The BDT discriminant distributions from MC predictions and data are compared and shown in Figure 1.
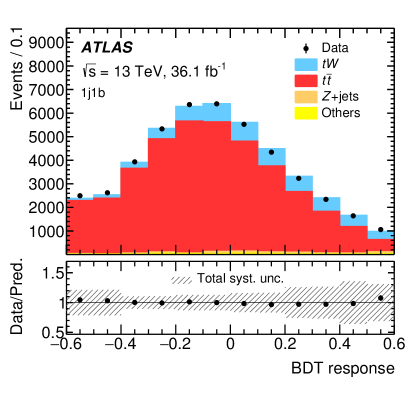
To select a signal-enriched portion of events in the signal region, the BDT response is required to be larger than . The value of the requirement is optimised to reduce the total uncertainty of the measurement over all bins, considering both statistical and systematic uncertainties.
The remained events are corrected for detector acceptance and resolution effects and the efficiency to pass the event selection by using the iterative Bayesian unfolding technique [6] implemented in the RooUnfold software package [7]. The unfolding procedure includes bin-by-bin correction for out-of-fiducial () events which are reconstructed but fall outside the fiducial acceptance at particle level, followed by the iterative matrix unfolding procedure , as well as another bin-by-bin correction () to the efficiency to reconstruct a fiducial event:
where represents the unfolded event yields, () indicates the bin at particle (reconstruction) level, is the number of events in data and is the sum of all background events.
Unfolded event yields are converted to cross-section values as a function of an observable using the expression:
where is the integrated luminosity of the data sample and is the width of bin of the particle-level distribution. Differential cross-sections are divided by the fiducial cross-section to create a normalised distribution. The fiducial cross-section is simply the sum of the cross-sections in each bin multiplied by the corresponding bin widths:
Many sources of experimental systematic uncertainties are taken into account. These include the luminosity measurement, lepton efficiency scale factors used to correct simulation to data, lepton/jet energy scale and resolution, related terms and the efficiency of -jet. The dominant systematic uncertainties in this category are related to the measurement of the jet energy scale and resolution. Apart from the experimental systematics, uncertainties that arise due to theoretical modelling of the signal and background are also evaluated. The dominant uncertainties for this analysis are the next-to-leading order (NLO) matrix element generator and the parton shower and hadronisation generator.
3 Results
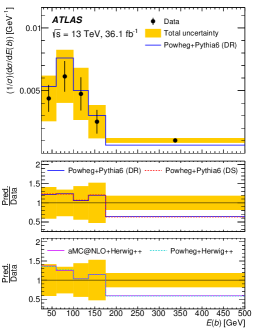
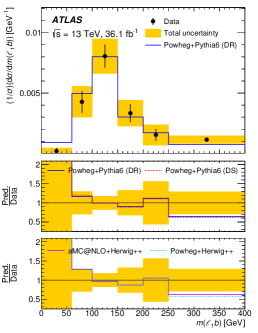
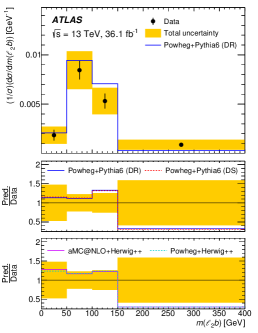
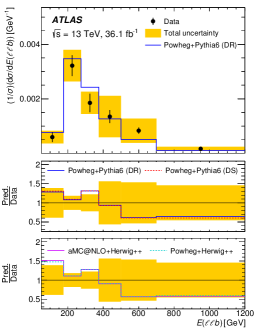
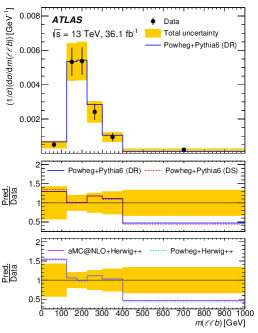
Differential cross-sections are measured and compared to a variety of theory predictions (see Figure 2) for the following variables:
-
•
the energy of the -jet, ;
-
•
the mass of the leading lepton and -jet, ;
-
•
the mass of the sub-leading lepton and the -jet, ;
-
•
the energy of the system of the two leptons and -jet, ;
-
•
the transverse mass of the leptons, -jet and neutrinos, ; and
-
•
the mass of the two leptons and the -jet, .
They are either related to the event, top quark or boson kinematics.
 |
 |
 |
 |
 |
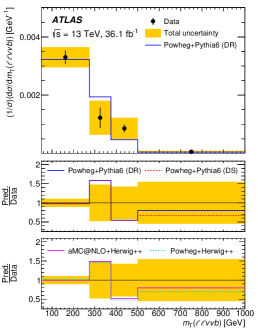 |
The uncertainty on the measurements is at the level. While this does not allow firm conclusions to be drawn, in general, most of the MC models show fair agreement with the measured cross-sections. Notably, for each distribution there is a substantial negative slope in the ratio of predicted to observed cross-sections, indicating there are more events with high-momentum final-state objects than several of the MC models predict. In most cases, differences between the MC predictions are smaller than the uncertainty on the data, but there are some signs that Powheg-Box+Herwig++ deviates more from the data and from the other predictions in certain bins of the , , and distributions. The predictions of DS and DR samples***Diagram removal (DR) and diagram subtraction (DS) are two commonly used approaches to deal with quantum interference between and processes. likewise give very similar results for all observables as expected from the fiducial selection. The predictions of Powheg-Box+Pythia 6 with varied initial- and final-state radiation tuning were also examined but not found to give significantly different distributions in the fiducial phase space of this analysis.
References
- [1] ATLAS Collaboration, JHEP 01, 063 (2018), arXiv:1612.07231 [hep-ex].
- [2] CMS Collaboration, CMS-PAS-TOP-17-018, (2017), arXiv:1710.03659 [hep-ex].
- [3] ATLAS Collaboration, 2008 JINST 3, S08003 (2008).
- [4] J. H. Friedman, Comput. Stat. & Data Analysis 38, 367 (2002).
- [5] ATLAS Collaboration, Eur. Phys. J. C 78, 186 (2018), arXiv:1712.01602 [hep-ex].
- [6] G. D’Agostini, Nucl. Instrum. Meth. A, 362, 487 (1995).
- [7] T. Adye, arXiv: 1105.1160 [physics.data-an], (2011).