EUROPEAN ORGANIZATION FOR NUCLEAR RESEARCH (CERN)
![]() CERN-EP-2018-193
LHCb-PAPER-2018-021
January 21, 2019
CERN-EP-2018-193
LHCb-PAPER-2018-021
January 21, 2019
Prompt production in collisions at
LHCb collaboration†††Authors are listed at the end of this paper.
The prompt production of baryons is studied in proton-lead collisions collected with the LHCb detector at the LHC. The data sample corresponds to an integrated luminosity of recorded at a nucleon-nucleon centre-of-mass energy of . Measurements of the differential cross-section and the forward-backward production ratio are reported for baryons with transverse momenta in the range and rapidities in the ranges and in the nucleon-nucleon centre-of-mass system. The ratio of cross-sections of baryons and mesons is also reported. The results are compared with next-to-leading order calculations that use nuclear parton distribution functions.
Published in JHEP 02 (2019) 102
© 2024 CERN for the benefit of the LHCb collaboration. CC-BY-4.0.
1 Introduction
The ultimate goal of relativistic heavy-ion collision experiments at the SPS, RHIC and the LHC accelerators is to learn about the properties of a new state of matter, the quark-gluon plasma (QGP). The QGP consists of deconfined quarks and gluons and it is generally accepted that such a hot and dense state of matter can be produced in high-energy heavy-ion collisions [Akiba:2015jwa]. Heavy quarks are particularly important probes of the properties of the QGP. According to theoretical models, heavy quarks are created in pairs in the early stage of the space-time evolution of heavy-ion collisions, and undergo rescattering or energy loss in the QGP. Measurements of heavy-flavour production can shed light on the transport properties of the medium and the heavy-quark energy-loss mechanisms. Multiple experimental measurements of -meson production in heavy-ion collisions at RHIC [Adamczyk:2014uip] and the LHC [Abelev:2014ipa] already show clear signs of strong interactions between charm quarks and the medium in these collisions. However, heavy quarks can be affected by both hot and cold nuclear matter, since cold nuclear matter effects are also present in nucleus-nucleus interactions. Possible cold nuclear matter effects that affect heavy-flavour production in heavy-ion collisions include: (a) the modification of the parton distribution function in bound nucleons in the initial state, namely the nuclear PDF (nPDF) effects [Kharzeev:2005zr, Fujii:2006ab]; (b) initial-state radiation or energy loss due to soft collisions [Gavin:1991qk, Vogt:1999dw, Arleo:2012rs]; and (c) final-state hadronic rescatterings and absorption [Arleo:2006qk]. To further study heavy-quark energy loss or collective phenomena in QGP, the cold nuclear matter effects must be quantitatively disentangled from hot nuclear matter effects.
LHCb measurements can play an important role in understanding cold nuclear matter effects, thanks to LHCb detector’s outstanding capability in heavy-flavour measurements. The precise tracking system allows the separation of “prompt” charm hadrons, which are directly produced in collisions, from “nonprompt” charm hadrons coming from decays of hadrons. The excellent particle identification capabilities of the LHCb detector allow measurements of various species of charmed hadrons. Finally, prompt open-charm hadrons can be measured down to low transverse momentum () at forward rapidity () owning to the LHCb’s geometric coverage. These measurements provide sensitive probes of the nPDF in the low parton fractional longitudinal momentum () region down to –, where the nPDF is largely unconstrained by experimental data.
Prompt meson production has been measured by the LHCb collaboration in collisions at with data recorded in 2013 [LHCb-PAPER-2017-015]. In the present study, the production of the charmed baryon is measured with the same 2013 data sample.111 Charge conjugation states and processes are implied throughout the paper. The forward-backward asymmetry is measured using prompt candidates, in order to study cold nuclear matter effects. In addition, the baryon-to-meson cross-section ratios are measured in order to probe the charm-hadron formation mechanism [Oh:2009zj, Lee:2007wr] using production cross-sections measured by the LHCb collaboration in Ref. [LHCb-PAPER-2017-015]. Measurements of the baryon-to-meson cross-section ratios for light and strange hadrons have shown significant baryon enhancement at intermediate in the most central heavy-ion collisions [Lamont:2006rc, Abelev:2013xaa]. This enhancement can be explained by coalescence models [Oh:2009zj, Hwa:2002pz, Greco:2003xt, Fries:2003vb, Molnar:2003ff], which assume that all hadrons are formed through recombination of partons during hadronisation. Recently, the STAR experiment has measured the production of baryons in AuAu collisions at [Xie:2017jcq]. These measurements show a significant enhancement in the to yield ratio for from 3 to . A similar enhancement in PbPb collisions is also observed by the ALICE experiment [Acharya:2018ckj]. The measurement of production in collisions provides complementary information to help understand the implications of the STAR and ALICE observations. In addition, the ALICE collaboration has recently measured production in collisions at for and , and in collisions at for and [Acharya:2017kfy]. The LHCb collaboration has also published results on the production cross-section of prompt bayrons in collisions at [LHCb-PAPER-2012-041].
2 Detector and data
The LHCb detector [Alves:2008zz, LHCb-DP-2014-002] is a single-arm forward spectrometer covering the pseudorapidity range , designed for the study of particles containing or quarks. The detector includes a high-precision tracking system consisting of a silicon-strip vertex detector surrounding the interaction region (VELO), a large-area silicon-strip detector located upstream of a dipole magnet with a bending power of about , and three stations of silicon-strip detectors and straw drift tubes placed downstream of the magnet. The tracking system provides a measurement of the momentum of charged particles with a relative uncertainty that varies from 0.5% at low momentum to 1.0% at 200. The minimum distance of a track to a primary vertex (PV), the impact parameter, is measured with a resolution of in . Different types of charged hadrons are distinguished using information from two ring-imaging Cherenkov detectors. The average efficiency for kaon identification for momenta between 2 and 100 is about , with a corresponding average pion misidentification rate around . Photons, electrons and hadrons are identified by a calorimeter system consisting of scintillating-pad and preshower detectors, an electromagnetic calorimeter and a hadronic calorimeter. Muons are identified by a system composed of alternating layers of iron and multiwire proportional chambers. The online event selection is performed by a trigger, which consists of a hardware stage, based on information from the calorimeter and muon systems, followed by a software stage, which applies a full event reconstruction.
This analysis uses the data sample of collisions at = taken with the LHCb detector in 2013, with a proton beam energy of and lead beam energy of per nucleon in the laboratory frame. Since the LHCb detector covers only one direction of the full rapidity acceptance, two distinctive beam configurations were used. In the ‘forward’ (‘backward’) configuration, the proton (lead) beam travels from the VELO detector to the muon chambers. The rapidity in the laboratory rest frame is shifted to in the proton-nucleon rest frame. Here, is the rapidity of the baryon defined in the centre-of-mass system of the colliding nucleons, and it is defined with respect to a polar axis in the direction of the proton beam. During data taking, the hardware trigger operated in a ‘pass-through’ mode that accepted all bunch crossings, regardless of the inputs from the calorimeter and muon systems. The software trigger accepted all events with a minimum activity in the VELO. The integrated luminosity of the sample was determined in Ref. [LHCb-PAPER-2013-052], and is () for the forward (backward) collisions, respectively. Due to the low beam intensity, multiple interactions in the bunch crossings are very rare, and only a single PV is reconstructed for each event.
Simulated collisions at at both configurations with full event reconstruction are used in the analysis to evaluate the detector efficiency. In the simulation, baryons are generated with Pythia [Sjostrand:2007gs] and embedded into minimum-bias collisions from the EPOS event generator [Porteboeuf:2010um], which is tuned with LHC data [PhysRevC.92.034906]. Decays of hadronic particles are described by EvtGen [Lange:2001uf], in which final-state radiation is generated using Photos [Golonka:2005pn]. The interaction of the generated particles with the detector, and its response, are implemented using the Geant4 toolkit [Allison:2006ve, Agostinelli:2002hh] as described in Ref. [LHCb-PROC-2011-006].
3 Cross-section determination
The differential production cross-section of baryons is measured in bins of the transverse momentum and rapidity in the kinematic range with for the forward sample and for the backward sample. The double-differential cross-section is obtained using
| (1) |
where is the prompt signal yield reconstructed in the decay channel in each bin, is the integrated luminosity, is the total efficiency determined in each bin, is the branching fraction of the decay [PDG2016]. The signal yields and efficiencies are determined independently for each and bin of width and . The total cross-section is calculated by integrating the double differential cross-section over a given kinematic range.
The forward-backward ratio measures the production asymmetry in the forward and backward rapidity regions. It is defined as
| (2) |
where and correspond to the cross-sections of the forward and backward rapidity regions symmetric around , respectively. The ratio is measured in the common rapidity region of the forward and backward data .
The baryon-to-meson cross-section ratio is calculated as the ratio of and production cross-sections
| (3) |
where and are cross-sections of and hadrons in collisions at , respectively. The production cross-section in the kinematic region with for the forward sample and for the backward sample has been measured by the LHCb collaboration and is documented in Ref. [LHCb-PAPER-2017-015]. As the meson sample is significantly larger and has a better signal purity than that of baryons, the production cross-section can be measured in a wider rapidity range in the backward sample.
3.1 Event selection
Proton, kaon and pion candidates are selected with particle identification (PID) [LHCb-PROC-2011-008] criteria, and are required to be inconsistent with originating from any PV. Random combinations of charged particles form a larger background in the backward sample than in the forward sample, due to a larger number of tracks per event. Each possible combination of the selected decay products undergoes further selection to reject false candidates from such random combinations. The requirements applied to select a reconstructed candidate include: (a) its reconstructed invariant mass is in the range , which corresponds to around 25 times the mass resolution around the measured mass , which is larger than the known mass [PDG2016]; (b) the angle between the reconstructed momentum and the vector pointing from the PV to the decay vertex is close to zero. (c) the proper decay time of the candidate is in the range ; (d) the , and candidates form a good-quality vertex; and (e) the decay vertex is significantly separated from the PV. After the selection, about 1% of the events are found to contain multiple candidates. All candidates are kept. Few baryons are observed with due to low efficiencies, while the combinatorial background is large. Therefore the measurement is restricted to .
3.2 Prompt yield and efficiencies
The signal includes both prompt and nonprompt components. The nonprompt candidates originate from -hadron decays, denoted hereafter. The number of prompt candidates, , in Eq. 1 is estimated following the strategy developed in previous LHCb charm analyses in collisions at = 7 [LHCb-PAPER-2012-041] and in collisions at [LHCb-PAPER-2017-015]. The invariant-mass distribution, , is first fitted to determine the yield of inclusive candidates in the sample. The prompt fraction is then determined from a fit to the distribution of the of the impact parameter of the candidates (), which is defined as the difference in the vertex fit of a given PV when it is reconstructed with and without the candidate.
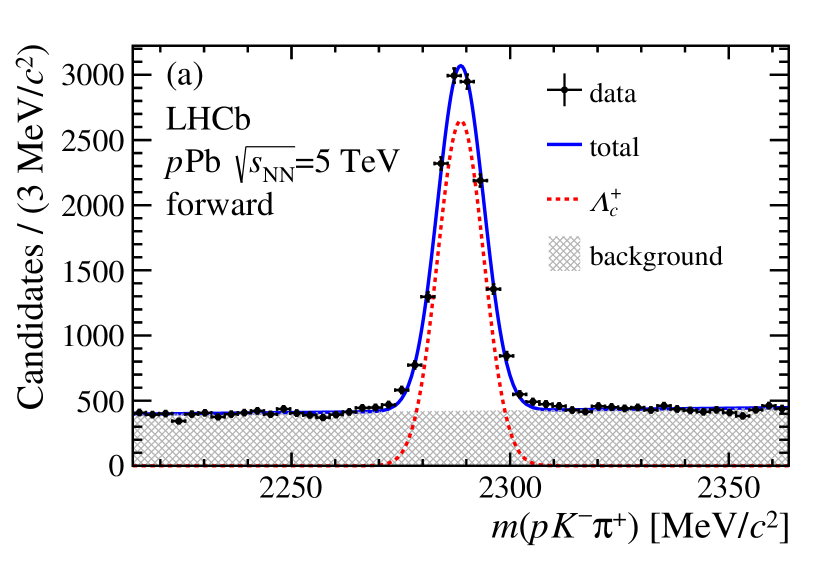
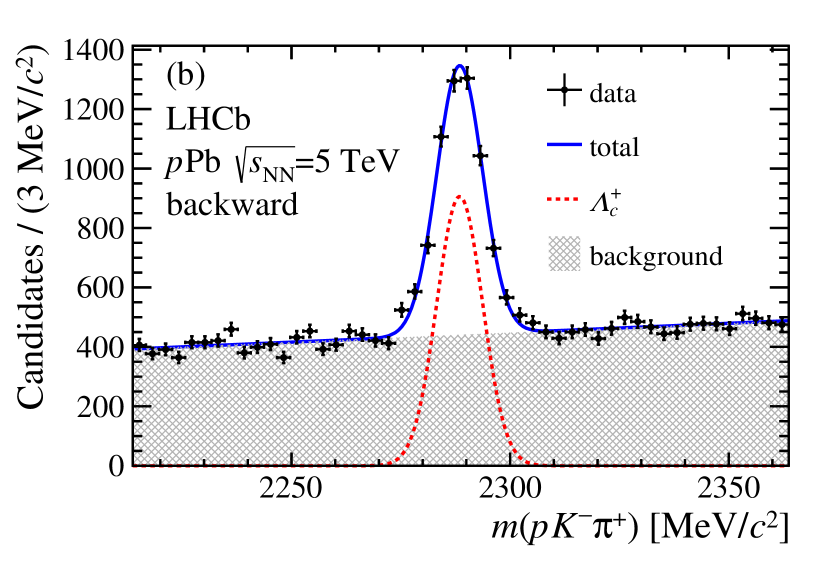
Figure 1 shows the fit result of an extended unbinned maximum-likelihood fit to the distribution of the full dataset, which contains () baryons for the forward (backward) sample. A Gaussian function is used to describe the shape of the signal, while the combinatorial background is modelled by a linear function. Although Fig. 1 corresponds to the full dataset, independent fits are performed in each bin. The width and peak position of the Gaussian function depends on the kinematics of the baryons, due to the imperfect detector alignment, and both are therefore left as free parameters in the fits. The peak position varies between 2284 and 2294, and the width is found to be between 4 and 10.
Unlike prompt baryons, which originate from the PV, baryons are created away from the PV due to the relatively long lifetime of hadrons. Decay products of candidates tend to have larger impact parameter with respect to the PV and a larger , compared to the prompt candidates. Consequently, the fraction of prompt baryons is determined from a fit to the distribution of using the different distributions describing the prompt , the , and the combinatorial background contributions.
The fit is performed to the distribution of candidates within the mass interval . The distribution of the combinatorial background is constructed from the sideband regions in data and . Following LHCb charm cross-section measurements in collisions at = 7 [LHCb-PAPER-2012-041], the prompt and components are modelled independently with a Bukin function [2007arXiv0711.4449B], which is defined as
| (4) |
where
| (5) |
The parameters and are the position and width of the peak, and are left and right tail exponential coefficients and parameterises the asymmetry of the peak. The distribution in the simulation is compared to that in the data, where the signal distribution is obtained using the sPlot technique [Pivk:2004ty]. The simulated sample gives a good description of the shape of the prompt distribution, while slightly underestimating the prompt peak position . For the component, both and depend on and . The value in the data varies between 1.3 and 2.0, which is 0.3–0.5 larger than that in the simulation. The parameter in the prompt Bukin function and the parameters and in the Bukin function are determined from a fit to the data. The sum of the prompt and distributions of is obtained with the sPlot technique using the invariant mass as the discriminating variable, and is fitted with two Bukin functions. The correlation between the invariant mass and is found to be negligible. For the prompt Bukin function, the parameter is a floating variable, while , , and are fixed to the values determined from a fit to the simulation sample. For the Bukin function, the parameters and vary freely, while , and are estimated from the simulation and can vary within their uncertainties.
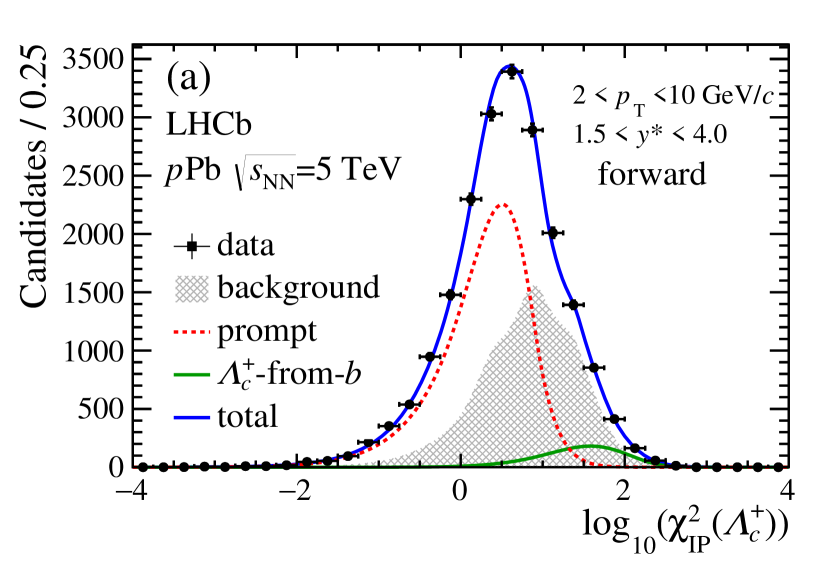
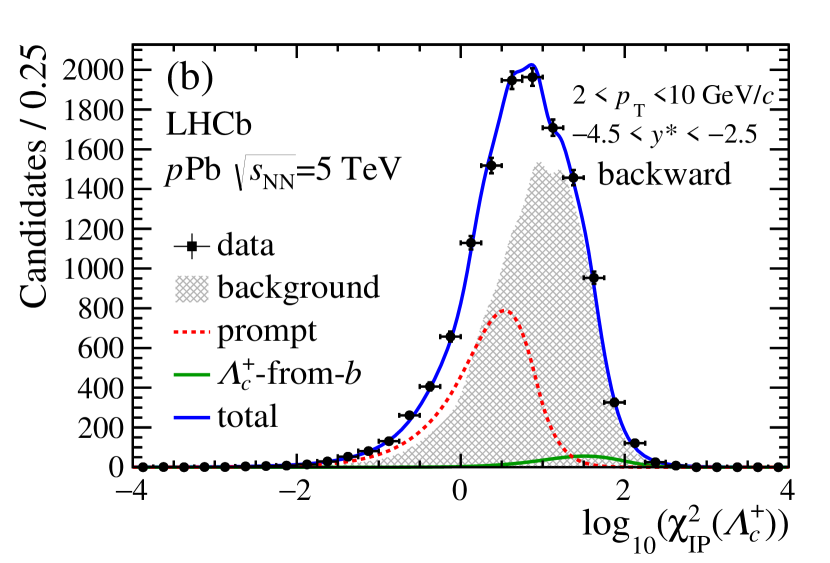
Finally, the distribution is fitted with three components, two Bukin functions for the prompt and components respectively, where the parameters are determined as described above, and a background component derived from the sideband regions. The prompt fraction is determined independently in two-dimensional () bins and tends to decrease with increasing and , with an average value of for both rapidity regions. The distributions of candidates with and in the full rapidity region, together with the fits, are displayed in Fig. 2 (a) and (b), for the forward and backward samples, respectively. The statistical uncertainty of the prompt fraction is considered to be partially correlated with the statistical uncertainty of the inclusive yield. The correlation factor in each () bin is derived from a simultaneous two-dimensional fit to the - distribution.
The total efficiency, , in Eq. 1 is decomposed into three components: the geometrical acceptance, the reconstruction and selection efficiency, and the PID efficiency. The geometrical acceptance efficiency is the fraction of baryons within the LHCb geometrical acceptance, and is determined from simulation. For most bins this efficiency is above 90%. The reconstruction and selection efficiencies are calculated with simulated events at . The simulated samples are validated by comparing the distributions of kinematic variables with those obtained from the data using the sPlot technique. The reconstruction efficiency is affected by the track multiplicity of the event, which is not well reproduced in the simulation. Following the method developed in Ref. [LHCb-PAPER-2017-015], the efficiency is evaluated as a function of track multiplicity and a correction factor is derived. The simulated samples do not model well decays through intermediate resonances (1520) and , which can result in local distortions of the and invariant-mass distributions. A method that uses as a two-dimensional weight to calculate the efficiencies is implemented [LHCb-PAPER-2017-026] to take into account the effect of resonant structures in the decay, where the signal kinematics in the data are gained with the sPlot technique. The final reconstruction and selection efficiency in general increases with . The efficiency is below for the lowest values and reaches 4–5% at .
The PID efficiencies of the decay products are assessed separately with a data-driven method [LHCb-DP-2014-002] using high-purity samples of mesons from decays for kaons and pions, and baryons for protons. The samples are taken from the same data set as used in the present analysis. The single-track PID efficiencies are mostly above 80% (90%) for protons (pions and kaons) for track momenta in the range of and pseudorapidities in the range of , although the efficiencies at the edge of the acceptance are generally lower. The single-track PID efficiencies are convolved with decay kinematic distributions obtained from simulation to produce the total PID efficiency for baryons in each () bin. The PID efficiency for baryons are 45–89% (46–74%) for the forward (backward) sample. The total efficiency is estimated to be 0.04–4.53% (0.07–2.87%) for the forward (backward) configuration.
3.3 Systematic uncertainties
The systematic uncertainties are evaluated separately for the forward and backward samples, unless otherwise specified. Sources of systematic uncertainty arising from the inclusive invariant-mass fit, the determination of the prompt fraction from the fit and the efficiency evaluations, are studied independently for each () bin.
The systematic uncertainty of the inclusive invariant-mass fit is studied by replacing the fitting functions with a double Gaussian function with a common mean for the signal and an exponential function for the background. The relative uncertainty on the inclusive signals are 0.2–13.2% for the forward sample and 0.1–16.1% for the backward sample. The larger uncertainties are found in a few bins at the edge of acceptance where the yields are low. The uncertainty on the prompt fraction is evaluated by varying the width of the mass range used for the distribution to a wider () and a narrower () mass range. The uncertainty is estimated as the difference in the prompt fraction derived from the normal mass range and the alternative mass ranges. The uncertainties on the prompt fractions are 0.6–4.2% (0.7–19.0%) for the forward (backward) sample. The bins with the lowest and largest have large uncertainties due to the high level of combinatorial background.
The relative uncertainty for the measured luminosity is and for the forward and backward samples [LHCB-PAPER-2014-047], respectively. The branching fraction [PDG2016] yields a relative uncertainty of .
The uncertainty on the efficiency correction originates from several sources: (1) the uncertainty in correcting the track multiplicity distributions in the simulation (5.6% in the forward region and 5.8% in the backward region); (2) the uncertainty arising from the simulation description of decay resonant structures (forward: 3.0%, backward: 4.0%); (3) the uncertainty in the PID efficiency (forward: 0.5–4.3%, backward: 0.5–10.4%); and (4) the limited size of the simulated sample (forward: 4.2–27.0%, backward: 4.3–26.0%).
All the systematic uncertainties considered for the differential cross-sections are listed in Table 1. For the total cross-section, the uncertainties due to the simulated sample size are considered to be fully uncorrelated for each () bin and are summed in quadrature. The uncertainties on the luminosity and the branching fraction are fully correlated among () bins. The other systematic uncertainties are found to be almost fully correlated across the bins and are summed linearly.
For the ratio, the common uncertainty on cancels out. The systematic uncertainty on the raw yields is considered uncorrelated because of different levels of background in the forward and backward data samples. The systematic uncertainties on the reconstruction and selection efficiency are assumed to be fully correlated except for the uncertainty due to the decay resonant structures, which is uncorrelated. The uncertainty on the PID efficiency is assumed to be 90% correlated. The luminosity uncertainties are considered uncorrelated. For the ratio, all systematic uncertainties are uncorrelated except for the luminosity uncertainty which cancels out.
| Source | Relative uncertainty (%) | |
|---|---|---|
| Correlated between bins | Forward | Backward |
| Invariant mass fit | 0.2–13.2 | 0.1–16.1 |
| Prompt fraction | 0.6–4.2 | 0.7–19.0 |
| Luminosity | 2.3 | 2.5 |
| 5.2 | 5.2 | |
| Multiplicity correction | 5.6 | 5.8 |
| decay resonant structures | 3.0 | 4.0 |
| PID efficiency | 0.5–4.3 | 0.5–10.4 |
| Uncorrelated between bins | ||
| Simulation sample size | 4.2–27.0 | 4.3–26.0 |
| Statistical uncertainty | 3.6–42.5 | 6.2–44.3 |
4 Results
4.1 Prompt cross-section
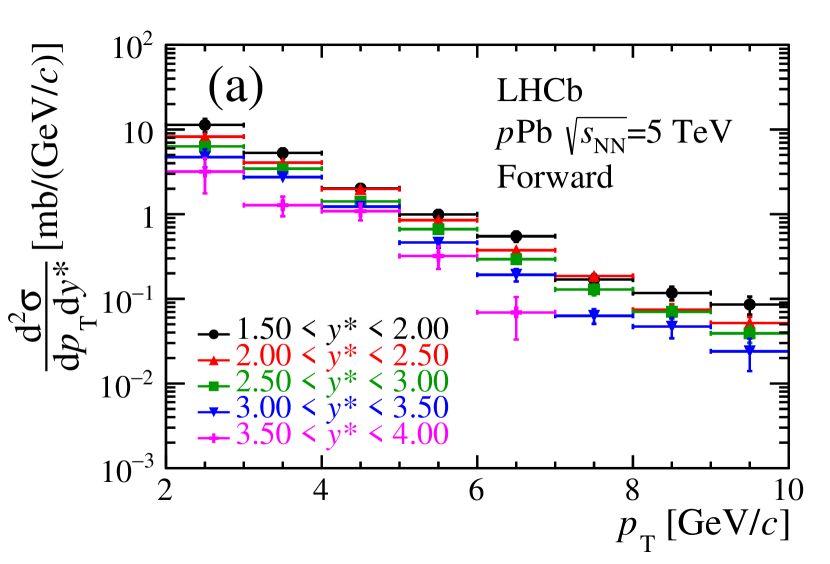
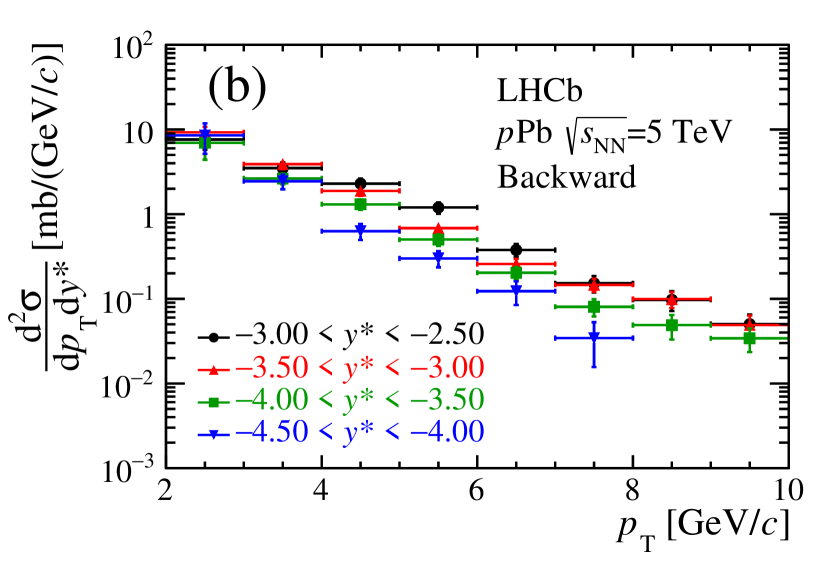
The double-differential cross-section of prompt production in collisions at is measured as a function of the and of the baryon. The results are displayed in Fig. 3, and the corresponding numerical values are shown in Table LABEL:tab:CrossSection2D of Appendix A.
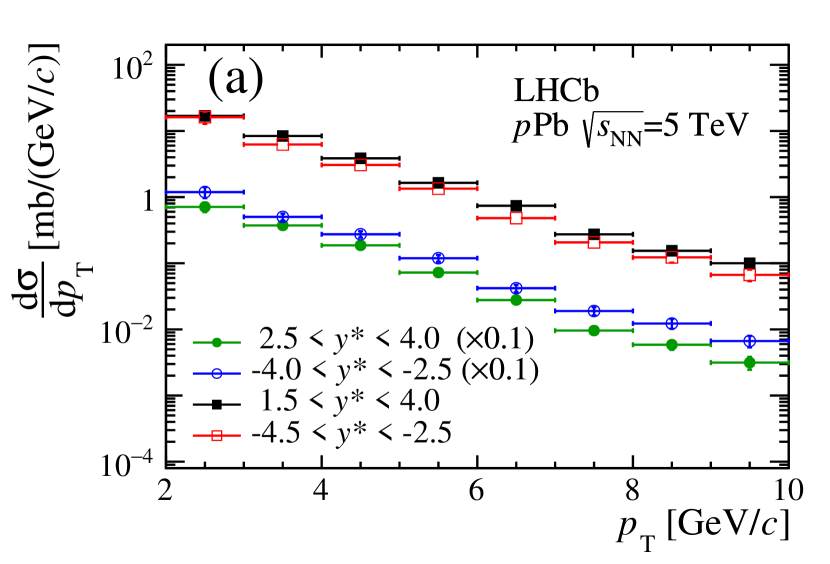
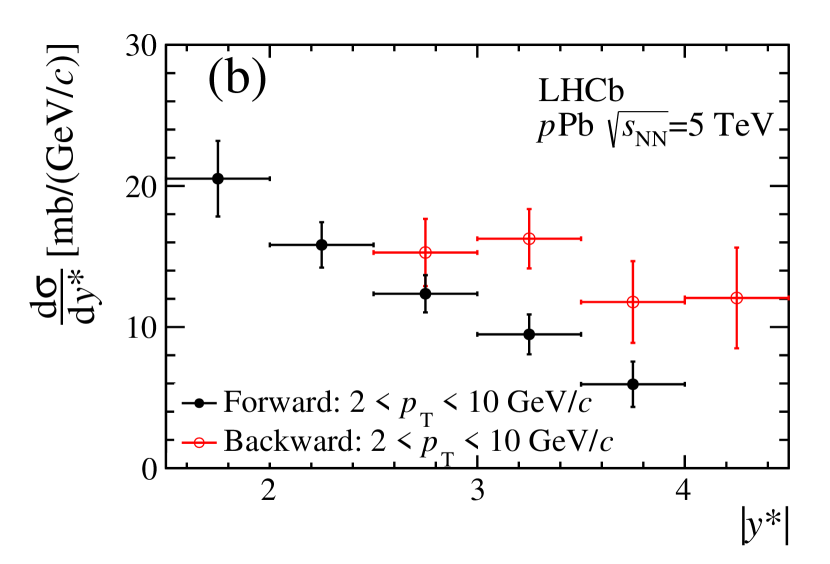
The double-differential cross-section is integrated over between 2 and to obtain the differential cross-section as a function of . Likewise, integrating over in regions (the common region of the forward and backward data), (for the forward data) and (for the backward data) yields the differential cross-section as a function of . The differential cross-sections versus and versus are shown in Fig. 4. The corresponding values are shown in Appendix A.
For the full kinematic range, the total cross-section is determined to be
where the first uncertainties are statistical and the second systematic. The correlated components in the systematic uncertainties are and for the forward and backward data, respectively.
4.2 ratio
The total cross-section in the common rapidity region between the forward and backward samples is also obtained to calculate the prompt ratio,
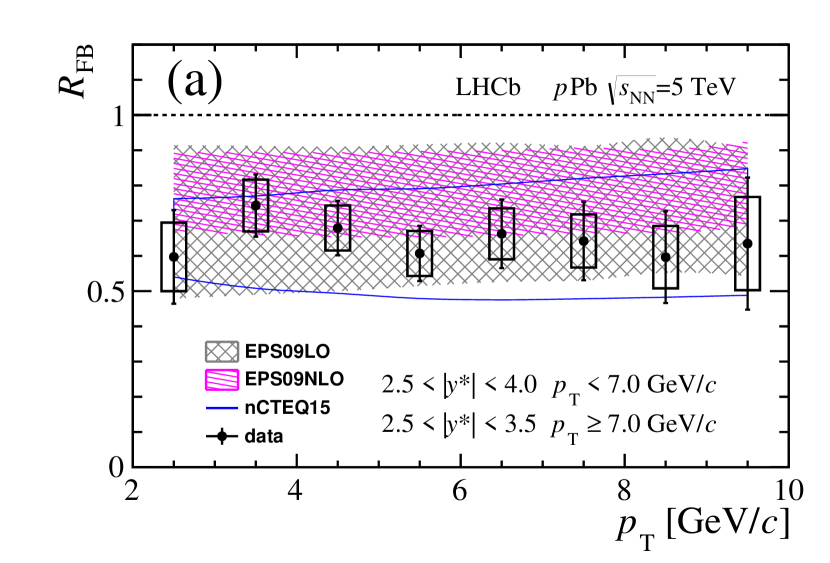
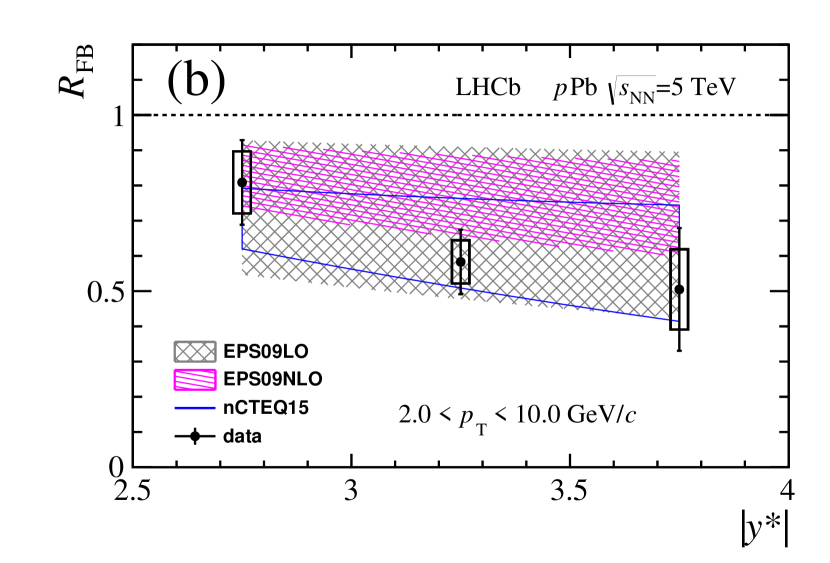
Figure 5(a) shows the prompt ratio as a function of in the region common to both forward and backward samples, . In the rapidity region , the forward data have no measurement for . For beyond , the ratio is therefore calculated with both forward and backward cross-sections in the region . Figure 5(b) shows the ratio as a function of in the region . The measurement is in agreement with calculations using the HELAC-Onia generator [Lansberg:2016deg, Shao:2012iz, Shao:2015vga], which incorporates the parton distribution functions of EPS09LO, EPS09NL0 [EPS09] and nCTEQ15 [Kovarik:2015cma]. The numerical values are given in Appendix LABEL:sec:rfb-table.
4.3 to cross-section ratio,
The ratio of the production cross-sections between prompt baryons and mesons is calculated as a function of the and of the hadrons using the previous measurement of production cross-section [LHCb-PAPER-2017-015]. The results are compared to the HELAC-Onia calculations [Lansberg:2016deg, Shao:2012iz, Shao:2015vga], which are based on a data-driven modelling of parton scattering. The theory prediction is calculated with HELAC-Onia, where the production cross-section is parameterised by fitting the LHCb data [LHCb-PAPER-2012-041]. The nuclear matter effects in collisions are incorporated using the nPDFs EPS09LO/NLO [EPS09], nCTEQ15 nPDFs [Kovarik:2015cma]. The effects of the nPDFs tend to cancel in the ratio , leading to similar ratios between the different nPDFs. The calculations with the three nPDFs show comparable trends and values across and , with nCTEQ15 slightly lower than EPS09, suggesting small nPDF effects in the ratio.
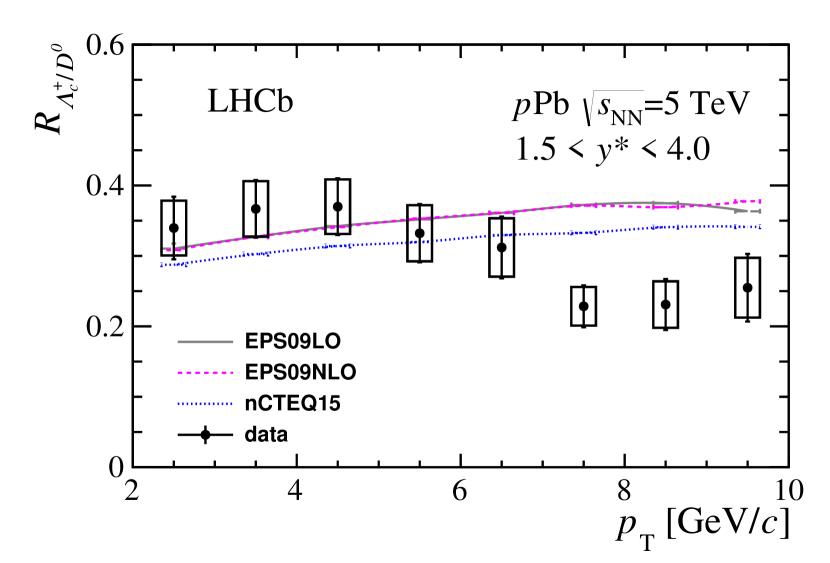
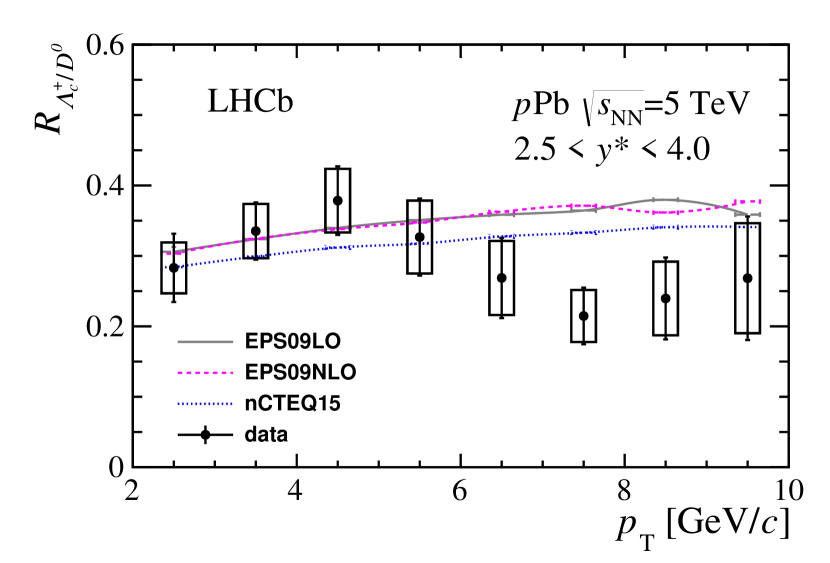
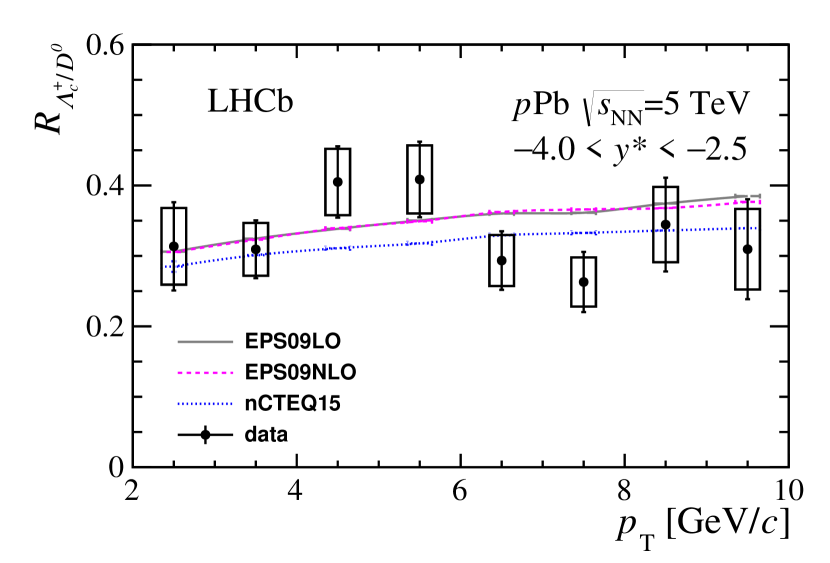
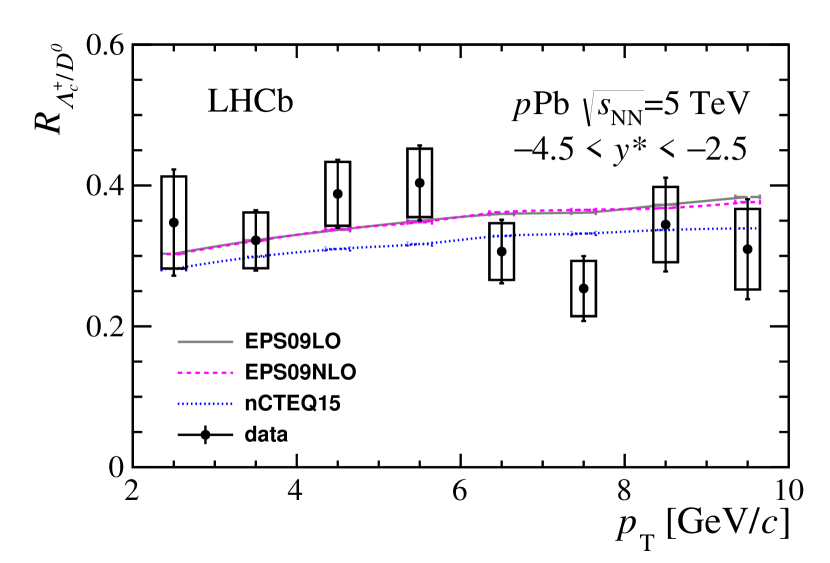
Figure 6 shows the ratio as a function of in four different rapidity ranges. Numerical values can be found in Table LABEL:tab:Lc2D0_PT in Appendix LABEL:sec:rlcdz-table. The ratios are measured to be around . The values are larger at lower () and tend to decrease for greater than . The trend is less clear in the backward region due to larger uncertainties. The theoretical calculations are displayed as coloured curves. They increase slightly with increasing . In the backward region, the data points are consistent with the theoretical calculations. The forward data points are consistent with the calculations at lower (). However, they are below the theoretical predictions for greater than .
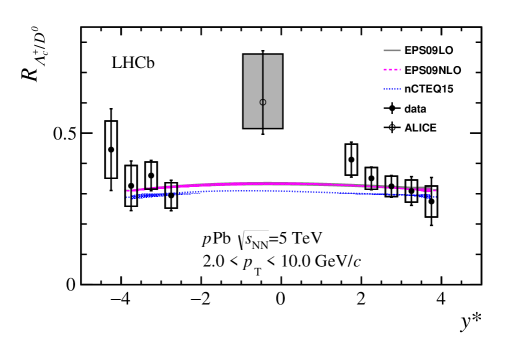
Figure 7 illustrates the ratio for as a function of rapidity. The numerical values are given in Appendix LABEL:sec:rlcdz-table. The theoretical calculations are made for the rapidity range , and show a relatively uniform distribution. Both the forward and backward data are consistent with the theoretical predictions for the full rapidity range.
The ALICE collaboration has recently reported a measurement of the prompt baryons in collisions at [Acharya:2017kfy]. Their ratio in the midrapidity region for and is measured to be , and is shown in Fig. 7. The value is larger than the ratios shown in the solid points in both forward and backward rapidity regions. In the forward region, the ratio tends to increase with decreasing , suggesting a trend that can be compatible with the ALICE measurement. In the backward region, however, no clear trend is observed due to large uncertainties.
5 Conclusion
Prompt production cross-sections are measured with collision data collected by the LHCb detector at . The forward-backward production ratios are presented, and are compared to theoretical predictions. A larger production rate in the backward-rapidity region compared to the forward region is observed. The forward-backward production ratio shows consistency with HELAC-Onia calculations with the three nPDFs EPS09LO, EPS09NLO [EPS09] and nCTEQ15 [Kovarik:2015cma]. In addition, the production cross-section ratio between baryons and mesons, which is sensitive to the hadronisation mechanism of the charm particles, is measured. The result is consistent with theory calculations based on data. The measurements in classes of event multiplicity can be anticipated with the dataset at recorded by the LHCb collaboration in 2016, which is about 20 times larger than the dataset. An improvement in precision is also achievable with the increased sample size and an improved simulation. In addition, a dataset of collisions at corresponding to a luminosity of was collected in 2017. The nuclear modification factor for the baryons can be directly measured using this dataset.
Acknowledgements
We are grateful to H. Shao for providing theoretical calculations of prompt production in collisions in the LHCb acceptance. We express our gratitude to our colleagues in the CERN accelerator departments for the excellent performance of the LHC. We thank the technical and administrative staff at the LHCb institutes. We acknowledge support from CERN and from the national agencies: CAPES, CNPq, FAPERJ and FINEP (Brazil); MOST and NSFC (China); CNRS/IN2P3 (France); BMBF, DFG and MPG (Germany); INFN (Italy); NWO (Netherlands); MNiSW and NCN (Poland); MEN/IFA (Romania); MSHE (Russia); MinECo (Spain); SNSF and SER (Switzerland); NASU (Ukraine); STFC (United Kingdom); NSF (USA). We acknowledge the computing resources that are provided by CERN, IN2P3 (France), KIT and DESY (Germany), INFN (Italy), SURF (Netherlands), PIC (Spain), GridPP (United Kingdom), RRCKI and Yandex LLC (Russia), CSCS (Switzerland), IFIN-HH (Romania), CBPF (Brazil), PL-GRID (Poland) and OSC (USA). We are indebted to the communities behind the multiple open-source software packages on which we depend. Individual groups or members have received support from AvH Foundation (Germany); EPLANET, Marie Skłodowska-Curie Actions and ERC (European Union); ANR, Labex P2IO and OCEVU, and Région Auvergne-Rhône-Alpes (France); Key Research Program of Frontier Sciences of CAS, CAS PIFI, and the Thousand Talents Program (China); RFBR, RSF and Yandex LLC (Russia); GVA, XuntaGal and GENCAT (Spain); the Royal Society and the Leverhulme Trust (United Kingdom); Laboratory Directed Research and Development program of LANL (USA).
Appendices
Appendix A Numerical values of the cross-sections
| Forward (/()) | |||
| 16.886 1.066 1.811 | 7.107 0.812 0.875 | ||
| 8.402 0.250 0.844 | 3.731 0.142 0.401 | ||
| 3.859 0.113 0.368 | 1.864 0.087 0.194 | ||
| 1.644 0.052 0.165 | 0.724 0.036 0.080 | ||
| 0.740 0.030 0.074 | 0.278 0.020 0.031 | ||
| 0.274 0.013 0.027 | 0.096 0.007 0.011 | ||
| 0.154 0.010 0.017 | 0.059 0.006 0.008 | ||
| 0.100 0.008 0.013 | 0.032 0.004 0.006 | ||
| Backward (/()) | |||
| 16.162 1.750 2.890 | 11.902 1.180 1.940 | ||
| 6.248 0.318 0.688 | 5.021 0.271 0.546 | ||
| 3.059 0.132 0.321 | 2.744 0.122 0.288 | ||
| 1.342 0.070 0.143 | 1.192 0.067 0.127 | ||
| 0.481 0.031 0.054 | 0.419 0.029 0.046 | ||
| 0.207 0.019 0.024 | 0.190 0.017 0.021 | 0.048 0.032 0.419 | |
| 0.123 0.014 0.016 | 0.019 0.031 0.010 | ||
| 0.067 0.009 0.010 | 0.046 7.500 0.000 |
| Forward () | |
| [ ] | |
| 20.517 1.359 2.311 | |
| 15.823 0.511 1.528 | |
| 12.358 0.451 1.240 | |
| 9.479 0.928 1.065 | |
| 5.943 1.299 0.949 | |
| Backward () | |
| [ ] | |
| 15.283 1.438 1.900 | |
| 16.260 1.024 1.838 | |
| 11.772 1.684 2.356 | |
| 12.060 2.608 2.438 |
2Universidade Federal do Rio de Janeiro (UFRJ), Rio de Janeiro, Brazil
3Center for High Energy Physics, Tsinghua University, Beijing, China
4Univ. Grenoble Alpes, Univ. Savoie Mont Blanc, CNRS, IN2P3-LAPP, Annecy, France
5Clermont Université, Université Blaise Pascal, CNRS/IN2P3, LPC, Clermont-Ferrand, France
6Aix Marseille Univ, CNRS/IN2P3, CPPM, Marseille, France
7LAL, Univ. Paris-Sud, CNRS/IN2P3, Université Paris-Saclay, Orsay, France
8LPNHE, Sorbonne Université, Paris Diderot Sorbonne Paris Cité, CNRS/IN2P3, Paris, France
9I. Physikalisches Institut, RWTH Aachen University, Aachen, Germany
10Fakultät Physik, Technische Universität Dortmund, Dortmund, Germany
11Max-Planck-Institut für Kernphysik (MPIK), Heidelberg, Germany
12Physikalisches Institut, Ruprecht-Karls-Universität Heidelberg, Heidelberg, Germany
13School of Physics, University College Dublin, Dublin, Ireland
14INFN Sezione di Bari, Bari, Italy
15INFN Sezione di Bologna, Bologna, Italy
16INFN Sezione di Ferrara, Ferrara, Italy
17INFN Sezione di Firenze, Firenze, Italy
18INFN Laboratori Nazionali di Frascati, Frascati, Italy
19INFN Sezione di Genova, Genova, Italy
20INFN Sezione di Milano-Bicocca, Milano, Italy
21INFN Sezione di Milano, Milano, Italy
22INFN Sezione di Cagliari, Monserrato, Italy
23INFN Sezione di Padova, Padova, Italy
24INFN Sezione di Pisa, Pisa, Italy
25INFN Sezione di Roma Tor Vergata, Roma, Italy
26INFN Sezione di Roma La Sapienza, Roma, Italy
27Nikhef National Institute for Subatomic Physics, Amsterdam, Netherlands
28Nikhef National Institute for Subatomic Physics and VU University Amsterdam, Amsterdam, Netherlands
29Henryk Niewodniczanski Institute of Nuclear Physics Polish Academy of Sciences, Kraków, Poland
30AGH - University of Science and Technology, Faculty of Physics and Applied Computer Science, Kraków, Poland
31National Center for Nuclear Research (NCBJ), Warsaw, Poland
32Horia Hulubei National Institute of Physics and Nuclear Engineering, Bucharest-Magurele, Romania
33Petersburg Nuclear Physics Institute (PNPI), Gatchina, Russia
34Institute of Theoretical and Experimental Physics (ITEP), Moscow, Russia
35Institute of Nuclear Physics, Moscow State University (SINP MSU), Moscow, Russia
36Institute for Nuclear Research of the Russian Academy of Sciences (INR RAS), Moscow, Russia
37Yandex School of Data Analysis, Moscow, Russia
38Budker Institute of Nuclear Physics (SB RAS), Novosibirsk, Russia
39Institute for High Energy Physics (IHEP), Protvino, Russia
40ICCUB, Universitat de Barcelona, Barcelona, Spain
41Instituto Galego de Física de Altas Enerxías (IGFAE), Universidade de Santiago de Compostela, Santiago de Compostela, Spain
42European Organization for Nuclear Research (CERN), Geneva, Switzerland
43Institute of Physics, Ecole Polytechnique Fédérale de Lausanne (EPFL), Lausanne, Switzerland
44Physik-Institut, Universität Zürich, Zürich, Switzerland
45NSC Kharkiv Institute of Physics and Technology (NSC KIPT), Kharkiv, Ukraine
46Institute for Nuclear Research of the National Academy of Sciences (KINR), Kyiv, Ukraine
47University of Birmingham, Birmingham, United Kingdom
48H.H. Wills Physics Laboratory, University of Bristol, Bristol, United Kingdom
49Cavendish Laboratory, University of Cambridge, Cambridge, United Kingdom
50Department of Physics, University of Warwick, Coventry, United Kingdom
51STFC Rutherford Appleton Laboratory, Didcot, United Kingdom
52School of Physics and Astronomy, University of Edinburgh, Edinburgh, United Kingdom
53School of Physics and Astronomy, University of Glasgow, Glasgow, United Kingdom
54Oliver Lodge Laboratory, University of Liverpool, Liverpool, United Kingdom
55Imperial College London, London, United Kingdom
56School of Physics and Astronomy, University of Manchester, Manchester, United Kingdom
57Department of Physics, University of Oxford, Oxford, United Kingdom
58Massachusetts Institute of Technology, Cambridge, MA, United States
59University of Cincinnati, Cincinnati, OH, United States
60University of Maryland, College Park, MD, United States
61Syracuse University, Syracuse, NY, United States
62Pontifícia Universidade Católica do Rio de Janeiro (PUC-Rio), Rio de Janeiro, Brazil, associated to 2
63University of Chinese Academy of Sciences, Beijing, China, associated to 3
64School of Physics and Technology, Wuhan University, Wuhan, China, associated to 3
65Institute of Particle Physics, Central China Normal University, Wuhan, Hubei, China, associated to 3
66Departamento de Fisica , Universidad Nacional de Colombia, Bogota, Colombia, associated to 8
67Institut für Physik, Universität Rostock, Rostock, Germany, associated to 12
68Van Swinderen Institute, University of Groningen, Groningen, Netherlands, associated to 27
69National Research Centre Kurchatov Institute, Moscow, Russia, associated to 34
70National University of Science and Technology ”MISIS”, Moscow, Russia, associated to 34
71National Research University Higher School of Economics, Moscow, Russia, Moscow, Russia
72National Research Tomsk Polytechnic University, Tomsk, Russia, associated to 34
73Instituto de Fisica Corpuscular, Centro Mixto Universidad de Valencia - CSIC, Valencia, Spain, associated to 40
74University of Michigan, Ann Arbor, United States, associated to 61
75Los Alamos National Laboratory (LANL), Los Alamos, United States, associated to 61
aUniversidade Federal do Triângulo Mineiro (UFTM), Uberaba-MG, Brazil
bLaboratoire Leprince-Ringuet, Palaiseau, France
cP.N. Lebedev Physical Institute, Russian Academy of Science (LPI RAS), Moscow, Russia
dUniversità di Bari, Bari, Italy
eUniversità di Bologna, Bologna, Italy
fUniversità di Cagliari, Cagliari, Italy
gUniversità di Ferrara, Ferrara, Italy
hUniversità di Genova, Genova, Italy
iUniversità di Milano Bicocca, Milano, Italy
jUniversità di Roma Tor Vergata, Roma, Italy
kUniversità di Roma La Sapienza, Roma, Italy
lAGH - University of Science and Technology, Faculty of Computer Science, Electronics and Telecommunications, Kraków, Poland
mLIFAELS, La Salle, Universitat Ramon Llull, Barcelona, Spain
nHanoi University of Science, Hanoi, Vietnam
oUniversità di Padova, Padova, Italy
pUniversità di Pisa, Pisa, Italy
qUniversità degli Studi di Milano, Milano, Italy
rUniversità di Urbino, Urbino, Italy
sUniversità della Basilicata, Potenza, Italy
tScuola Normale Superiore, Pisa, Italy
uUniversità di Modena e Reggio Emilia, Modena, Italy
vMSU - Iligan Institute of Technology (MSU-IIT), Iligan, Philippines
wNovosibirsk State University, Novosibirsk, Russia
xSezione INFN di Trieste, Trieste, Italy
yEscuela Agrícola Panamericana, San Antonio de Oriente, Honduras
zSchool of Physics and Information Technology, Shaanxi Normal University (SNNU), Xi’an, China
aaPhysics and Micro Electronic College, Hunan University, Changsha City, China
abNational Research University Higher School of Economics, Moscow, Russia
†Deceased