Dense Molecular Filaments Feeding a Starburst: ALMA Maps of CO(3-2) in Henize 2-10
Abstract
We present ALMA CO(3-2) observations at 03 resolution of He 2-10, a starburst dwarf galaxy and possible high-z galaxy analogue. The warm dense gas traced by CO(3–2) is found in clumpy filaments that are kinematically and spatially distinct. The filaments have no preferred orientation or direction; this may indicate that the galaxy is not evolving into a disk galaxy. Filaments appear to be feeding the active starburst; the velocity field in one filament suggests acceleration onto an embedded star cluster. The relative strengths of CO(3-2) and radio continuum vary strongly on decaparsec scales in the starburst. There is no CO(3–2) clump coincident with the non-thermal radio source that has been suggested to be an AGN, nor unusual kinematics.
The kinematics of the molecular gas show significant activity apparently unrelated to the current starburst. The longest filament, east of the starburst, has a pronounced shear of FWHM km s-1 across its 50 pc width over its entire kpc length. The cause of the shear is not clear. This filament is close in projection to a ‘dynamically distinct’ CO feature previously seen in CO(1–0). The most complex region and the most highly disturbed gas velocities are in a region 200 pc south of the starburst. The CO(3–2) emission there reveals a molecular outflow, of linewidth FWZI 120-140 km s-1, requiring an energy . There is at present no candidate for the driving source of this outflow.
1 Introduction
Star formation in dwarf galaxies can be far more extreme than in the Galaxy; dwarf galaxy starbursts can form dense massive star clusters with high efficiency, which in turn can affect the evolution of their host galaxies. How are these starbursts triggered? From the merger of gas-rich galaxies or by accretion of circumgalactic gas? Our picture has until now been limited by the arcsecond resolution of CO images. With the advent of the Atacama Large Millimeter/Submillimeter Array (ALMA) we can now study molecular gas in local galaxies at the scale of individual molecular clouds and star clusters.
We have accordingly used ALMA to study molecular gas in the dwarf starburst galaxy, Henize 2-10. He 2-10 (D= 9 Mpc; 1″=43 pc) is unusual among dwarf galaxies for having copious (several times ) molecular gas (Santangelo et al., 2009), comparable to the estimated stellar mass (Marquart et al., 2007), and high metallicity that ranges from to near-solar (Vacca et al., 2002). He 2-10 hosts an active starburst a few Myr old that was probably triggered by the merger of two dwarf galaxies (Kobulnicky et al., 1995; Vacca et al., 2002; Hunt et al., 2005). The starburst has formed more than 100 Super Star Clusters (SSCs) (Johnson et al., 2000). SSCs are observed in He 2-10 at all stages of their evolution, from the youngest which are deeply embedded in molecular clouds and can be seen only in the radio and infrared (Beck et al., 2001; Vacca et al., 2002; Johnson & Kobulnicky, 2003), through the less deeply embedded that can be seen in the near-infrared, to those that have emerged from the cloud to be seen in optical and UV emission (Conti & Vacca, 1994; Johnson et al., 2000; Chandar et al., 2003). Observations of H and other nebular lines indicate turbulent conditions in the ionized gas and kpc-scale outflows (Méndez et al., 1999; Marquart et al., 2007; Cresci et al., 2010).
The youngest and most embedded clusters in He 2-10 are less than 5 Myr old (Chandar et al., 2003) and are found in the area Conti & Vacca (1994) labeled the “central starburst” or region A. In infrared and radio images this central starburst is seen to comprise two large clouds, each holding molecular gas and a few of young stars (about 10 times the molecular mass and 100 times the young stellar population of the Galactic star formation region W49, Beck et al., 2015). These giant molecular clouds will be ionized, enriched, heated and eventually dispersed by the young stellar population they are creating. The molecular clouds have previously been studied with single dish (Meier et al., 2001) spectra in CO(3–2) and mapped interferometrically in CO(1–0) and CO(2–1) with OVRO (Kobulnicky et al., 1995) and the Submillimeter Array (Santangelo et al., 2009), and in high density tracers HCN and HCO+ with ALMA (Johnson et al., 2018) at arcsecond resolutions. However, while those studies could determine the global state of the gas they could not get down to the scale of the embedded clusters, which requires subarcsecond resolution.
We have obtained ALMA observations of He 2-10 at 03 resolution in the CO(3-2) emission line at 345 GHz. The J=3 level of CO lies 33K above the ground state and typically has critical density for excitation ; this density regime probes the dense, warm gas associated with star-forming clouds. These maps trace the dense molecular gas with 3 km s-1 velocity resolution and beam , far higher than previous observations.
2 Observations
He 2-10 was observed with ALMA in the C40-4 array on 15 November 2016 in the program 2016.1.00492 (S. Beck, PI). The flux and phase calibrators were J0538-4405 and J0846-2607 and the pointing center was 08:36:15.134, -26;24;33.768 (all coordinates are ICRS). Data cubes in 4 spectral windows, one holding the red-shifted line and the other three continuum, were created. Each cube has beam size 03027 and 109 spectral planes, each 1.5 MHz wide (1.3 km s-1). The data were calibrated and imaged in the pipeline and analyzed in CASA 4.7.0 and AIPS. The primary beam at 345 GHz is 25″, FWHM; edge affects become obvious at diameter 18″. The r.m.s. noise in an off-line channel, off-source, was mJy/beam. Continuum was subtracted before imaging. The integrated intensity image (MOM0 map) was produced by summing all emission in the channel maps. The rms in the MOM0 image is Jy km s-1 toward the center of the image. Intensity-weighted velocity (MOM1) and dispersion (MOM2) maps were produced using a cutoff of in the channel maps.
We can estimate the fraction of the total warm dense gas detected by these interferometer maps by comparing the current interferometer map to Meier et al. (2001)’s single dish measurement. Meier et al. (2001) found km s-1 in the central position of their 22″ beam, which corresponds to Jy km s-1 in a 22″ primary beam similar in size to the ALMA beam. The CO(3-2) flux summed over a 15″ field in the ALMA maps is Jy km s-1, where the uncertainty is dominated by the estimated 10% uncertainty in the absolute flux calibration and not by the receiver noise. Within the uncertainties the ALMA maps appear to detect most (%) of the CO(3–2) emission within the ALMA primary beam in He 2-10.
3 Dense Molecular Gas in Clumpy Filaments Fueling a Starburst
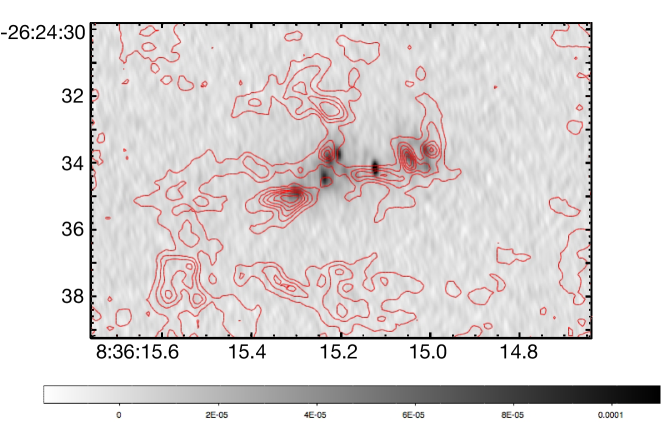
The ALMA CO(3–2) integrated intensity map of He 2-10 is shown in Figure 1 overlaid on a V band HST image.
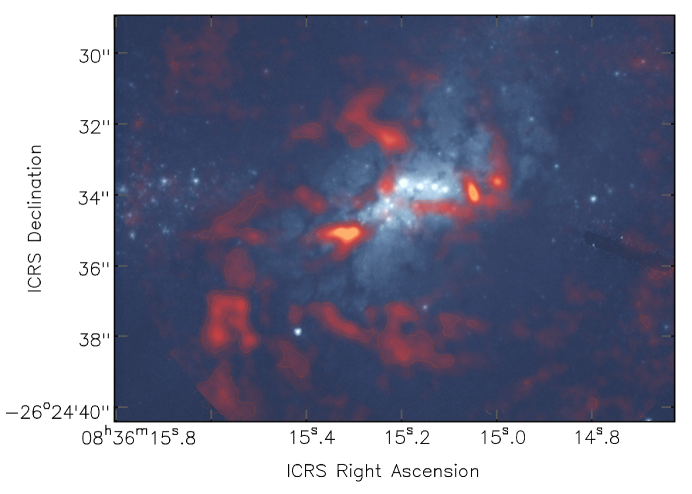
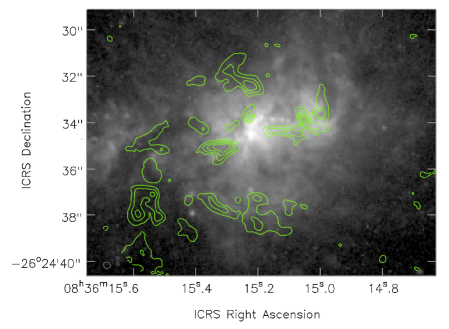
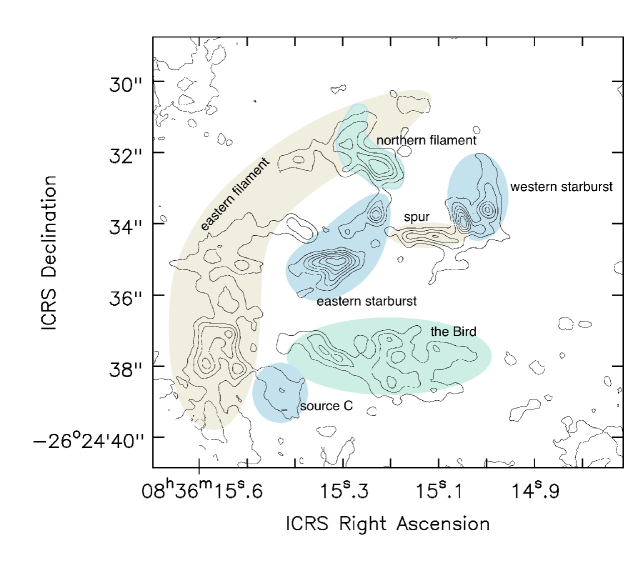
Figure 2 displays the CO moment 0 in contours overlaid on a narrowband 658nm HST image, and Figure 3 marks the different structures with the labels which will be used for them throughout the paper. Comparison to the underlying stellar image reveals that most of the CO is found in dark dust lanes, indicating that these clouds are on the near side of the galaxy. Extended filamentary structures of CO-emitting gas are seen in the east, south, west, and center of the 25″ ( kpc) primary beam. The ALMA image does not cover all of the CO(3-2) emission in He 2-10. Most of the CO is located in the East filament, a winding structure of width 05-1″(20-40 pc) east of the bright starburst region. We identify this filament as the inner portion of an extended CO streamer detected in the lower resolution CO(1-0) maps of Kobulnicky et al. (1995). The CO(3-2) emission takes the form of clumps instead of more extended clouds in part because the line selects dense and warm gas.
3.1 Molecular Gas and the Starburst
The starburst of He 2-10 has been extensively studied in the radio and infrared (Beck et al., 2015; Henry et al., 2007; Johnson & Kobulnicky, 2003) and optical (Méndez & Esteban, 1997). The current starburst is occurring in two giant clouds or cloud associations with total extent 4″ , pc, which are offset in velocity by 30 km s-1. These two regions hold of young OB stars (Beck et al., 2015) concentrated in embedded clusters. In optical and near-infrared images the western starburst region is very faint and has no internal structure, while the eastern starburst region is brighter and has an arc of clusters along its north edge, as shown in Figures 1 and 2.
The high resolution CO(3-2) images show that the active star-forming regions are themselves parts of more extended molecular filaments. We now discuss conditions of the molecular gas in the starburst and the relation of the embedded clusters to the filaments and clumps.
3.1.1 CO(3–2) Excitation: Indications of Hot Molecular Gas in the Starburst
Excitation conditions can cause CO(3–2) emission to appear quite differently from the low J lines. The 33K excitation temperature of the J=3 rotational level is slightly warmer than typical GMC temperatures, although the observed range of temperatures in star-forming clouds extends from K to several hundred degrees. In the average interstellar radiation field CO(3–2) is expected to be strong in dense gas, . In the much higher radiation fields near O stars, where the gas can be hot, CO(3–2) can be subthermally excited and still very bright even in lower density gas. So CO(3-2) can be bright in either dense/warm or hot/moderately dense gas, and both are conditions likely to be found in star formation regions. Without some constraint on excitation, such as an additional CO line, CO(3–2) cannot be simply scaled to derive the CO(1–0) brightness, or used to find masses with the CO conversion factor .
Comparison to lower J CO lines is difficult because existing images have much larger beams: the CO(2-1) map of Santangelo et al. (2009) from the Submillimeter Array had a beam, more than 30 times larger than is ours; also Johnson et al. (2018)’s maps of dense molecular tracers have a similar beam of . This discrepancy in resolution means that we cannot constrain the excitations of the individual clumps. We can however degrade the resolution of the ALMA CO(3–2) map to the Santangelo et al. (2009) beam size for a preliminary view of CO excitation and gas conditions over larger scales. Degrading the resolution lessens the sensitivity to the dense, hot gas because the beam will be dominated by larger, cooler clouds. To distinguish these larger emission features from the small ALMA clumps we designate these larger features as ‘giant molecular associations’ (GMAs) at 2″ (100 pc) resolution; they may comprise individual filaments, giant molecular clouds (GMCs), and/or collections of clumps and filaments.
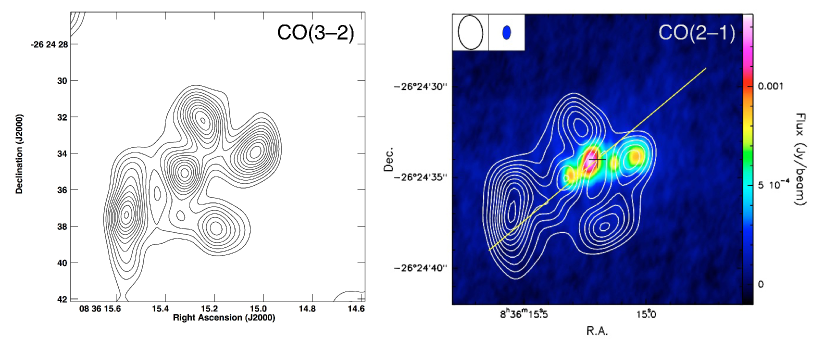
Figure 4 shows that convolved to 19 resolution the ALMA CO(3-2) resembles the (2-1) of Santangelo et al. (2009) in that it appears as five GMAs, corresponding to the South, East and North filaments and the two starburst regions. These GMAs show distinct variations in the CO(3-2)/CO(2-1) ratio over 100 pc scales.
| Cloud | Peak (3-2) | Peak (2-1) | ||
|---|---|---|---|---|
| Jy km/s | Jy km/s | |||
| North Filament | 47 | 28 | 1.7 | 10-20 |
| East Filament | 120 | 70 | 1.7 | 10-20 |
| West Starburst | 55 | 20 | 2.7 | 100 |
| East Starburst | 47 | 21 | 2.2 | 20 |
| South Filament | 51 | 25 | 2.1 | 15 |
Table 1 shows the peak fluxes and flux and brightness ratios, , in each cloud, and the equivalent LTE temperatures for thermally excited gas. The estimated uncertainty in the absolute values of these ratios due to uncertainties in absolute flux calibration of the two lines is and there is further uncertainty from undersampled emission. The seen for the North and East filaments are consistent with cool 10-15 K gas. The two starburst regions and the disturbed South filament are much brighter in CO(3–2) than CO(2–1) and the formal temperatures are much higher, even on these 100 pc scales, although for these high ratios, the inferred LTE temperatures are extremely sensitive to the uncertainties for . Even given the uncertainties, the higher flux ratios imply that the gas close to the star forming regions is hotter than that farther away. If we assume that the emission arises in PDRs (Hollenbach & Tielens, 1999) and that the gas is optically thick, applying the PDR Toolbox (Pound & Wolfire, 2008) tells us that the line ratios of the east and north regions are consistent with gas of density in a standard interstellar radiation field (). The higher line ratios of in the GMAs closer to the starburst can be produced by intense radiation fields in moderate density gas: if , the density need be only , for sub-thermal emission from the hotter gas near the ionized regions. Higher resolution CO maps in other rotational transitions are needed to isolate the high excitation gas in He 2-10, as has been done for the low-metallicity starbursts NGC 5253 (Consiglio et al., 2017) and II Zw 40 (Consiglio et al., 2016). In these galaxies ALMA measurements have made it possible to attribute the high ratios obtained in single dish observations (Meier et al., 2001; Israel, 2005) to the dense, warm gas around individual star-forming star clusters.
3.1.2 Molecular Gas in the Starburst and the Embedded Star Clusters
Figure 5 shows the starburst of He 2-10 in detail, including the integrated intensity image of CO(3-2) emission (MOM0) and a 3.6 cm thermal radio continuum image from the VLA archive (project AJ314). The 3.6 cm radio continuum is an extinction-free tracer of H ii regions excited by young OB stars. CO(3-2) and thermal radio emission are both star formation tracers, but the figure shows that at this resolution, their distributions differ to a remarkable extent. From west to east:
-
1.
In the western starburst from R.A. 08:36:14.95 to 08:36:15.08, the CO and 3.6 cm coincide in a double source, as to be expected for young star clusters embedded in molecular clouds. The optical emission (seen in Figure 2) is very weak because of high extinction.
- 2.
-
3.
There are several bright star clusters in an arc along the north side of the ‘spur’ between R.A. 08:36:15.1 and 08:36:15.2 that appear in the optical and images in Figures 1 and 2. This region has very weak radio continuum, except possibly for the easternmost cluster, and no CO(3-2) emission. These appear to be the most evolved clusters; Chandar et al. (2003) find that these clusters have fairly low values of visual extinction and are 4-5 Myr in age based on their UV spectra. They are visible because they have mostly emerged from their molecular cocoons by photodissociating or blowing out most of their molecular gas.
-
4.
Further along the arc to the east at R.A. 08:36:15.2 to almost 08:36:15.25 are optically detected clusters associated with three clumps of radio continuum emission. The radio and CO emission overlap on the west of this radio triplet but at R.A. 08:36:15.24 we see a clump of ionized gas with very weak associated CO emission. The CO in this region may have been destroyed by high-energy radiation from the young stars or the non-thermal source (Bialy & Sternberg, 2015).
-
5.
A strong radio source at R.A. 08:36:15.3 on the eastern edge of the starburst region partly overlaps a bright clump of CO emitting gas, and is located in a dust lane. This is apparently a young and highly obscured star cluster that has formed off-center in the molecular clump.
We thus see that the distributions of molecules, radio continuum, and optical sources disagree significantly on the 20 pc scale over the eastern starburst. The radio clumps are offset from the strongest optical and near-infrared emission, and the CO emission is further offset from the radio clumps. The comparison of optical, radio continuum, and CO(3–2) suggests an inside-out model for the eastern starburst, wherein the inner part (e.g. closest to the non-thermal source) is the most evolved and most of its gas has been cleared. The radio continuum clumps, which are less evolved star clusters because they still have gas, are on the outer edge of the optical emission region. The hot CO clumps are found even further out. This is in contrast to the western starburst, where the spatial distributions of the CO and radio continuum agree and the optical emission is suppressed by obscuration. The differences between the two clouds are simply explained if the eastern starburst is more evolved while the younger western has not yet destroyed or dispersed significant amounts of gas. This is consistent with the results of Beck et al. (2015) and Henry et al. (2007) who saw ionized gas escaping the eastern starburst, but not the west, through low-density channels.
What can explain the strong CO(3-2) on the spur and the variations in CO to radio continuum between clumps in the eastern starburst region? As noted above, CO(3–2) is not a reliable tracer of molecular gas mass because its brightness depends so much on temperature: in hot gas, CO(3-2) can be much brighter than expected for a given column density (e.g., Turner et al., 2017; Consiglio et al., 2016) . This may explain the strong CO(3-2) emission on the ’spur’, where the gas is heated by the high ambient radiation field from the young clusters and the non-thermal source.
3.1.3 Masses of Molecular Clumps and Star Formation Efficiency
Not knowing the true CO(3–2) excitation means we must proceed with caution to find molecular masses based on the emission. For the starburst region, these will likely be overestimates, perhaps significant, of the gas, such that the masses given by Santangelo et al. (2009) and Kobulnicky et al. (1995) are probably more reliable. However, as can be seen from Figures 1, 2, and 3, much of the CO(3–2) is located far from the active star formation, and for these regions, such as the East filament, an extrapolation to CO(1–0) is reasonable. The single dish CO(1-0) flux is Jy km s-1 (Kobulnicky et al., 1995), from which we obtain a CO(3-2)/CO(1-0) flux ratio of , similar to the value of seen on similar scales in II Zw 40 (Consiglio et al., 2016). This is equivalent to an overall brightness ratio of 0.7, characteristic of optically thick thermally excited gas at 15 K. However individual clouds may differ in excitation; in particular, CO(3-2) may be brighter in warm clouds near the starburst, as suggested by the comparison to CO(2-1) discussed previously (Table 1). With these caveats we adopt the CO(3-2)/CO(1-0) flux ratio of 6 and conversion factor of . We find clump masses of several over areas in the East and South filaments. The surface density in these clumps is over the threshold where active star formation is expected to occur (Lada et al., 2010). One possible explanation for the lack of star formation in the East filament in particular is the presence of strong shear within the filament () , which may, as in barred galaxies (Maciejewski et al., 2002; Tsai et al., 2013), prevent cloud collapse. The kinematics of the East filament and the rest of the galaxy are discussed in the next section.
A complete census of molecular clumps in He 2-10, selected by contrast over the background, is in Appendix A.
4 Chaotic Filament Kinematics in He 2-10
In stellar structure He 2-10 appears to be an early-type system (Nguyen et al., 2014). The kinematics of He 2-10 are complex, and provide clues to a history of interaction that has led to the present starburst. The stellar component appears to be in random motion, not rotation, according to Nguyen et al. (2014) and Marquart et al. (2007), who conclude that this may ‘preclude the existence of a dominant star-forming disk’. The systemic velocity defined by the stars is km s-1 (Marquart et al., 2007), agreeing with the HI velocity of 873 km s-1 (Kobulnicky et al., 1995). The molecular gas is seen at moderate resolution (Santangelo et al., 2009) to have two velocity peaks at km s-1 and km s-1. Beck et al. (2015) find the ionized gas associated with the starburst is also concentrated in two spatially distinct clouds, identified with the two starburst regions, at km s-1and km s-1. The presence of these two velocity features can create an apparent overall velocity gradient in low and moderate resolution maps, as was reported by Kobulnicky et al. (1995) in the first aperture synthesis observations of CO in He 2-10 . However it should not be concluded from this apparent gradient that the molecular gas is in simple rotation; the ALMA CO(3–2) emission shows a complex and chaotic velocity field.
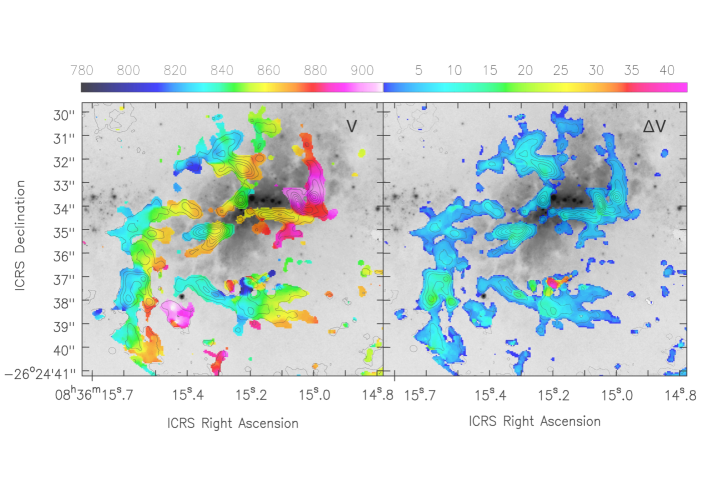
Figure 6a shows the intensity-weighted velocity (i.e., the first moment of the data cube) of the CO(3-2) emission. CO(3-2) is seen over the same km s-1 range as in earlier observations. But the kinematics here are far more complex than anything seen previously. Instead of a gradient in a smooth and extended gas distribution, we see distinct clumpy filaments of gas at different velocities. (These kinematic structures may be seen more clearly in the channel maps included in Appendix B.) The velocity shift from red in the northwest to blue in the southeast which has previously been interpreted as a smooth velocity gradient, is seen here to be strongly determined by a single red feature which is falling onto the western starburst (see section 4.3), and a large concentration of gas south of the starburst region appears to have an independent velocity structure. The gas velocity is seen to change abruptly over very short distances, and different velocity features fall in the same line of sight. The ALMA CO(3–2) maps indicate that, like the stars, the gas motions within He 2-10 are chaotic rather than ordered. We will now discuss the kinematics of each filament in turn.
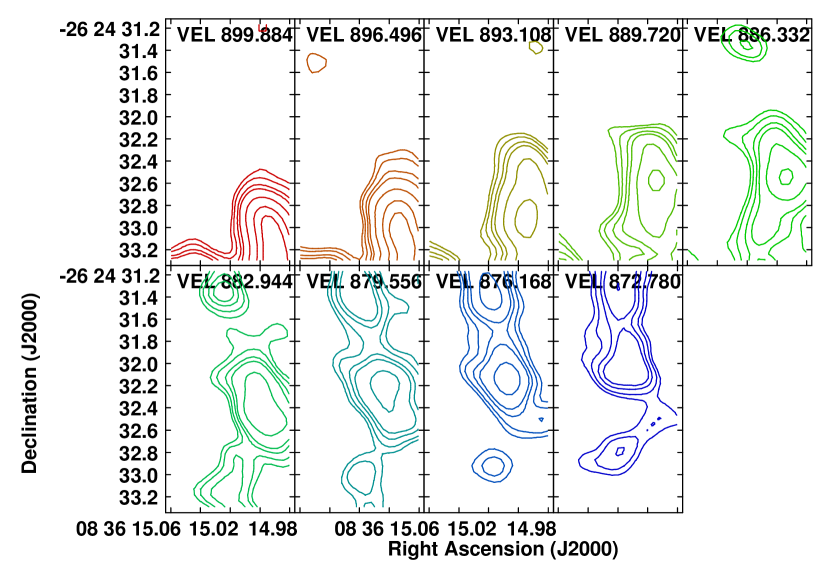
4.1 The East Filament System
The longest and best-defined filament in He 2-10 is mostly east of the starburst and curves west at its north end to intersect another gas component, the North filament, near 08:36:15.35, -26:24:32. This feature is seen most clearly in the channel maps in Figure 10 (Appendix B). This filament appears related to the CO(1-0) feature that Kobulnicky et al. (1995) identified as a tidal tail. The filament is 500 pc in length and appears to extend beyond the ALMA primary beam(Meier et al., 2001). In spite of the abundance of dense CO(3–2)-emitting gas, the East filament itself does not itself show evidence of active massive star formation in the form of radio continuum emission. The East filament largely coincides with an optical dust lane (Figures 1 and 2) and so is on the near side of the galaxy. This filament contains some of the most blue-shifted CO(3-2) in the galaxy, with velocities km s-1. It is highly clumped and the velocity varies slightly from clump to clump.
One of the defining features of the East filament is a pronounced velocity shear. This shear is evident along the entire 500 pc length of the filament south of -26:24:33. The shear direction is from blue on the east to red on the west and its magnitude is 20-40 km s-1 across the filament’s 30 to 50 pc width, with a maximum of km s-1 near -26:24:38. In contrast, there is no signficant velocity gradient along the length of the filament. This calls into question Kobulnicky et al. (1995)’s original identification of this structure as a tidal tail. In magnitude and scale the shear is reminiscent of that seen along spiral arms in spiral galaxies. There is no obvious mechanism that is responsible for the shear. The gas clump at -26:24:38.5 velocity km s-1, which we identify with the ‘dynamically distinct source C’ discovered by Kobulnicky et al. (1995) and which from its position on the dust lane is falling into the galaxy, has virial mass derived with an assumed density distibution of , not enough to cause such large scale shear by its gravitational attraction. (Further parameters of Clump C are in Table 2, Appendix A). Another possible mechanism that could produce the shear is an hypothetical elongated mass along the 0.5 kpc length of the arm, a situation similar to that producing the shear in galactic bars and spiral arms. While this would provide a natural explanation for the length of the sheared filament, the hypothesized mass appears to be dark; it could be cool gas. A final possible mechanism for the shear is that the filament is in fact an expanding shell decelerating into a confining medium, but there is no evidence for any explosion or other source of such expansion there. The shear is a consistent and unexplained kinematic feature of the East filament, and it is far from the only mysterious feature in the kinematics of He 2-10.
4.2 The Southern Outflow Region: “The Bird”
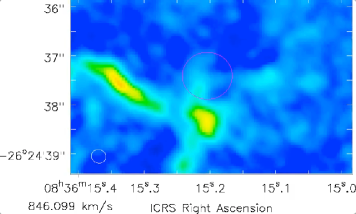
The most dynamic region in He 2-10 is the gas clump at 08:36:15.2, -26:24:37 (ICRS). This region stands out in the map of CO(3–2) velocity dispersion, (Figure 6b). While the dispersion is 5 –12 km s-1 over all the other gas in He 2-10, in this compact region it goes up to 40 km s-1. In shape this region resembles a long-necked bird flying east, with the high velocity dispersion confined to the upper wing. Santangelo et al. (2009) locate two density clumps in this region, both very blue (820-840 km s-1). The CO(3-2) emission in this region is complex, consisting of multiple clumps and filaments. The high dispersion region has emission at velocities from 875 to 920 km s-1, within 25-50 pc in radius. The channel maps, animated on-line in Figure 7 and also in Figure 10, show confined emission from the reddest and bluest velocities; the central velocity channels have emission extending radially outward.
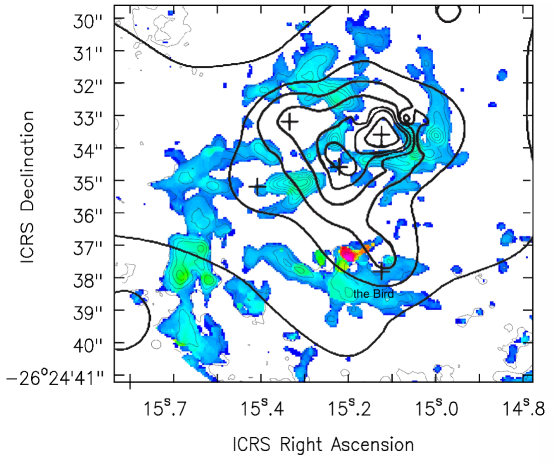
The Bird appears to be a molecular outflow. The source of the outflow is not apparent. There is nothing obvious at this location in optical or near-infrared continuum images, nor is there radio continuum. There is no large-scale systematic velocity gradient in this region, so there is unlikely to be a significant concentration of dark mass. The Bird is located on the inner part of the southern arc of H emission that extends to kpc scales in an apparent galactic bipolar outflow as detected by Méndez et al. (1999). However the H line in the southern region, unlike in the north, is not broadened (Méndez & Esteban, 1997; Méndez et al., 1999), possibly because it is confined by the molecular gas. The Bird is near x-ray source #30 in Kobulnicky & Martin (2010), also shown in Figure 8. The X-ray emission emerges from regions of low CO column and extends south in the direction of the Bird. Two registrations for the X-ray map have been suggested, depending on which of the two central X-ray sources lines up with the nonthermal radio source in the center of the starburst: in the registration of Reines et al. (2016) which places the western X-ray source on the nonthermal radio source, the X-ray spur and point source are closer to and almost centered on the high dispersion region. It is also notable that the molecular outflow is within 100 pc of highly redshifted Source C, although how they might be related is unclear.
We can estimate a minimum energy necessary to produce the outflow based on the mass and velocity. The CO flux for the Bird is Jy km s-1; for CO(3–2)/CO(1–0) = 6, we compute a total mass for this feature based on CO(3–2) of . For comparison, Santangelo et al. (2009) find a mass of , based on lower resolution CO(2–1) maps (corrected to Xco = ); this suggests that the molecular gas in this region is relatively cool or relatively dilute. The CO(3–2) flux of the smaller high dispersion region in red in the ALMA map of Figure 6 is 13 Jy km s-1, thus we infer the mass involved in the outflow is : some of the more extended gas within the larger Bird region may also be involved in the outflow but moving transverse to the line of sight, as implied by the channel maps. The FWZI of the CO(3–2) emission in the high dispersion region is km s-1. If we assume that the gas is an expanding shell of material, a minimum energy of ergs is needed to produce the observed outflow, and more if it includes more gas moving transverse to the line of sight, as is likely. This energy corresponds to 100 simultaneous SNe if all their energy went into gas motions. Kobulnicky & Martin (2010) note that the thermal energy implied by the galaxy-wide X-ray emission requires ergs, which they attribute to the effects of the starburst.
While the galaxy-wide X-ray emission and H bubbles in He 2-10 may originate in supernovae and winds within the starburst, the Bird region is kpc in projected distance from the starburst, and appears to be confined to a smaller region. The Bird molecular outflow may be indicative of a hidden source of energy.
4.3 The Filaments Feeding the Starburst
The smallest filamentary structure is the North filament. It might be thought part of the East filament, which it overlaps, but its line peak velocity is the 850-860 km s-1 of the east starburst cloud, more than 20 km s-1 offset (this is seen most clearly in the channel maps in Appendix B). The North filament terminates on the edge of the eastern starburst. We argue above that the eastern starburst has lost most of its associated molecular gas; it possible that the short filament we see now is the remnant of a larger system that fed the eastern starburst and has been either used up or dispersed.
The West filament starts north of the western starburst. It intersects or overlaps the eastern starburst near Dec -26:24:34.5, where both velocity components are seen in the line profile, and re-appears south of the spur. It has the reddest velocities in the galaxy: km s-1 . Since the West filament lies along a dust lane, it is foreground and the redshifted gas is falling toward the galaxy. Unlike the other filaments, the West filament has a significant velocity gradient along much of its length. The gradient, shown in Figure 9, is in the direction of increasing velocity towards the starburst. The filament appears to be accelerating into the western starburst cloud; the velocities, modulo projection effects, are consistent with infall into a central mass in this immediate vicinity of a few . This is not far from the mass of the western starburst cloud as estimated by Santangelo et al. (2009) and Beck et al. (2015). This filament may still be adding fuel to the western starburst cloud. The velocity and size of the He 2-10 West filament suggests that this is not a long-lived phenomenon; the time scale for the filament material to travel its pc length into the cloud at typical velocities of km s-1 is only yr.
5 Discussion and Summary
We have presented ALMA observations of the CO(3-2) emission in He 2-10 with spatial resolution or 12 pc. The result is a picture of the galaxy very different from that previously seen. Since the first interferometric study of this system (Kobulnicky et al., 1995) it has been thought that the starburst started from the merger of two dwarf galaxies. Our high resolution observations add to and refine this picture. The molecular gas in He 2-10 is very disordered, with clumpy filaments at many velocities and in different directions. The longest and most massive filament is east of the starburst and is part of the structure Kobulnicky et al. (1995) called a tidal tail. However the filament has no velocity gradient along its 0.5 kpc length; instead it shows a strong shear across its width. This shear may have inhibited star formation in the dense clumps of the filament.
The starburst activity is in two distinct regions that have been proposed as the cores of the merger partners. The current observations show filaments feeding into the two starburst regions. The velocity gradient in the filament near the western starburst region show it is accelerating onto the young star clusters.
The gas kinematics show that the starburst is not the only mark of the disturbed past of this galaxy, or the only force shaping its development. There are many very unusual, chaotic and dynamic kinematic features that are not all directly connected to the starburst or any other visible feature. These include the shear in the East filament, the gas clump in the south (source C) which is red-shifted by 70 km s-1 relative to its surroundings, and also in the south the extended region which we call the Bird, where the molecular linewidths are as high as 120 km s-1. The Bird appears to hold a molecular outflow of at least ergs, but with no clear cause or driving source.
Specifically:
-
•
The CO(3-2) in He 2-10 is in clumps that form filamentary systems, and many of the filaments correlate with optical dust lanes. Although the implied densities of the filaments are high enough for star formation, they appear at present quiescent.
-
•
The total CO(3–2) flux is Jy km s-1, at least 70% of the single dish values. For CO(3–2)/CO(1–0) flux ratio of 6 and a Galactic conversion factor of , this flux implies a total molecular gas mass, including He, of for the central 18″ region including the starburst; this may be an upper limit to the molecular gas mass if there is unusually warm CO(3-2) near the starburst.
-
•
The two starburst clouds, eastern and western, are each associated with a filament. The two filaments appear to overlap in projection near the non-thermal radio source between the two starburst clouds.
-
•
There is a velocity gradient along the West filament consistent with infall into the western starburst cloud.
-
•
The non-thermal radio source which has been variously identified as an AGN and an SNR is located in a bridge or spur of molecular gas; it is not associated with a molecular clump. The CO(3–2) kinematics there are quiescent, which may argue that it is an SNR rather than an AGN.
-
•
The East filament shows a pronounced velocity shear of km s-1 across its 50 pc width for its entire pc length. This shear may have inhibited star formation in this massive filament. There is little or no velocity gradient along its length. The cause of the shear is unknown. It may indicate the presence of significant dark mass along the filament.
-
•
The ‘dynamical source C’ noted in previous CO observations has been resolved and is a gas clump of with velocity km s-1 redder than the nearby filaments. Its relation to the rest of the gas, and the galaxy, is unclear.
-
•
The southern region which we call the Bird has a complex velocity field consistent with a molecular outflow. The velocity width of the outflow is km s-1 (FWZI), contained within a region of 25 pc extent, and it involves between of molecular gas. The energy estimated to drive the outflow is ergs and likely ergs. There is no radio, optical, or infrared source at this location; there is diffuse H emission but the H shows no kinematic irregularities here. The source of the molecular outflow is currently unknown.
In short, even in this galaxy which is known as a type example of a merger-triggered starburst, there is substantial kinematic and energetic activity independent of star formation. The current molecular medium is dominated by dense clumpy filaments, which have complex and chaotic kinematics. There is no preferred direction or orientation of the filaments, which may show that the galaxy is not evolving into a disk system. The complex kinematic picture of the gas in He 2-10 cannot be simply explained by the starburst: other energy sources must be present. The energetic events include a large-scale shear in a massive filament, and most notably a molecular outflow of energy least ; the causes are as yet unknown but they do not appear to be related to the current starburst. Dark forces, or matter, may be shaping this galaxy.
References
- Astropy Collaboration (2013) Astropy Collaboration, 2013, A&A, 558, 33
- Beck et al. (2001) Beck, S. C., Turner, J. L., & Gorjian, V. 2001, AJ, 122, 1365
- Beck et al. (2015) Beck, S., Turner, J., Lacy, J., & Greathouse, T. 2015, ApJ, 814, 16
- Beck et al. (2002) Beck, S. C., Turner, J. L., Langland-Shula, L. E., et al. 2002, AJ, 124, 2516
- Bertin & Arnouts (1996) Bertin, E., & Arnouts, S., 1996, A&AS, 117, 393
- Bialy & Sternberg (2015) Bialy, S. & Sternberg, A., 2015, MNRAS, 450, 4424
- Bisbas et al. (2015) Bisbas, T. G., Haworth, T. J., Barlow, M. J., et al. 2015, MNRAS, 454, 2828
- Cabanac, Vanzi & Sauvage (2005) Cabanac, Remi A.; Vanzi, Leonardo; & Sauvage, Marc 2003, ApJ, 631,252
- Chandar et al. (2003) Chandar, R., Leitherer, C., Tremonti, C., & Calzetti, D. 2003, ApJ, 586, 939
- Consiglio et al. (2016) Consiglio, S. M., Turner, J. L., Beck, S., & Meier, D. S. 2016, ApJ, 833, L6
- Consiglio et al. (2017) Consiglio, S. M., Turner, J. L., Beck, S., et al. 2017, ApJ, 850, 54
- Conti & Vacca (1994) Conti, P. S., & Vacca, W. D. 1994, ApJ, 423, L97
- Cresci et al. (2010) Cresci, G., Vanzi, L., Sauvage, M., Santangelo, G., & van der Werf, P. 2010, A&A, 520, A82
- Cresci et al. (2017) Cresci, G.; Vanzi, L.; Telles, E.; Lanzuisi, G.; Brusa,M.; Mingozzi, M.; Sauvage, M.; & Johnson, K., 2017, A&A, 604, A101
- Draine (2011) Draine, B. T. 2011, ApJ, 732, 100
- Ferland et al. (2013) Ferland, G. J.; Porter, R. L.; van Hoof, P. A. M.; Williams, R. J. R.; Abel, N. P.; Lykins, M. L.; Shaw, G.; Henney, W. J.; & Stancil, P. C., 2013, Rev. Mexicana Astron. Astrofis.49, 137
- Galliano et al. (2005) Galliano, F., Madden, S. C., Jones, A. P., Wilson, C. D., & Bernard, J.-P. 2005, A&A, 434, 867
- Henry et al. (2007) Henry, A. L., Turner, J. L., Beck, S. C., Crosthwaite, L. P., & Meier, D. S. 2007, AJ, 133, 757
- Hildebrand (1983) Hildebrand, R. H. 1983, QJRAS, 24, 267
- Hollenbach & Tielens (1999) Hollenbach, D. J., & Tielens, A. G. G. M. 1999, Reviews of Modern Physics, 71, 173
- Hunt et al. (2005) Hunt, L., Bianchi, S., & Maiolino, R. 2005, A&A, 434, 849
- Israel (2005) Israel, F. P. 2005, A&A, 438, 855
- Johnson et al. (2000) Johnson,K., Leitherer, C., Vacca, W., Conti, P. 2000, AJ, 120, 1273
- Johnson & Kobulnicky (2003) Johnson, K. E., & Kobulnicky, H. A. 2003, ApJ, 597, 923
- Johnson et al. (2018) Johnson, K. E., Brogan, C. L., Indebetouw, R., et al. 2018, ApJ, 853, 125
- Kobulnicky et al. (1995) Kobulnicky, H. A., Dickey, J. M., Sargent, A. I., Hogg, D. E., & Conti, P. S. 1995, AJ, 110, 116
- Kobulnicky & Martin (2010) Kobulnicky, H. A., & Martin, C. L. 2010, ApJ, 718, 724
- Lada et al. (2010) Lada, C. J., Lombardi, M., & Alves, J. F. 2010, ApJ, 724, 687
- Leitherer et al. (1999) Leitherer, C., Schaerer, D., Goldader, J. D., et al. 1999, ApJS, 123, 3
- Leitherer et al. (2014) Leitherer, C., Ekström, S., Meynet, G., et al. 2014, ApJS, 212, 14
- Maciejewski et al. (2002) Maciejewski, W., Teuben, P. J., Sparke, L. S., & Stone, J. M. 2002, MNRAS, 329, 502
- MacLaren et al. (1988) MacLaren, I., Richardson, K. M., & Wolfendale, A. W. 1988, ApJ, 333, 821
- Marquart et al. (2007) Marquart, T.; Fathi, K.; Östlin, G.; Bergvall, N.; Cumming, R. J.; & Amram, P. , 2007, A&A, 474, L9
- Meier et al. (2001) Meier, D. S., Turner, J. L., Crosthwaite, L. P., & Beck, S. C. 2001, AJ, 121, 740
- Méndez et al. (1999) Méndez, D. I., Esteban, C., Filipović , M. D., et al. 1999, A&A, 349, 801
- Méndez & Esteban (1997) Méndez, D. I., & Esteban, C. 1997, ApJ, 488, 652
- Nguyen et al. (2014) Nguyen, D. D.; Seth, A. C.; Reines, A. E.; den Brok, M; Sand, D.; & McLeod, B. 2014, ApJ, 794, 34
- Pound & Wolfire (2008) Pound, M. W. & Wolfire, M.G., 2008, ASP Conference Series, Vol. 394 Edited by Robert W. Argyle, Peter S. Bunclark, and James R. Lewis., p.654
- Reines et al. (2016) Reines, A. E., Reynolds, M. T., Miller, J. M., et al. 2016, ApJ, 830, L35
- Rémy-Ruyer et al. (2014) Rémy-Ruyer, A., Madden, S. C., Galliano, F., et al. 2014, A&A, 563, A31
- Retes-Romero et al. (2017) Retes-Romero, R., Mayya, Y. D., Luna, A., & Carrasco, L. 2017, ApJ, 839, 113
- Reines et al. (2011) Reines, A. E., Sivakoff, G. R., Johnson, K. E., & Brogan, C. L. 2011, Nature, 470, 66
- Reines et al. (2016) Reines, A. E., Reynolds, M. T., Miller, J. M., et al. 2016, ApJ, 830, L35
- Santangelo et al. (2009) Santangelo, G, Testi, L., Gregorini, L, et al. 2009, A&A, 501, 495
- Rosolowsky & Leroy (2006) Rosolowsky, E., & Leroy, A. 2006, PASP, 118, 590
- Sofue et al. (1994) Sofue, Y., Wakamatsu, K.-I., & Malin, D. F. 1994, AJ, 108, 2102
- Tsai et al. (2013) Tsai, C.-W., Turner, J. L., Beck, S. C., Meier, D. S., & Wright, S. A. 2013, ApJ, 776, 70
- Turner et al. (2015) Turner, J. L.; Beck, S. C.; Benford, D. J.; Consiglio, S. M.; Ho, P. T. P.; Kovacs, A.; Meier, D. S.; & Zhao, J.-H
- Turner et al. (2017) Turner, J. L., Consiglio, S. M., Beck, S. C., et al. 2017, ApJ, 846, 73
- Vacca et al. (2002) Vacca, W. D., Johnson, K. E., & Conti, P. S. 2002, AJ, 123, 772
Appendix A Clump Census
We ran the cprops code on our CO(3-2) image cube as described in Rosolowsky & Leroy (2006), through use of cpropstoo, which has been optimized to run on ALMA data. This program works by identifying local maxima in a data cube, in this case CO(3–2), as CO clumps. Once a 6 detection is made in two consecutive channels, the surrounding emission is mapped down to a two-sigma detection limit in a minimum of two consecutive channels. The minimum area required to be uniquely associated with an individual maximum was 25 pixels, and a minimum volume of 32 pixels. Pixels are 0.053″. Clump detection was completed on a non-primary beam corrected image, while measurement was made on a primary beam corrected image. This resulted in 70 total clumps. The clumps are listed in the machine-readable table; the first 5 lines of which appear below.
The Table lists the clumps, numbered in order of right ascension, and gives the position, major axis in pc, peak line velocity, velocity FWHM, flux, luminosity and mass.. The mass is found from the CO flux using a Rayleigh-Jeans corrected brightness temperature ratio of 0.82, appropriate for 30 K gas, for CO(3-2)/CO(1-0) and the default cprops of .
| ID | R.A. | Dec | Velocity | FWHM | Flux | Luminosity | Mass | |
|---|---|---|---|---|---|---|---|---|
| pc | km/sec | km/sec | K km/sec | |||||
| 0 | 129.0642853 | -26.41073036 | 25.77 | 898.1 | 45.7 | 85 | 1.6E+05 | 7.4E+05 |
| 1 | 129.0639648 | -26.41031075 | 892.6 | 4.8 | 1 | 2.2E+03 | 9.8E+03 | |
| 2 | 129.0627136 | -26.4094162 | 14.16 | 892.3 | 30.4 | 35 | 6.7E+04 | 3.0E+05 |
| 3 | 129.0635986 | -26.41038895 | 11.10 | 892.1 | 11.7 | 7 | 1.4E+04 | 6.2E+04 |
| 4 | 129.0632629 | -26.41085815 | 12.37 | 882.0 | 15.1 | 10 | 1.9E+04 | 8.6E+04 |
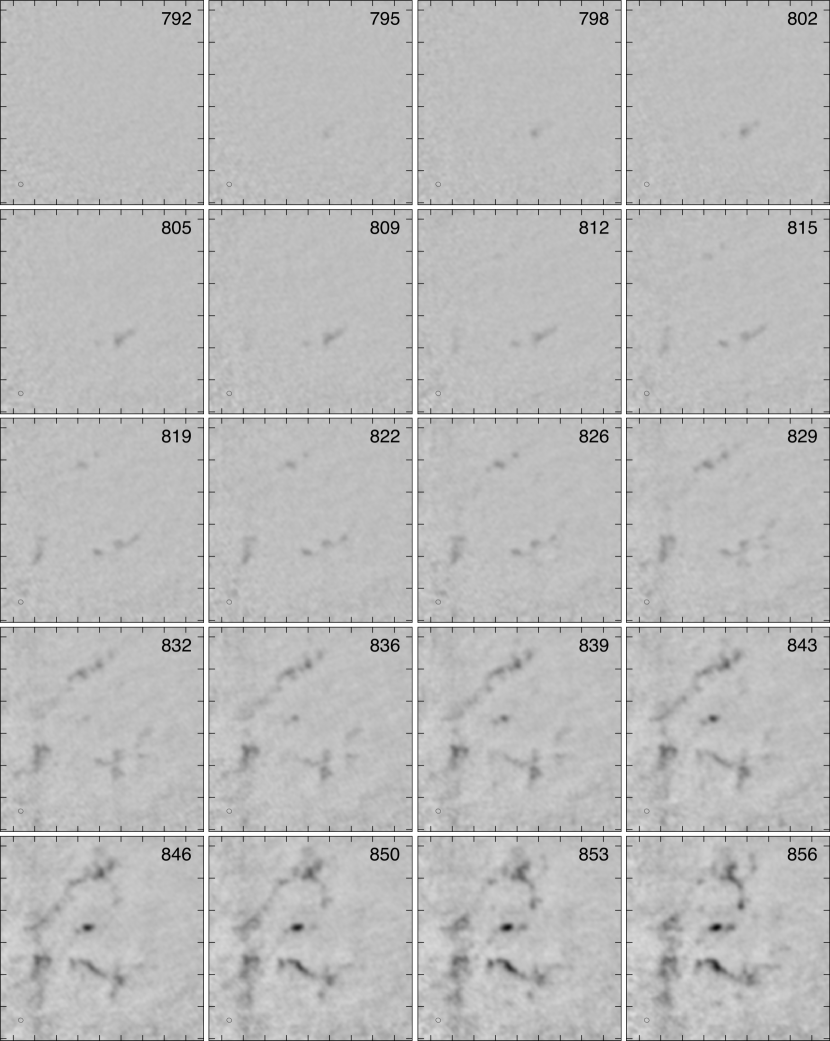
Appendix B Kinematic Channel Maps
Velocity channels of the CO(3-2) emission are shown in Figure 10. Coordinates and intensity scale are in the last panel.
![[Uncaptioned image]](/html/1809.01339/assets/x11.png)
![[Uncaptioned image]](/html/1809.01339/assets/x12.png)