Polarimetry of the eclipsing pulsar PSR J17482446A
Abstract
Observations with the Parkes radio telescope of the eclipsing millisecond binary pulsar PSR J17482446A, which is in the globular cluster Terzan 5, are presented. These include the first observations of this pulsar in the 3 GHz frequency band, along with simultaneous observations in the 700 MHz band and new observations around 1400 MHz. We show that the pulsar signal is not eclipsed in the 3 GHz band and observe the known eclipses in the lower frequency bands. We find that the observed pulse signal becomes depolarized during particular orbital phases and postulate that this depolarization occurs because of rotation-measure fluctuations resulting from turbulence in the stellar wind responsible for the eclipses.
1 Introduction
The pulsar PSR J17482446A (PSR B174424A) was discovered by Lyne et al. (1990) using the 64-m diameter Parkes radio telescope. This was the second known binary pulsar system for which the pulsed signal is eclipsed during part of the orbit and it is the prototype for the class of eclipsing binary pulsars now known as “redbacks” (Roberts, 2013). The pulsar has a pulse period of 11.56 ms and is located within the globular cluster Terzan 5 (hence also known as Ter 5A) and is in a low-eccentricity orbit with an orbital period of only 109 minutes. The companion mass is estimated to be at least 0.089. The projected semi-major axis of this system (0.12 light seconds) implies that the separation between the pulsar and its white dwarf companion is around 0.85.
The duration of the eclipse is variable in time and also changes as a function of the observing frequency. In the 20 cm (1.4 GHz) observing band the eclipse duration is more than one-third of the orbital period (Lyne et al., 1990). The expected eclipse duration due to a Roche lobe of estimated radius 0.15 (Nice & Thorsett, 1992) is only six minutes, much less than the typical eclipse duration. Therefore, the eclipse must be caused by an ablated wind from the companion. Nice et al. (1990) observed the pulsar at frequencies between 0.8 and 1.66 GHz and found that the eclipse duration decreases with observing frequency with a dependence of .
Understanding the eclipse mechanism can provide the opportunity to probe the mechanism of the pulsar radiation and also the interaction between the pulsar wind and the companion. There have been many attempts to explain the eclipse mechanism, for example, refractive effects (Phinney et al., 1988), pulse smearing (Ryba & Taylor, 1991), cyclotron and synchrotron absorption (Eichler, 1991; Thompson et al., 1994), induced scattering (Luo & Melrose, 1995) and free-free absorption (Wasserman & Cordes, 1988; Rasio et al., 1989, 1991). However, the published mechanisms based on refraction cannot explain the frequency dependence of the eclipse duration. Pulse smearing models requires a longer dispersion time delay near the eclipse than is observed (Nice et al., 1990). Cyclotron and synchrotron absorption models require very high magnetic fields and pulsar winds that are much hotter than is usually assumed (Thompson et al., 1994). Free-free absorption can explain the dependence between the eclipse duration and the observing frequencies and currently seems consistent with observations, although it does require a relatively low wind temperature (Fruchter & Goss, 1992).
In this paper, we present multi-frequency observations of PSR J17482446A made with the Parkes 64-m radio telescope. Our observations and analysis methods are described in Section 2. In Section 3 we investigate how the pulsar’s polarization properties and its rotation measure (RM) vary as function of orbital phase and we discuss the implications of this work in Section 3.3. We summarize our conclusions in Section 5.
After completing most of this work, we became aware that Anna Bilous in her PhD thesis (Bilous, 2012) had also observed the orbital-phase dependence of polarization for PSR J17482446A in bands centered at 820 MHz and 1500 MHz using the Green Bank Telescope. Her results show a similar radio-frequency and orbital-phase dependence for the linear polarisation to those presented here. She also attributed the linear depolarization to RM fluctuations in the circumstellar plasma.
2 Observation and data analysis
Our observations were made between November 2014 and January 2015, using the Parkes 64-m diameter radio telescope. The data were taken in three frequency bands which we label 40 cm, 20 cm and 10 cm, centered at 728 MHz, 1369 MHz and 3100 MHz, respectively. In the 20 cm band the central beam of the multibeam receiver was used. Observations in the 10 cm and 40 cm bands were simultaneous and used the dual-band 10 cm/50 cm receiver. We recorded a bandwidth of 64 MHz at 40 cm, 256 MHz at 20 cm and 1024 MHz at 10 cm, divided into 128, 1024 and 1024 frequency channels for the three bands respectively. The signal processing systems used were the Parkes digital filterband system, PDFB4, for the 20 cm and 10 cm observations, and a coherent dedispersion system, CASPSR (van Straten & Bailes, 2011), for the 40 cm observations. All of the data were recorded in full polarization mode with 1-min subintegrations. Before each observations of the pulsar, a 2-min pulsed calibration signal was recorded. We used measurements of Hydra A to calibrate the flux density scale for our pulsar observations.
All the observations were initially processed and calibrated using psrchive (Hotan et al., 2004). In brief, we removed 5% of the band-edges along with narrow band interference. We then calibrated our observations using the polarisation and flux density calibrators. The 20 cm observations are affected by cross-coupling within the feed. We used the pcm method to account for this cross-coupling (van Straten, 2004).
We aim to investigate the properties of the pulsar as function of orbital phase. We therefore obtained relatively high signal-to-noise ratio (S/N) polarization profiles at a range of orbital phases by forming profiles for every 3 minutes of observing time. To form the mean polarization profiles, the Faraday rotation across the observing band must be taken into account. Since the rotation measure (RM) could vary as a function of orbital phase, we measured the RM for each 3-minute profile using the psrchive routine rmfit. We initially searched over a large range in RM (from 1000 to 1000 rad m-2) and determined the RM which maximized the linearly polarized intensity. To improve on this estimate the total observing band was divided into two parts and the RM value was used to sum the polarization profile in each half. The final RM value was then obtained by calculating the weighted mean position angle difference between the two bands and, if necessary, iterating.
3 Results
3.1 Variation of flux density with orbital phase
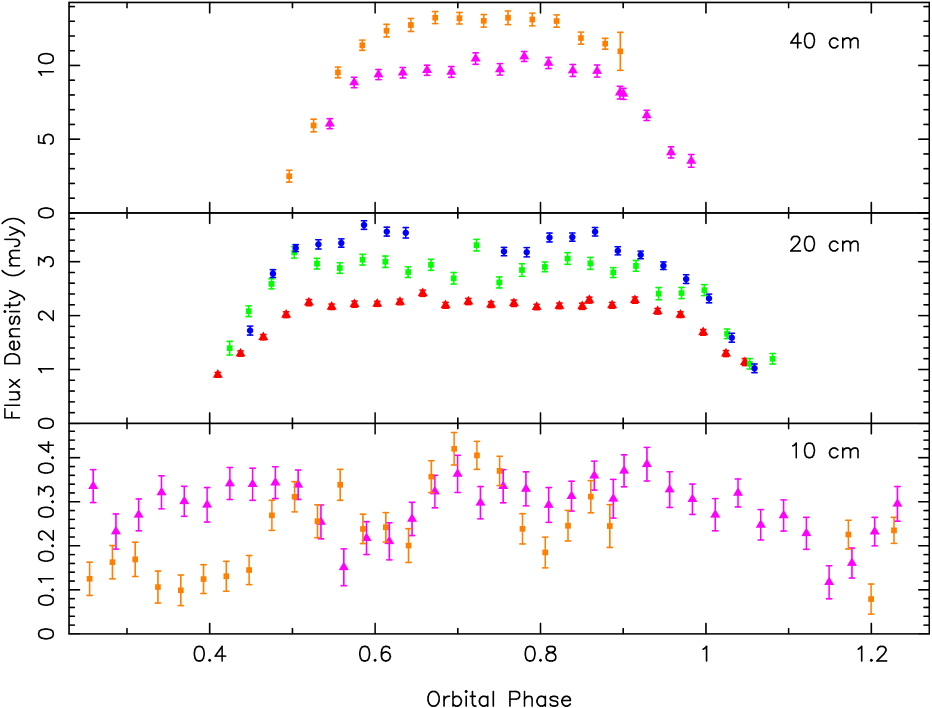
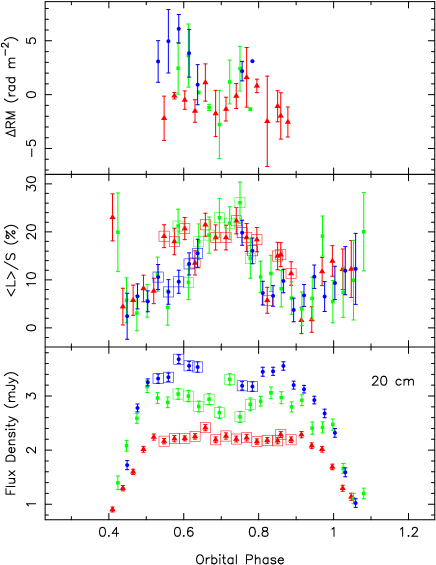
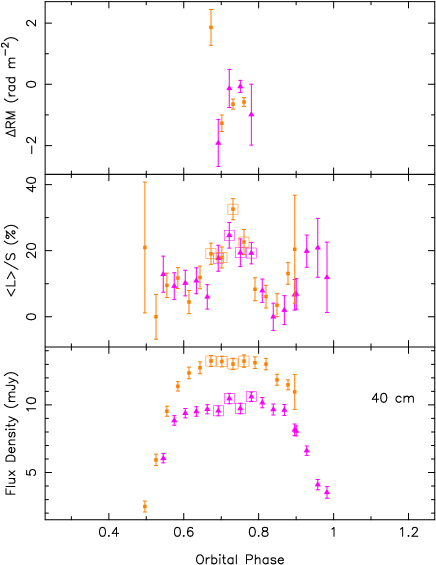
The mean pulsed flux density () as function of orbital phase for the three observing bands is presented in Figure 1 with the independent observations shown in different colors. It is clear that the duration of the eclipse decreases with increasing observation frequency as already found by Lyne et al. (1990) and Nice et al. (1990). We find no evidence of any eclipse in the 10 cm band (bottom panel of Figure 1) although the observed flux density is quite variable at all orbital phases.
Although Lyne et al. (1990) found the eclipse durations to be variable, the eclipses we observed in a given band were similar in length. Figure 1 shows that the rate of egress from the eclipse (around orbital phase 0.5) was significantly quicker than the rate of ingress (around orbital phase 1.0) for both 20 cm and 40 cm. We quantified this by approximating the engress and ingress as linear changes and measuring the phase interval between zero and maximum flux density (or vice versa). For the 20 cm band, the rate of egress is variable, with phase intervals of about 0.10 for two days (blue and green in Figure 1) and 0.20 for the other day (red). The rate of ingress was slower, but more stable with the interval for all days being close to 0.21. For 40 cm, only one egress and one ingress is measurable, with intervals of about 0.09 and 0.16, respectively. A similar pattern of slow ingress and more rapid egress is seen in other eclipsing systems, e.g., PSR B1975+20 (Ryba & Taylor, 1991).
3.2 Polarization profiles
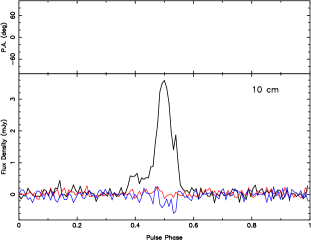
To measure the mean profile polarization in each band, we used the following procedure. We first measured the RM for every 3-minute profile. As will be discussed further in Section 3.3 below, we found that the RM was measurable only for profiles in the central part of the non-eclipsed phase at 20 cm and 40 cm. The RM was found to be stable throughout these central phase ranges and so we were able to sum those 3-minute profiles to form a high S/N profile for each band as shown in Figure 2. We then redetermined the RM using these summed profiles, obtaining values of 186.46.2 rad m-2 at 40 cm and 174.94.2 rad m-2 at 20 cm. These two values are consistent within their uncertainties. The weighted mean RM, 178.53.5 rad m-2, was used to make the plots shown in Figure 2.
It is evident that the pulse total intensity profiles evolve strongly across the three bands with a prominent leading component seen at 10 cm. The relative alignment of the profiles in pulse phase is somewhat uncertain, but the circular polarization profiles suggest that the main component at 10 cm aligns with the main component at the two lower bands. It is likely that some of the signal on the trailing edge of the 40 cm profile results from interstellar scattering (cf., Nice & Thorsett, 1992). Never-the-less, it appears that the leading part of the profile has a flatter spectrum than the trailing part.
We did not detect any linear polarization at any orbital phase for the 10 cm band, either using the 3-minute profiles or using the summation of all the observations. Since we see no evidence for an eclipse in this band, the low level of linear polarization at 10 cm or 3 GHz is likely to be intrinsic to the emission mechanism. For all three observing bands we measure significant circular polarization (shown with a blue line in the Figure) with a similar variation across the profile in all three bands, although at 10 cm the leading positive peak is barely significant.
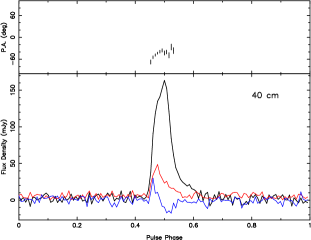
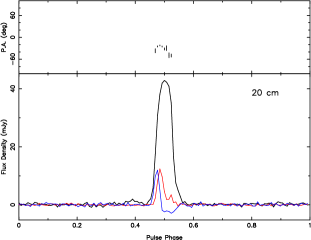
Since the position angles in Figure 2 are calibrated according to the IAU convention (van Straten et al., 2010) and the pulse profiles and PA variations across the 40 cm and 20 cm profiles are similar and relatively flat, we can use the weighted mean position angle difference between these bands to obtain an improved estimate of the RM. The derived value is 181.20.5 rad m-2. The small differences in the form of PA variations across the 40 cm and 20 cm profiles almost certainly are intrinsic to the pulse emission, but never-the-less result in a small variation in apparent RM across the profile. The quoted uncertainty on the mean RM includes the effect of this variation.
3.3 Depolarization
Figure 3 shows the variation of pulsed flux density, mean fractional linear polarization and RM as a function of orbital phase for the 40 cm and 20 cm bands. We can divide the orbit into three zones: a) when the pulse is fully eclipsed , b) when the pulse is detectable but unpolarized and c) when the pulse is detectable and significantly linearly polarized. As discussed above, we see no eclipse nor any significant linear polarization for the 10 cm-band data.
The well-known frequency dependence of the eclipse duration is evident from the bottom panels. The middle panels show that phase c), when significant linear polarization is detected, is concentrated in the middle of the un-eclipsed region and is of significantly shorter duration than the un-eclipsed phase. Consequently, there are zones of type b), that is, detectable pulses with no significant linear polarization, on either side of the type c) zone. The duration of zone c) is about 12 minutes (0.11 in phase) at 40 cm and 33 minutes (0.30 in phase) at 20 cm. Zone b) is wider on ingress to the eclipse (around phase 1.0) at both 20 cm and 40 cm, but has a total duration (sum of egress and ingress zones) that is similar for the two bands, about 40 minutes or 0.37 in phase.
We determine the RM variations shown in the top panel of Figure 3 by comparing the average position angle
| (1) |
of each 3-minute profile having significant linear polarization with the average position angle of the mean profile shown in Figure 2. The Stokes parameters in Equation 1 are averaged over the part of the pulse profile with significant . When the linear polarization is significant (zone c), the RM is relatively stable.
4 Discussion
4.1 Eclipse duration
The eclipse durations at 20 cm and 40 cm illustrated in Figures 1 and 3 are about 32% and 50% of the orbital period, consistent with previous results (Nice et al., 1990; Thorsett & Nice, 1991). These observed durations give a frequency dependence . This is consistent with the dependence derived by Nice et al. (1990). However, if we extrapolate this result to the 10 cm observing band then the eclipse duration would be about 0.18 of the orbital period or about 20 minutes. This would easily be detectable, but we do not see any evidence for such an eclipse. Our observing bands do not provide sufficient coverage to determine the frequency at which the eclipse becomes undetectable, but it certainly occurs between 1.6 GHz (Nice et al., 1990) and 2.6 GHz, the lower edge of our 10 cm band.
Although no eclipses are seen at 10 cm, Figure 1 shows considerable variability across all orbital phases in the observed flux density. The lack of dependence on orbital phase suggests that this variability is not related to the circumstellar gas. It is more likely to result from diffractive interstellar scintillation.
4.2 Depolarization mechanism
As Figure 3 shows, the pulsar pulse is depolarized around the boundaries of the eclipse, with the depolarization more pronounced in the 40 cm band compared to the 20 cm band. The most likely cause of this depolarization is multi-path propagation in the circumstellar magnetised plasma leading to rapid time variations in the RM, although the traversal of the line of sight through the circumstellar plasma due to orbital motion will also contribute. Such rapid RM variations can result from fluctuations in either or both of the circumstellar component of DM and the parallel component of the magnetic field. DM variations are observed at both eclipse ingress and egress, with those at egress generally more significant (Ryba & Taylor, 1991; Nice & Thorsett, 1992). However, these variations are typically cm-3 pc which will not significantly affect the RM. There is weak evidence for broadening of the mean pulse profiles at eclipse ingress or egress relative to the uneclipsed profile at the 10% level by ms, corresponding to a cm-3 pc. Consequently DM fluctuations are unlikely to be responsible for the depolarization. Therefore small-scale variations in the line-of-sight component of the magnetic field are the most likely cause of the depolarization, irrespective of whether the RM variations result from multi-path propagation or orbital motion of the line of sight. Such fluctuations would be expected in a turbulent stellar wind.
If the RM variations have a normal distribution with standard deviation , the variations in polarization position angle will also be normal with standard deviation . Averaging over this variation will reduce the linear polarization by a factor (see Appendix A).
As expected and as observed, the depolarization mechanism is more effective at longer wavelengths. If we assume that the depolarization is significant when , then depolarization will occur if is greater than 6 rad m-2 at 40 cm, 25 rad m-2 at 20 cm and 100 rad m-2 at 10 cm respectively. Figure 3 shows that, at orbital phases from about 0.55 and 0.67 and from 0.78 to 0.90 (when the pulsar – companion line is between and from the line of sight) the pulse is depolarized at 40 cm but not at 20 cm. Consequently at these orbital phases, must be between 6 rad m-2 and 25 rad m-2. The top panel of Figure 3 shows RM fluctuations of this order. For a fluctuating electron density of order cm-3 (Rasio et al., 1991) and a path length of order 1 , the implied magnetic field is of order 10 G which is plausible. More detailed modelling would require three-dimensional models of both the circumstellar plasma and the magnetic field structure.
5 Conclusions
Polarization observations of the eclipsing binary pulsar J17482446A, the first-discovered pulsar in the globular cluster Terzan 5, have been made in three bands using the Parkes 64-m radio telescope: 40 cm (centered at 728 MHz), 20 cm (1369 MHz) and, for the first time, at 10 cm (3100 MHz). Observations in the two lower-frequency bands show the well-known eclipses, but no eclipses are evident at 10 cm. Away from the eclipses, the two lower-frequency bands show significant linear and circular polarization, but at 10 cm, there is no detectable linear polarization. As the pulsar enters and leaves the eclipse, the linear polarization at 20 cm and 40 cm is quenched. We attribute this depolarization to short-timescale RM fluctuations caused by time-variable scattering and the resultant multi-path propagation in the circumstellar plasma, and to the changing propagation path due to orbital motion. An ultra-wide-bandwidth receiver, currently being commissioned at the Parkes radio telescope, will have increased sensitivity and frequency coverage compared to the current receivers. This new receiver will be ideal for carrying out further studies of this pulsar and the orbital dependence of its polarization.
Acknowledgments
Our initial observations were based on a timing model for PSR J17482446A provided by S. M. Ransom and obtained using the Green Bank radio telescope. XPY is supported by the National Natural Science Foundation of China (U1231120, 11573008) and the Fundamental Research Funds for the Central Universities (XDJK2015B012). GH is supported by an Australian Research Council Future Fellowship grant. The data presented in this paper were obtained by the Parkes radio telescope, which is part of the Australia Telescope which is funded by the Commonwealth of Australia for operation as a National Facility managed by CSIRO.
References
- Bilous (2012) Bilous, A. 2012, PhD thesis, University of Virginia
- Born & Wolf (1970) Born, M. & Wolf, E. 1970, Principles of Optics, Cambridge Press
- Eichler (1991) Eichler, D. 1991, ApJ, 370, L27
- Fruchter & Goss (1992) Fruchter, A. S. & Goss, W. M. 1992, ApJ, 384, L47
- Hotan et al. (2004) Hotan, A. W., van Straten, W., & Manchester, R. N. 2004, PASA, 21, 302
- Luo & Melrose (1995) Luo, Q. & Melrose, D. M. 1995, ApJ, 452, 346
- Lyne et al. (1990) Lyne, A. G., Manchester, R. N., D’Amico, N., Staveley-Smith, L., Johnston, S., Lim, J., Fruchter, A. S., Goss, W. M., & Frail, D. 1990, Nature, 347, 650
- Nice & Thorsett (1992) Nice, D. J. & Thorsett, S. E. 1992, ApJ, 397, 249
- Nice et al. (1990) Nice, D. J., Thorsett, S. E., Taylor, J. H., & Fruchter, A. S. 1990, ApJ, 361, L61
- Papoulis, A. (1991) Papoulis, A. 1991, Probability, Random Variables, and Stochastic Processes, McGraw Hill
- Phinney et al. (1988) Phinney, E. S., Evans, C. R., Blandford, R. D., & Kulkarni, S. R. 1988, Nature, 333, 832
- Rasio et al. (1989) Rasio, F. A., Shapiro, S. L., & Teukolsky, S. A. 1989, ApJ, 342, 934
- Rasio et al. (1991) —. 1991, A&A, 241, L25
- Roberts (2013) Roberts, M. S. E. 2013, in IAU Symposium, Vol. 291, Neutron Stars and Pulsars: Challenges and Opportunities after 80 years, ed. J. van Leeuwen, 127–132
- Ryba & Taylor (1991) Ryba, M. F. & Taylor, J. H. 1991, ApJ, 380, 557
- Thompson et al. (1994) Thompson, C., Blandford, R. D., Evans, C. R., & Phinney, E. S. 1994, ApJ, 422, 304
- Thorsett & Nice (1991) Thorsett, S. E. & Nice, D. J. 1991, Nature, 353, 731
- van Straten (2004) van Straten, W. 2004, ApJS, 152, 129
- van Straten & Bailes (2011) van Straten, W. & Bailes, M. 2011, PASA, 28, 1
- van Straten et al. (2010) van Straten, W., Manchester, R. N., Johnston, S., & Reynolds, J. E. 2010, PASA, 27, 104
- Wasserman & Cordes (1988) Wasserman, I. & Cordes, J. M. 1988, ApJ, 333, L91
Appendix A Derivation of depolarization factor
Any partial coherence such as depolarization or reduction in visibility of an interferometer, requires both finite bandwidth and finite integration time (Born & Wolf, 1970). Partial polarization can be described by coherency matrix where the 2-vector components are any two orthogonal polarizations. Here we take a linear basis. We then consider the effect of multi-path propagation on a unit amplitude wave polarized in the x direction. The different paths have different Faraday rotation angle . Then becomes
| (A1) |
We assume to be a zero mean gaussian random variable and take the expectation of over paths, thus explicitly over and implicitly over time. The expectations of the off diagonal terms and are zero as has an even distribution. The diagonal terms can be written
| (A2) |
can be written as the sum of an unpolarized component and a linearly polarized x-component where
| (A3) |
Thus the amplitude of the linear polarized component has been reduced from 1.0 to
| (A4) |
where the latter equality is applicable for normal random processes (Papoulis, A., 1991).