Dynamics of cardiac re-entry in micro-CT and serial histological sections based models of mammalian hearts
Abstract
1
Cardiac re-entry regime of self-organised abnormal synchronisation and transition to chaos underlie dangerous arrhythmias and fatal fibrillation. Recent advances in the theory of dissipative vortices, experimental studies, and anatomically realistic computer simulations, elucidated the role and importance of cardiac re-entry anatomy induced drift and interaction with fine anatomical features of the heart. The fact that anatomy of the heart is consistent within a species suggested a possible functional effect of the heart anatomy and structural anisotropy on spontaneous drift of cardiac re-entry. A comparative study insight into the anatomy induced drift could be used e.g. to predict, given a specific atrial anatomy, atrial arrhythmia evolution, in order to ultimately improve low-voltage defibrillation protocols and/or ablation strategies.
In this paper, in micro-CT based model of rat pulmonary vein wall, and in sheep atria models based on high resolution serial histological sections, we demonstrate effects of heart geometry and anisotropy on cardiac re-entry anatomy induced drift, and pinning to sharp fluctuations of thickness in the tissue layer. The data sets of sheep atria and rat pulmonary vein wall are incorporated into the BeatBox High Performance Computing simulation environment for anatomically realistic computer simulations. Cardiac re-entry is initiated at prescribed locations in the spatially homogeneous mono-domain micro-CT and serial histological sections based models of cardiac tissue. Excitation is described by simplified FitzHugh-Nagumo kinetics. In the in-silico models, isotropic and anisotropic conduction show specific anatomy effects and the interplay between anatomy and anisotropy of the heart. The main objectives are to demonstrate the functional role of the species hearts geometry and anisotropy in the anatomy induced drift of cardiac re-entry. In case of the particular region of the rat pulmonary vein wall with transmural fiber rotation, it is shown that the joint effect of the PV wall geometry and anisotropy can turn a plane excitation wave into a re-entry pinned to a small fluctuation of thickness in the wall.
2 Keywords:
cardiac arrhythmias, anatomically realistic modelling, anisotropy, anatomy induced drift, FitzHugh-Nagumo model
3 Introduction
Cardiac re-entry regime of self-organisation and transition to chaos underly dangerous arrhythmias and fatal fibrillation (Mines, 1913; Garey, 1914; Allessie et al., 1973; Pertsov et al., 1993; Christoph et al., 2018). Tissue and whole organ experiments showed that cardiac arrhythmias are caused by a combination of electrophysiological (Bosch and Nattel, 2002; Workman et al., 2008; Kushiyama et al., 2016), structural (Pellman et al., 2010; Eckstein et al., 2011; Takemoto et al., 2012; Eckstein et al., 2013), and anatomical (MacEdo et al., 2010; Anselmino et al., 2011) factors, which sustain cardiac re-entry (Gray et al., 1996; Wu et al., 1998; Nattel, 2002; Yamazaki et al., 2012). That is why, for many decades, cardiac re-entry, its origin and a possibility of smooth control and defibrillation, have seen extensive mathematical study and computer modelling (Wiener and Rosenblueth, 1946; Balakhovsky, 1965; Krinsky, 1968; Panfilov et al., 1984; Davydov et al., 1988; Keener, 1988; Ermakova et al., 1989; Biktashev and Holden, 1994; Biktashev, 1998; Fenton and Karma, 1998; Pertsov et al., 2000; Wellner et al., 2002; Biktasheva and Biktashev, 2003; Biktashev et al., 2010, 2011; Biktasheva et al., 2015, 2018).
Cardiac myocyte orientation mapping in mammalian hearts showed that transmural fiber arrangement is consistent within a species, and varied between species, including the range of transmural change of fiber angle in ventricular wall (Hunter et al., 1997, p. 173), which therefore could have a functional role in dynamics and evolutionary control of cardiac arrhythmias (Bishop et al., 2010, 2011; Bishop and Plank, 2012; Fukumoto et al., 2016), also studied in simplified mathematical and computer models (Fenton and Karma, 1998; Pertsov et al., 2000; Wellner et al., 2002; Spach, 2001; Smaill et al., 2004; Rodriguez et al., 2006; Dierckx et al., 2013). On the other hand, the recent discovery of the new phenomenon of dissipative vortices interaction with small variations of thickness in the layer (Biktasheva et al., 2015; Ke et al., 2015) clarified the possible effect of fine anatomical structures in the heart, such as e.g. Pectinate Muscles (PM), on the anatomy induced drift of cardiac re-entry (Wu et al., 1998; Yamazaki et al., 2012; Kharche et al., 2015a).
With the recent advance in High Performance Computing (HPC), it has become possible for high resolution DT-MRI, serial histological sections, and micro-CT data sets, containing both detail heart anatomy and myofiber structure, to be directly incorporated into the computationally demanding complete anatomy realistic computer simulations (Vigmond et al., 2009; Bishop et al., 2010; Kharche et al., 2015b, a; Antonioletti et al., 2017; Biktasheva et al., 2018), in order to see in the in-silico models the specific anatomy effects on cardiac re-entry, as well as the role of the interplay between the anatomy of the heart and its structured anisotropy.
In this paper, we present an anatomy and myofiber structure realistic computer simulation study of cardiac re-entry dynamics in sheep atria models based on serial histological sections data sets, and in rat pulmonary vein wall model based on micro-CT data sets. The main objectives are to demonstrate: i) the functional role of geometry and structured anisotropy of the heart for the anatomy induced drift of cardiac re-entry; ii) that the anatomical settings of the isolated sheep atria, and that of a rat pulmonary vein wall, might support a positive filament tension re-entry; iii) for the particular region of rat pulmonary vein wall with transmural fiber rotation, it is shown that the combination of geometry and anisotropy can turn a plane excitation wave into a cardiac re-entry pinned to a small fluctuation of the wall thickness.
We demonstrate that, in the sheep atria, positive filament tension re-entry might pin to Bachman’s bundle and to pectinate muscles, which would sustain the re-entry. In rat pulmonary vein wall, where the transmural fiber direction change of seems to be a salient feature of the wall anatomy, an otherwise stable isotropic micro anatomic reentry might produce qualitatively different endocardial and epicardial manifestation, so that the micro anatomic reentry clearly seen on the endocardium might appear as a focal point on the epicardium. The same region of the rat pulmonary vein with transmural fiber rotation can turn a plane excitation wave into a cardiac re-entry pinned to a nearby small fluctuation of the wall thickness.
The main significance of our initial findings is that the computationally demanding high resolution serial histological sections and micro-CT data sets can be directly incorporated into the complete anatomy and anisotropy realistic HPC computer simulations, and thus serve a model for intra- and inter-species comparative in-silico study of cardiac re-entry dynamics in mammalian hearts.
4 Materials and Methods
4.1 Anatomy Data Sets
4.1.1 Sheep Atrial Serial Section Histology Data Set
Atria from a crossbred sheep were extracted and processed. The tissue was fixed in formalin, and a graded series of ethanol was used for dehydration. Then the specimen was embedded in paraffin wax. Tissue architecture throughout the atria was reconstructed using the extended volume surface imaging modality. The images were acquired at a resolution of per pixel after staining the tissue surface using Toludine blue. After acquiring each image, the upper surface of tissue was milled off with an ultramiller. Atrial surface images from top to bottom were acquired at every steps by following this approach of milling, staining and imaging. The resulting tissue volume was segmented using a custom-designed suite of image processing tools. The segmented 2D sections were down-sampled to produce an isotropic volume of voxels. Fiber orientation field over this geometry was defined using structure tensor approach. More detailed accounts on tissue processing, image acquisition, image processing and fibre field computation steps can be found elsewhere (Zhao et al., 2012; Gerneke et al., 2007).
4.1.2 Sheep Atrial Serial Section Histology based anatomy model
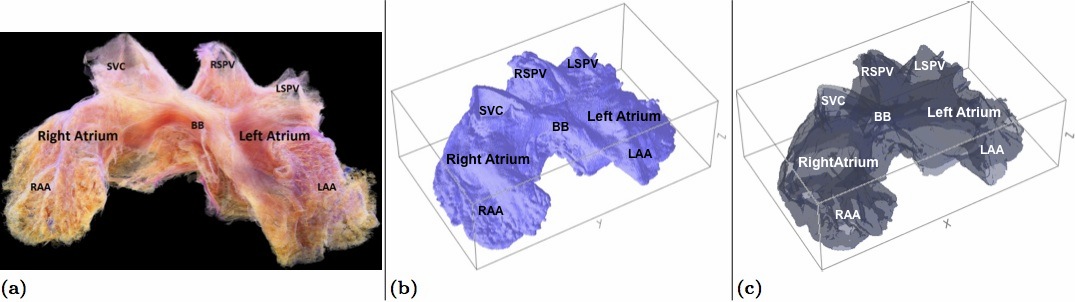
Figure 1(a) shows the sheep atrial serial section histology based model of the voxels size, with resolution of . The serial section histology model was converted into the BeatBox (Antonioletti et al., 2017) regular Cartesian mesh .bbg geometry format, also shown in Figure 1(b), containing the coordinates of the atria tissue points together with the local fibre orientation (Antonioletti et al., 2017). Following (Antonioletti et al., 2017), a .bbg file is a csv ASCII file describing tissue points in the regular mesh, one tissue point per line in the format:
| x,y,z,status,fibre_x,fibre_y,fibre_z |
where x, y, z are integer Cartesian coordinates of a voxel, status is a flag with a nonzero-value for a tissue point, and fibre_x, fibre_y, fibre_z are -, - and -components of the fibre orientation vector at that point. Only tissue points with nonzero status need to be specified. The minimal bounding box for sheep atria model is voxels size, and contains 25,124,362 tissue (non-void) points.
From the original sheep atrial serial section histology model shown in Figure 1(a), we also made the sheep atria anatomy model down-sampled three times in each of the x,y,z dimensions, contained in a box of voxels, resolution , shown in Figure 1(c). The down-sampled sheep atria model contained 932,374 tissue points.
4.1.3 Rat Pulmonary Vein Wall micro-CT Data Set
Hearts from Wistar rats were excised after thoracotomy of the anaesthetised animal. The aorta was cannulated and flushed with ice cold saline solution. The pulmonary veins and vena cavae were ligated and liquid agar was injected into the chambers to keep the atria in an “inflated” state. The agar was allowed to set and the tissue was fixed in 4% paraformaldehyde for 48 hours at 4°C. After fixation, excess fat and connective tissue was dissected from the epicardium. And the atria were then transected at the atrioventricular annulus and isolated from the ventricles.
The tissue was then dehydrated by immersion in aqueous ethanol in a graded series (30% to 70% at 10% intervals) and stained for 48 hours with a solution of 3% phosphomolybdic acid in 70% aqueous ethanol. The agar was removed from the tissue, which was then washed and blotted to remove excess stain. The sample was fitted into a polypropylene tube and secured using pieces of polystyrene cut to fit the tube and mounted onto the stage of the micro-ct (Skyscan 1272, Bruker, Kontich, Belgium). Single images were initially taken and compared at 15-minute intervals to assess sample shrinkage due to dehydration. After the stabilisation period, imaging parameters were optimised to obtain satisfactory tissue-air contrast. The resulting voxel resolution was , and scans were performed at intervals. A Aluminium filter was used to block low energy x-rays during the scan.
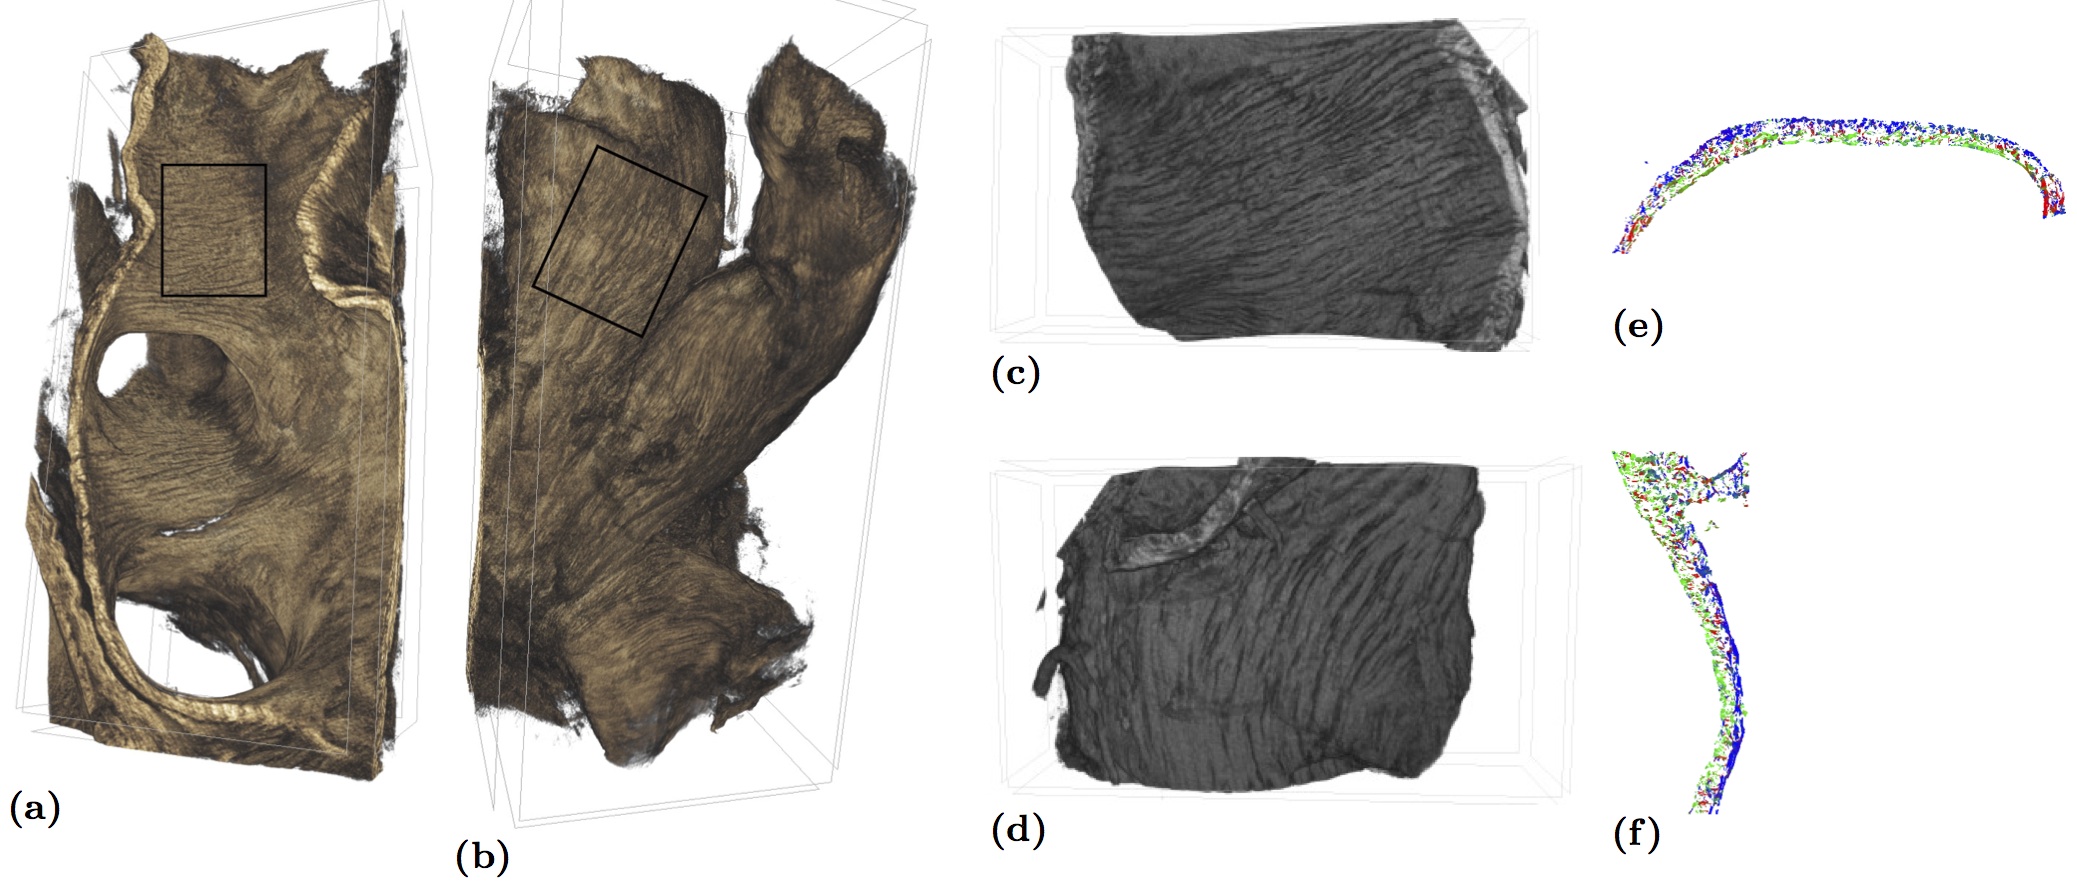
3D Reconstruction ( Figure 2(a-d)) was performed using the provided software (InstaRecon, Bruker, Kontich, Belgium) using the recommended settings. The images were then processed and cropped using a custom made GUI based on ITK (Yoo et al., 2002) and VTK (Schroeder et al., 2006) libraries written in c++. Images were “resliced” in 3D in order to align the axes with the orientation of the fibres. The structure tensor analysis algorithm (Zhao et al., 2012) was used to assign a 3D direction to each voxel representing a fibre.
4.1.4 Rat Pulmonary Vein Wall micro-CT based model
Figure 2(c,d) shows the endocardial and epicardial views of the rat pulmonary vein wall micro-CT model of the voxels size, with resolution of . The micro-CT model was converted into the BeatBox (Antonioletti et al., 2017) regular Cartesian mesh .bbg geometry format, containing the coordinates of the PV wall tissue points together with the local fibre orientation (Antonioletti et al., 2017). The minimal bounding box of the rat PV wall anatomy model is grid size, and containes 230,355,342 tissue points.
Figure 2(e,f) panels show color coded fibre orientation in the horisontal and veritical middle cross sections of the rat PV wall. Here, the rgb color coding scheme was chosen so that red represents z component of the local fiber orientation vector, green represents x component of the local fiber orientation vector, and blue represents y component of the local fiber orientation vector. In full accordance with the original images fibre orientation alignment along the axes, as described in the previous section 4.1.3, it can be seen in Figure 2(e,f) that the fiber orientation at the epicardum side of the wall is predominantly blue, that is aligned along the y axis, while the endocardium fiber orientation of the rat PV wall is predominantely green, that is the fibres at the inner side of the PV wall are aligned along the x axis, that is there is transmural change in fibre orientation in the rat PV wall.
4.2 Tissue model
Similar to our previous paper (Biktasheva et al., 2018), all the three (“complete” and “down-sampled” sheep atria shown in Figure 1(b,c), and the rat PV wall shown in Figure 2(c,d)) data sets were used to implement corresponding monodomain tissue models with non-flux boundary conditions
| (1) | |||
Here , is the position vector, is the FitzHugh-Nagumo (Winfree, 1991) kinetics column-vector
| (2) |
with the kinetics parameters , , , which in perfectly homogeneous infinite medium correspond to a rigidly rotating vortex with positive filament tension (Biktashev et al., 1994). The specific forces generated by anisotropy (Wellner et al., 2002; Dierckx et al., 2015; Biktasheva et al., 2018) and by small fuctuations of thickness in the layer (Biktasheva et al., 2015; Kharche et al., 2015a) are only two types out of a variety of specific forces acting on cardiac re-entry in the heart (Biktashev et al., 2011). For this study, we have intentionally chosen the simplified FHN model with the parameters corresponding to the simplest possible rigidly rotating positive filament tension re-entry, in order to eliminate effects of e.g. meander (Winfree, 1991), alternans (Karma, 1994), negative filament tension (Biktashev et al., 1994), etc., and enhance and highlight pure effects of the tissue geometry and anisotropy on the cardiac re-entry dynamics. The diffusion matrix tensor is defined as , where is the matrix of the relative diffusion coefficients for and components, and is the component diffusion tensor, which has only two different eigenvalues: the bigger, simple eigenvalue corresponding to the direction along the tissue fibers, and the smaller, double eigenvalue , corresponding to the directions across the fibres, so that
| (3) |
where is the unit vector of the fibre direction; is the vector normal to the tissue boundary . In the isotropic simulation, and values were fixed at (corresponding 1D conduction velocity 1.89, in the dimensionless units of Eqs. (1)-(2)). In the anisotropic simulations, and values were fixed at , (corresponding conduction velocities 2.68 and 1.34 respectively). All the conduction velocities have been computed for plane periodic waves with the frequency of the free spiral wave in the model, i.e. 11.36. With the isotropic diffusivity () equal to the geometric mean between the faster and the slower anisotropic diffusivities (), the isotropic conduction velocity 1.89 was almost exactly the same as the geometric mean of the faster and slower (2.68 and 1.34 respectively) anisotropic conduction velocities, chosen in order to minimize the maximal relative difference between the isotropic and anisotropic propagation speeds.
All the computer simulations presented here were done using the BeatBox (Antonioletti et al., 2017) software package with the explicit time-step Euler scheme on Cartesian regular grid, 7-point stencil Laplacian approximation for isotropic simulations, 27-point stencil for anisotropic Laplacian approximation. In most simulations, unless specified otherwise, re-entry was initiated by the phase distribution method (Biktashev and Holden, 1998) at prescribed locations of the respected three (“complete” and “down sampled” sheep atria, and the rat PV wall) anatomy models described above.
The space and time discretization steps listed in Table 1 were chosen for each tissue model in order to ensure computational stability of the BeatBox (Antonioletti et al., 2017) explicit time-step forward Euler scheme. Both the time step and the space step are given in the dimensionless units of equations (1)–(2). Note that the “physiological” space scale is recovered by noting that corresponds to the voxel size of the corresponding grid as described in Section 4.1.
| Geometry | (an)isotropy | Figures | ||
|---|---|---|---|---|
| Sheep atria “down-sampled” | isotropic | 1(c), 3(a–c) | ||
| Sheep atria “complete” | isotropic | 1(b), 4, 5, 6(a,b) | ||
| Sheep atria “complete” | anisotropic | 1(b), 3(d), 4, 5, 6(a,c) | ||
| Rat PV wall | isotropic | 2(c,d), 7–10 | ||
| Rat PV wall | anisotropic | 2(c,d), 11 |
5 Results
5.1 Sheep Atria model
5.1.1 Down-Sampled Isotropic Sheep Atria model
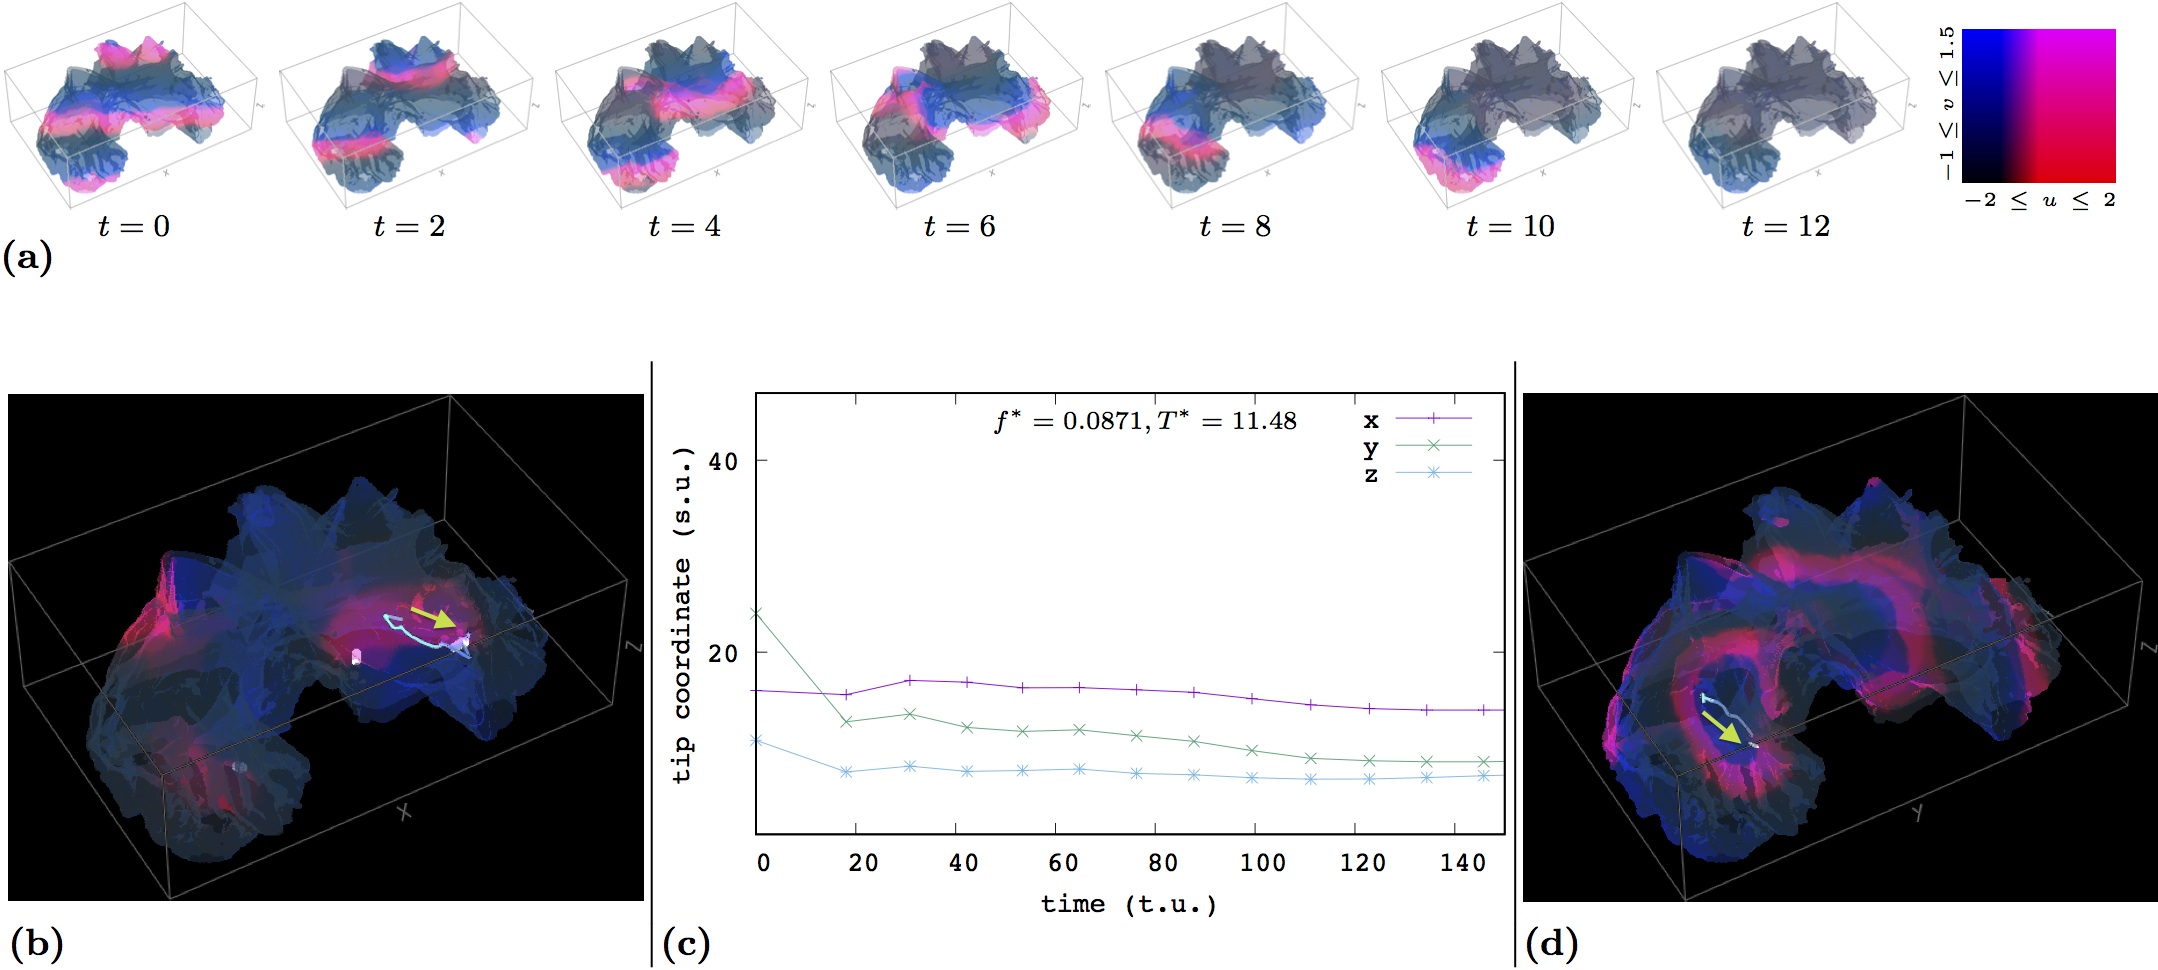
For the sake of a basic test of whether a plane excitation wave propagates through the isotropic sheep atria geometry, a plane excitation wave was initiated in the down-sampled isotropic sheep atria model (Figure 1(c)), in the left atrium just below the right (RSPV) and left (LSPV) Superior Pulmonary Veins, see Figure 3(a), panel . The plane wave propagated through the isotropic atria, and terminated in the Right Atrial Appendage (RAA), as shown in Figure 3(a).
Figure 3(b), shows the anatomy induced drift of a clockwise excitation re-entry initiated by the phase distribution method (Biktashev and Holden, 1998) in the down-sampled isotropic sheep atria model shown in Figure 1(c), with the initial position of the transmural filament at the entrance to the Left Atrial Appendage (LAA). In Figure 3(b), the re-entry is shown at its final position pinned to a pectinate muscle fluctuation of thickness in the LAA. The re-entry’s initial and the final transmural filaments are shown in white; the trajectory of the drifting filament is shown as thin blue line; the green arrow shows direction of the drift. The filament of a secondary anatomical (not drifting) re-entry can also be seen close to the Bachmann bundle (BB). Figure 3(c) shows the time course of the coordinates of the drifting filament’s epicardium end, from its initial position to the pinning point. The dominant frequency and the dominant period of the drifting re-entry are shown at the top of Figure 3(c). From the drift trajectory in Figure 3(b), and the time course of coordinates of the epicardial end of the drifting filament shown in Figure 3(c), it can be seen that the re-entry’s initial transient followed the Pectinate Muscles (PM) structures into the LAA, until the re-entry’s final pinning in the LAA.
5.1.2 “Complete” Sheep Atria model
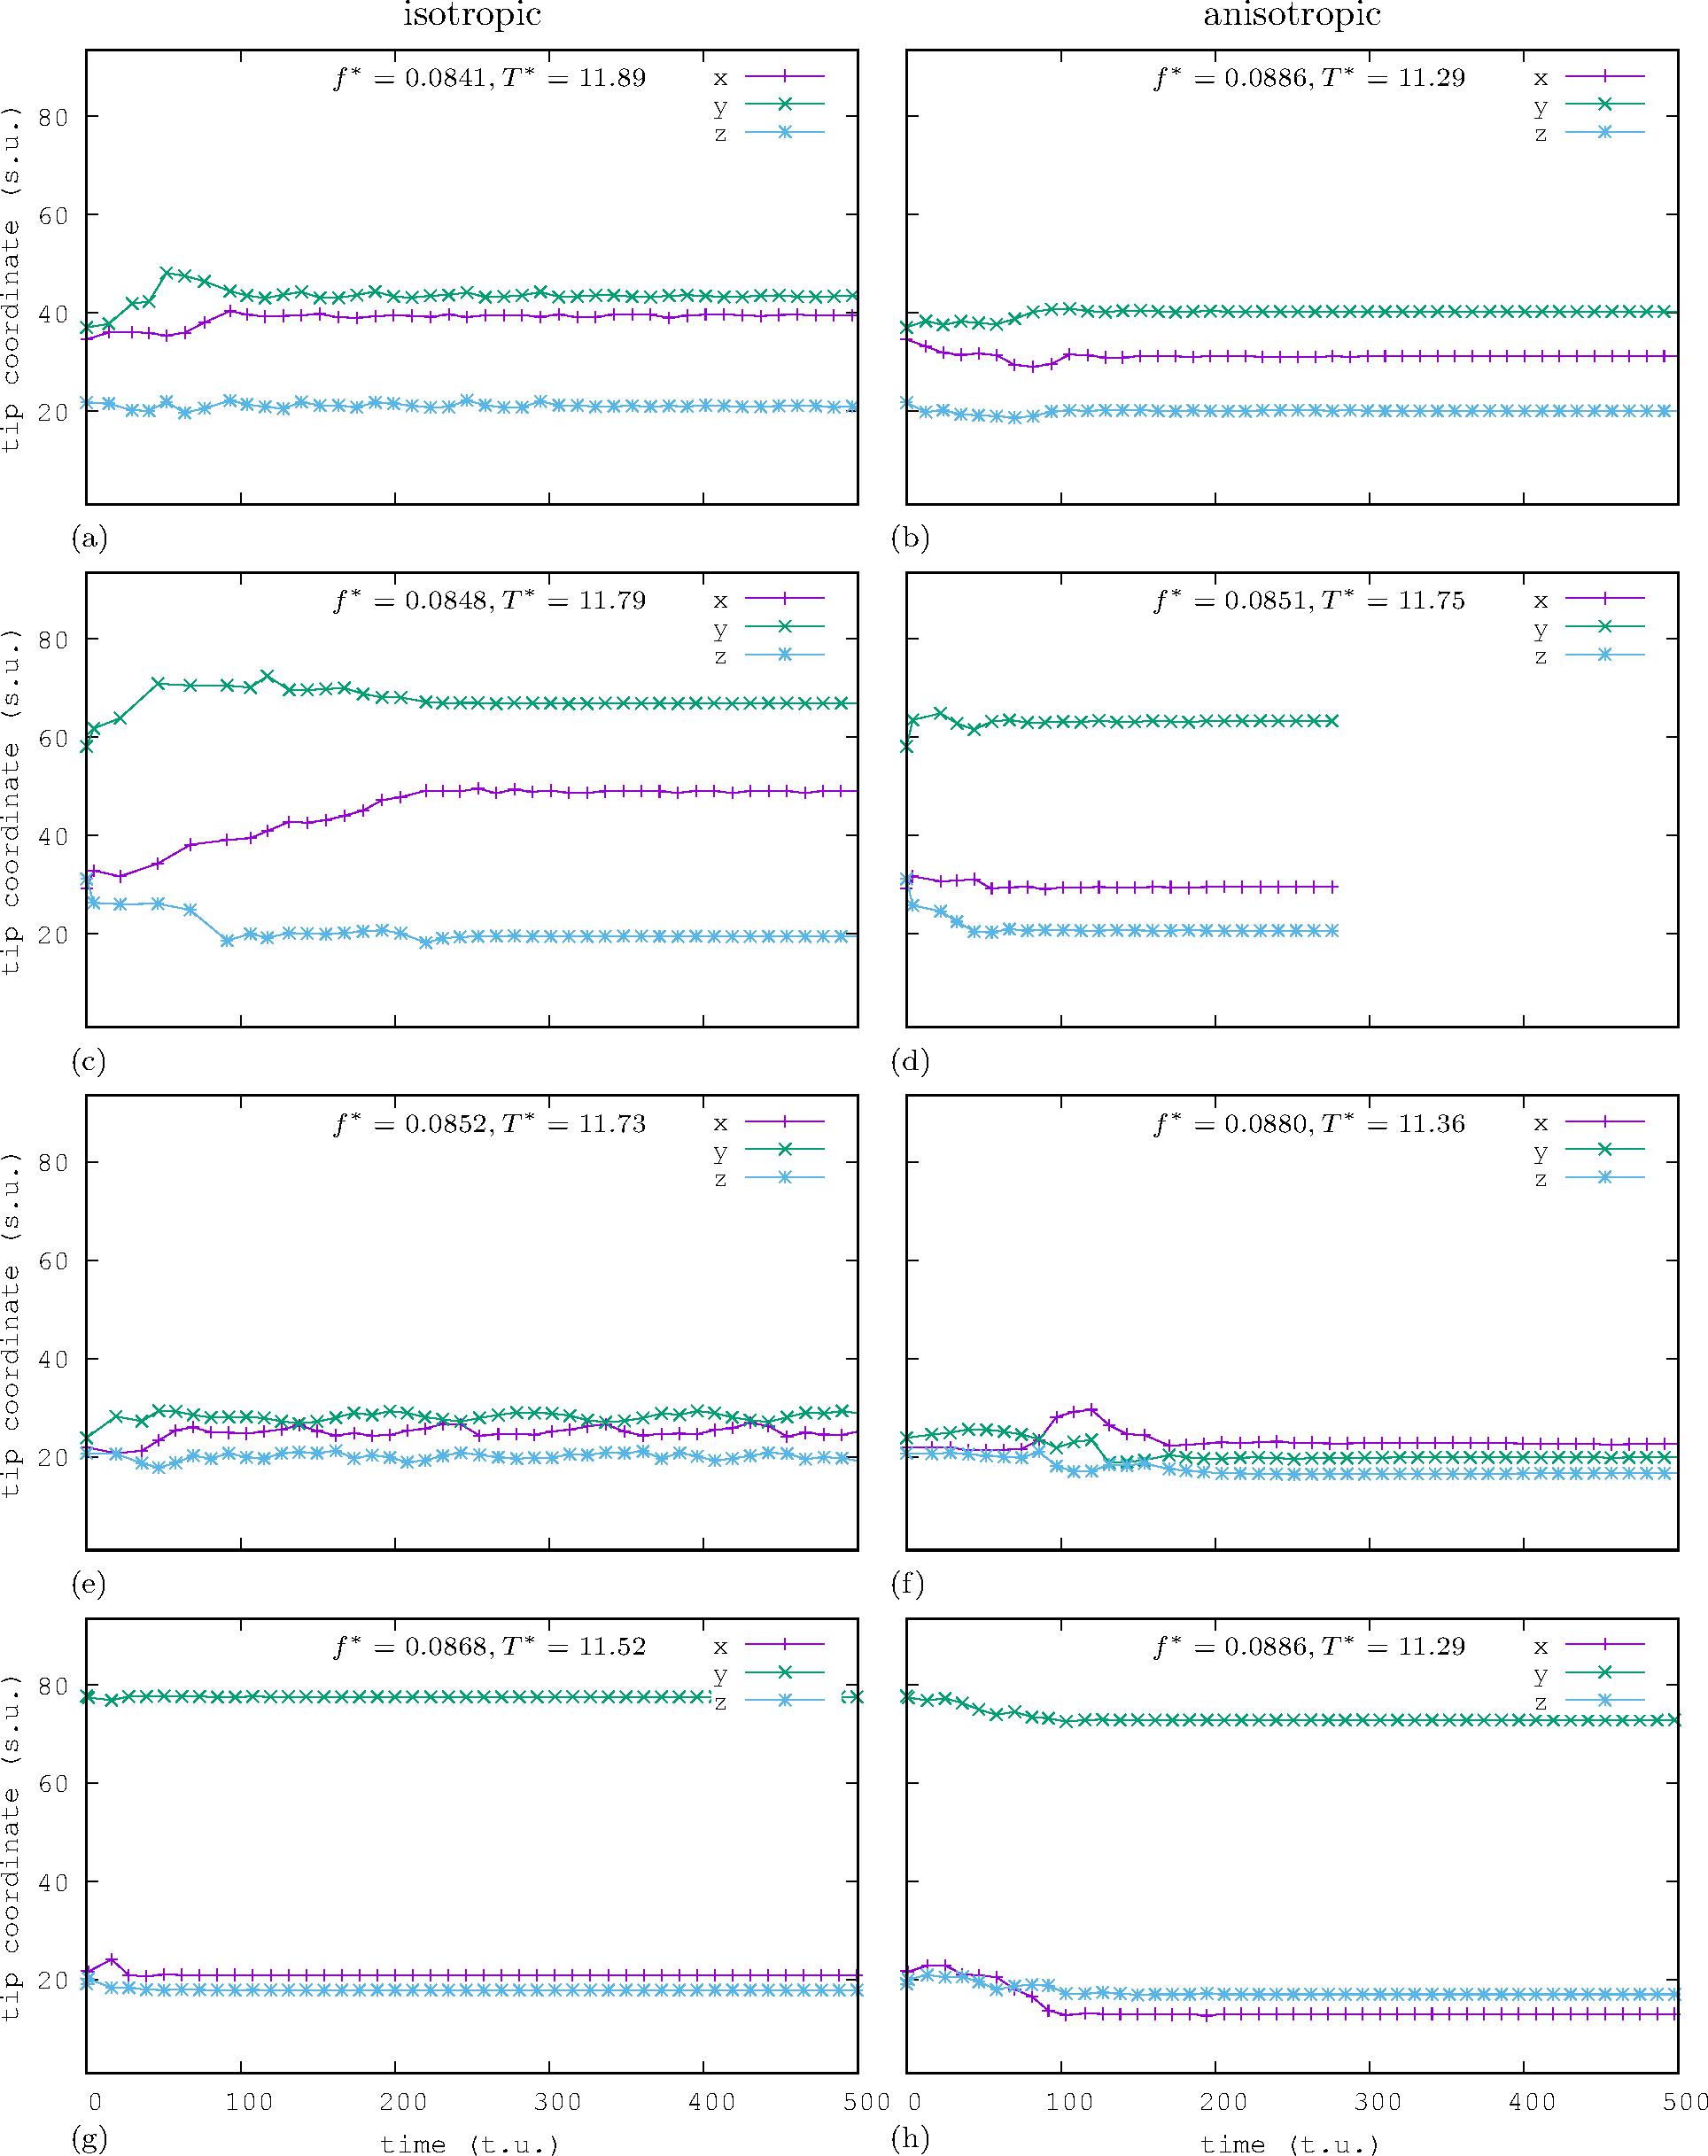
Figure 3(d) shows the anatomy induced drift of re-entry initiated at the entrance to the Right Atrium in the “complete” anisotropic sheep atria model shown in Figure 1(b). In Figure 3(d), the re-entry is shown at its final position pinned to a fluctuation of thickness of a pectinate muscle in the RAA. The re-entry’s initial and the final transmural filaments are shown in white; the trajectory of the drifting filament is shown as thin blue line; the green arrow shows direction of the drift. The time course of coordinates of the drifting filament’s epicardium end is shown in Figure 5(h). The dominant frequency and period of the drifting re-entry are shown at the top of Figure 5(h). Note that the anisotropic drift trajectory of the re-entry shown here in Figure 3(d) is also shown as “trajectory (h)” in the collective phase portrate of drift trajectories in Figure 4.
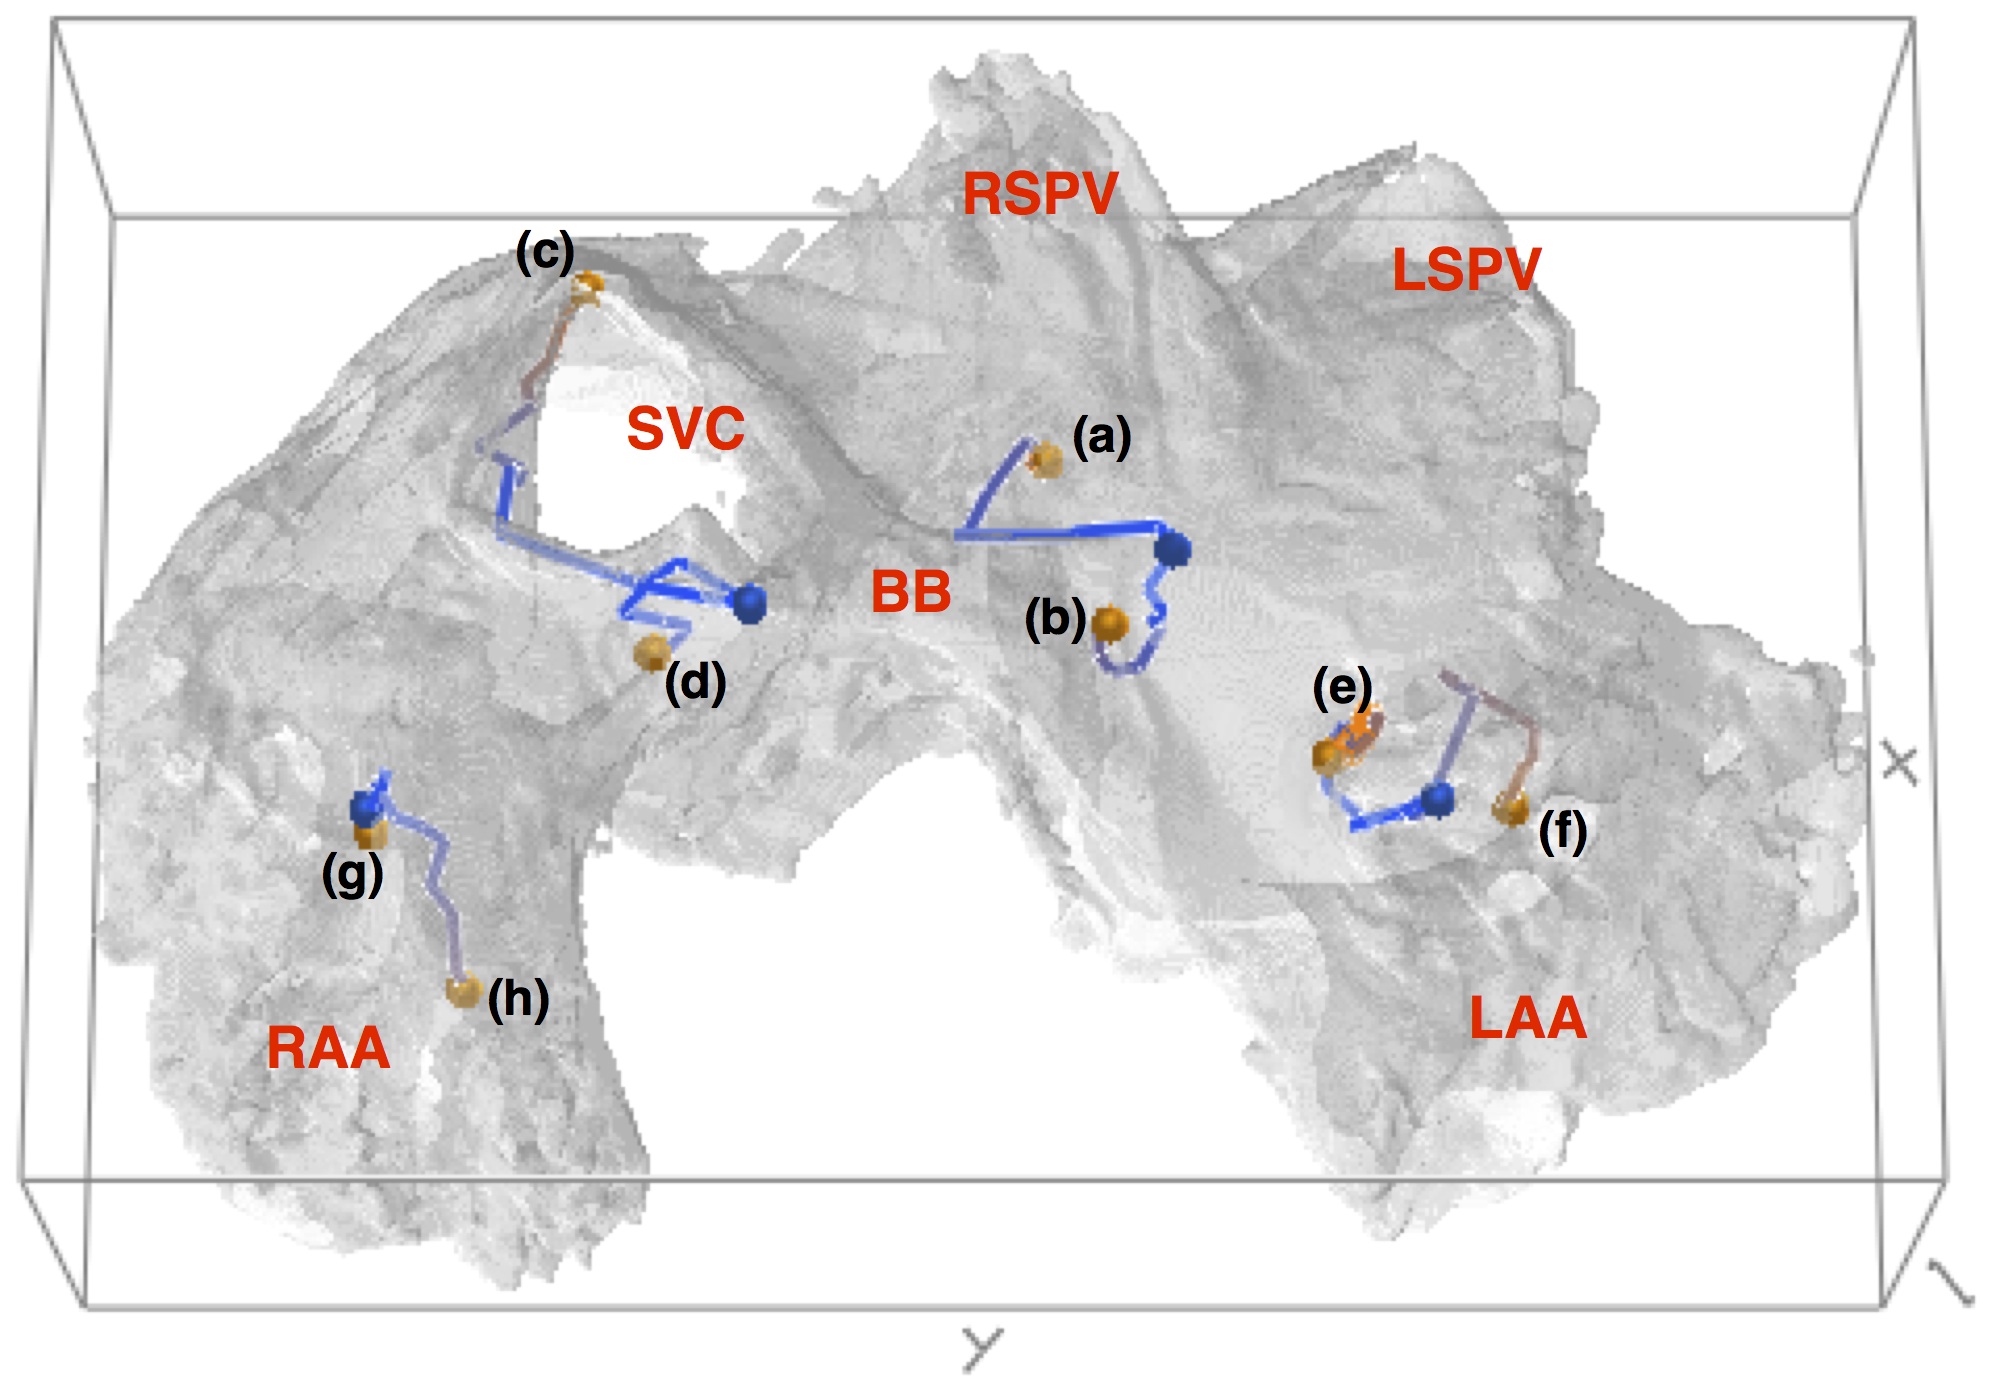
Figure 4 shows a set of pairs of “isotropic” and corresponding “anisotropic” drift trajectories. Each pair of simulations started from identical initial conditions at different locations in the “complete” model of sheep atria shown in Figure 1(b). In Figure 4, the initial locations of the re-entries are shown as blue dots, the final pinning locations are shown as orange dots. Drift trajectories are shown as lines of changing color from blue in the beginning of a trajectory to orange in the end of a trajectory. Letters in the brackets next to the each trajectory pinning point in Figure 4 correspond to the panels labelling in Figure 5, which shows the time courses of coordinates of the drifting filaments’ epicardium ends. The dominant frequencies and dominant periods of the drifting re-entries are also shown at the top of each corresponding panel in Figure 5. The panels in Figure 5 are arranged in the way that the left column panels show isotropic drift, and the right column panels show anisotropic drift. Each horisontal pair of panels in Figure 5 presents a pair of isotropic and corresponding anisotropic trajectories starting from the same initial position.
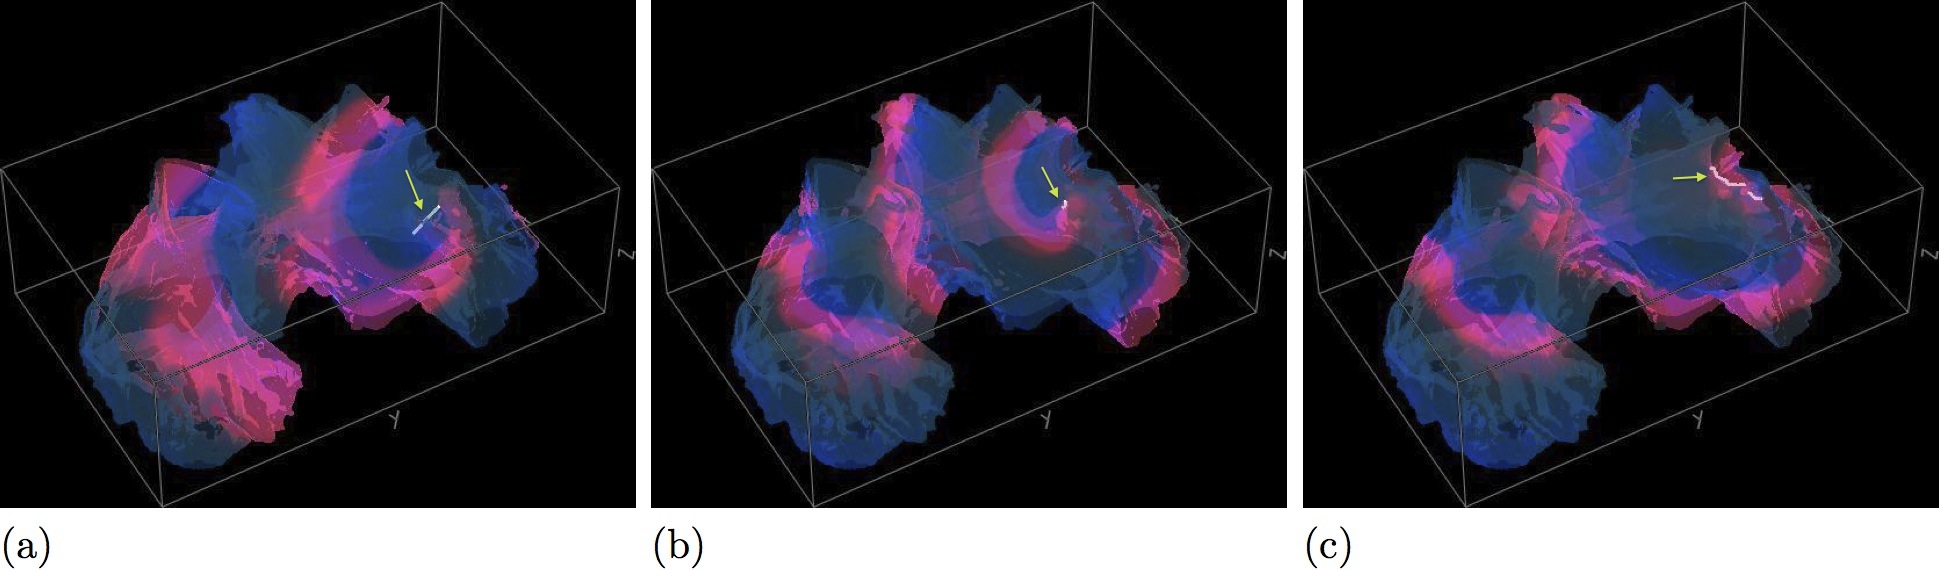
Figure 6 shows a particularly interesting case of the re-entry initiated in the Right Atrium, as in this case isotropic vs anisotropic conductance result not only in different drift trajectories “(e)” (iso) and “(f)” (aniso) shown in Figure 4 and in Figure 5(e-f), but also in very different lengths and orientation of the final pinned filaments shown here in Figure 6(b) and Figure 6(c). Starting from the same initial conditions transmural filament shown in Figure 6(a), after 11 rotations in the isotropic “complete” model of the sheep atria (Figure 1(b)), the filament becomes a very short perfectly transmural filament shown in Figure 6(b). While, after the same number of 11 rotations in the same very thin but “anisotropy on” sheep atria, the filament seen here in Figure 6(c) becomes intramural, i.e. stretches almost parallel to the epicardial surface. Note that theory predicts strong effects of the anisotropy on the dynamics of singular filaments, e.g. (Wellner et al., 2002), which must act in addition to purely geometric forces. The dominant frequencies and the dominant periods of the pair of isotropic and anisotropic re-entries are also shown in Figure 5(e) (iso) and Figure 5(f) (aniso) correspondingly.
5.2 Rat Pulmonary Vein Wall model
The described in Section 4.1.3 high subcellular resolution rat PV wall micro-CT data set produces quite a “granular” PV wall tissue model, see Figure 2(e,f). So, same as with the sheep atria model in Section 5.1, in order for a basic test of whether a plane excitation wave propagates through the granular isotropic PV wall tissue model, a plane excitation wave was initiated in the PV wall tissue model (Figure 2(c,d)), in two perpendicular directions: “bottom-up” and “side-to-side”.
Figure 7(a) shows epicardial and endocardial view of the plane excitation wave propagating through the isotropic PV wall tissue model from the left to the right (in the endocardial view), which proves the connectivity of the tissue model and its ability to support an excitation wave. An unexpected effect is that the plane excitation wave’s interaction with the PV wall anatomy generates a re-entry pinned to a thickness cusp in the bottom left (in the endocardial view, see also Figure 2(c)) conner of the PV wall, see the panels , , and in Figure 7(a), and (Multimedia view) Fig7a-rev.mpg.
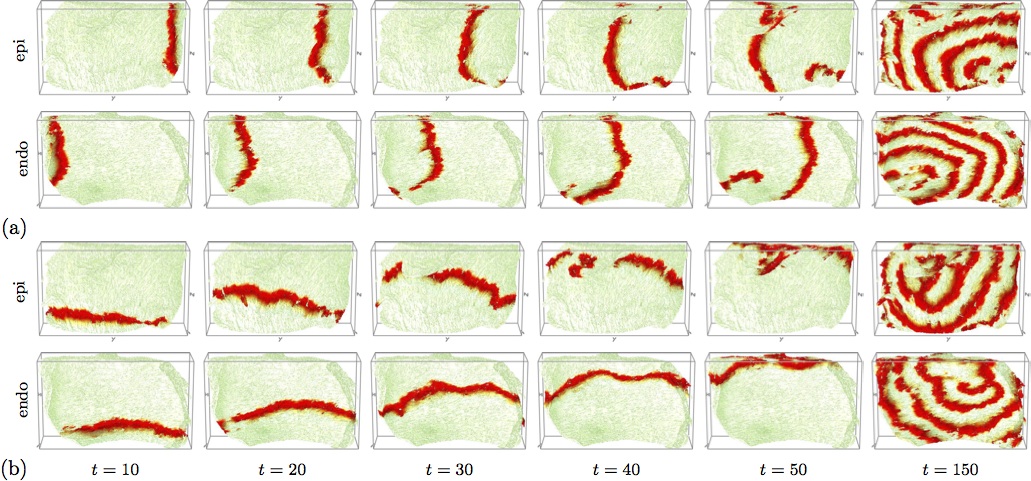
Figure 7(b) shows epicardial and endocardial views of the plane excitation wave propagating through the isotropic PV wall tissue model from the bottom up of the PV wall. Interaction of the plane excitation wave with the epicardial piece of tissue in the form of a “handle” in the top left conner of the PV wall (see also Figure 2(d,f)) results in the break of the plane wave, which can be seen in the epicardial, but not in the endocardial view panels and in Figure 7(b). The epicardial panel in Figure 7(b) shows an ectopic bit going through the epicardial “handle” piece of the tissue, while on the endocardial side of the PV wall nothing indicates the break in the plane wave propagation. Finally, the interaction of the plane excitation wave with the epicardial “handle” feature results in the re-entry pinned to this “handle” structure, see the panels in Figure 7(b), and (Multimedia view) Fig7b-rev.mpg.
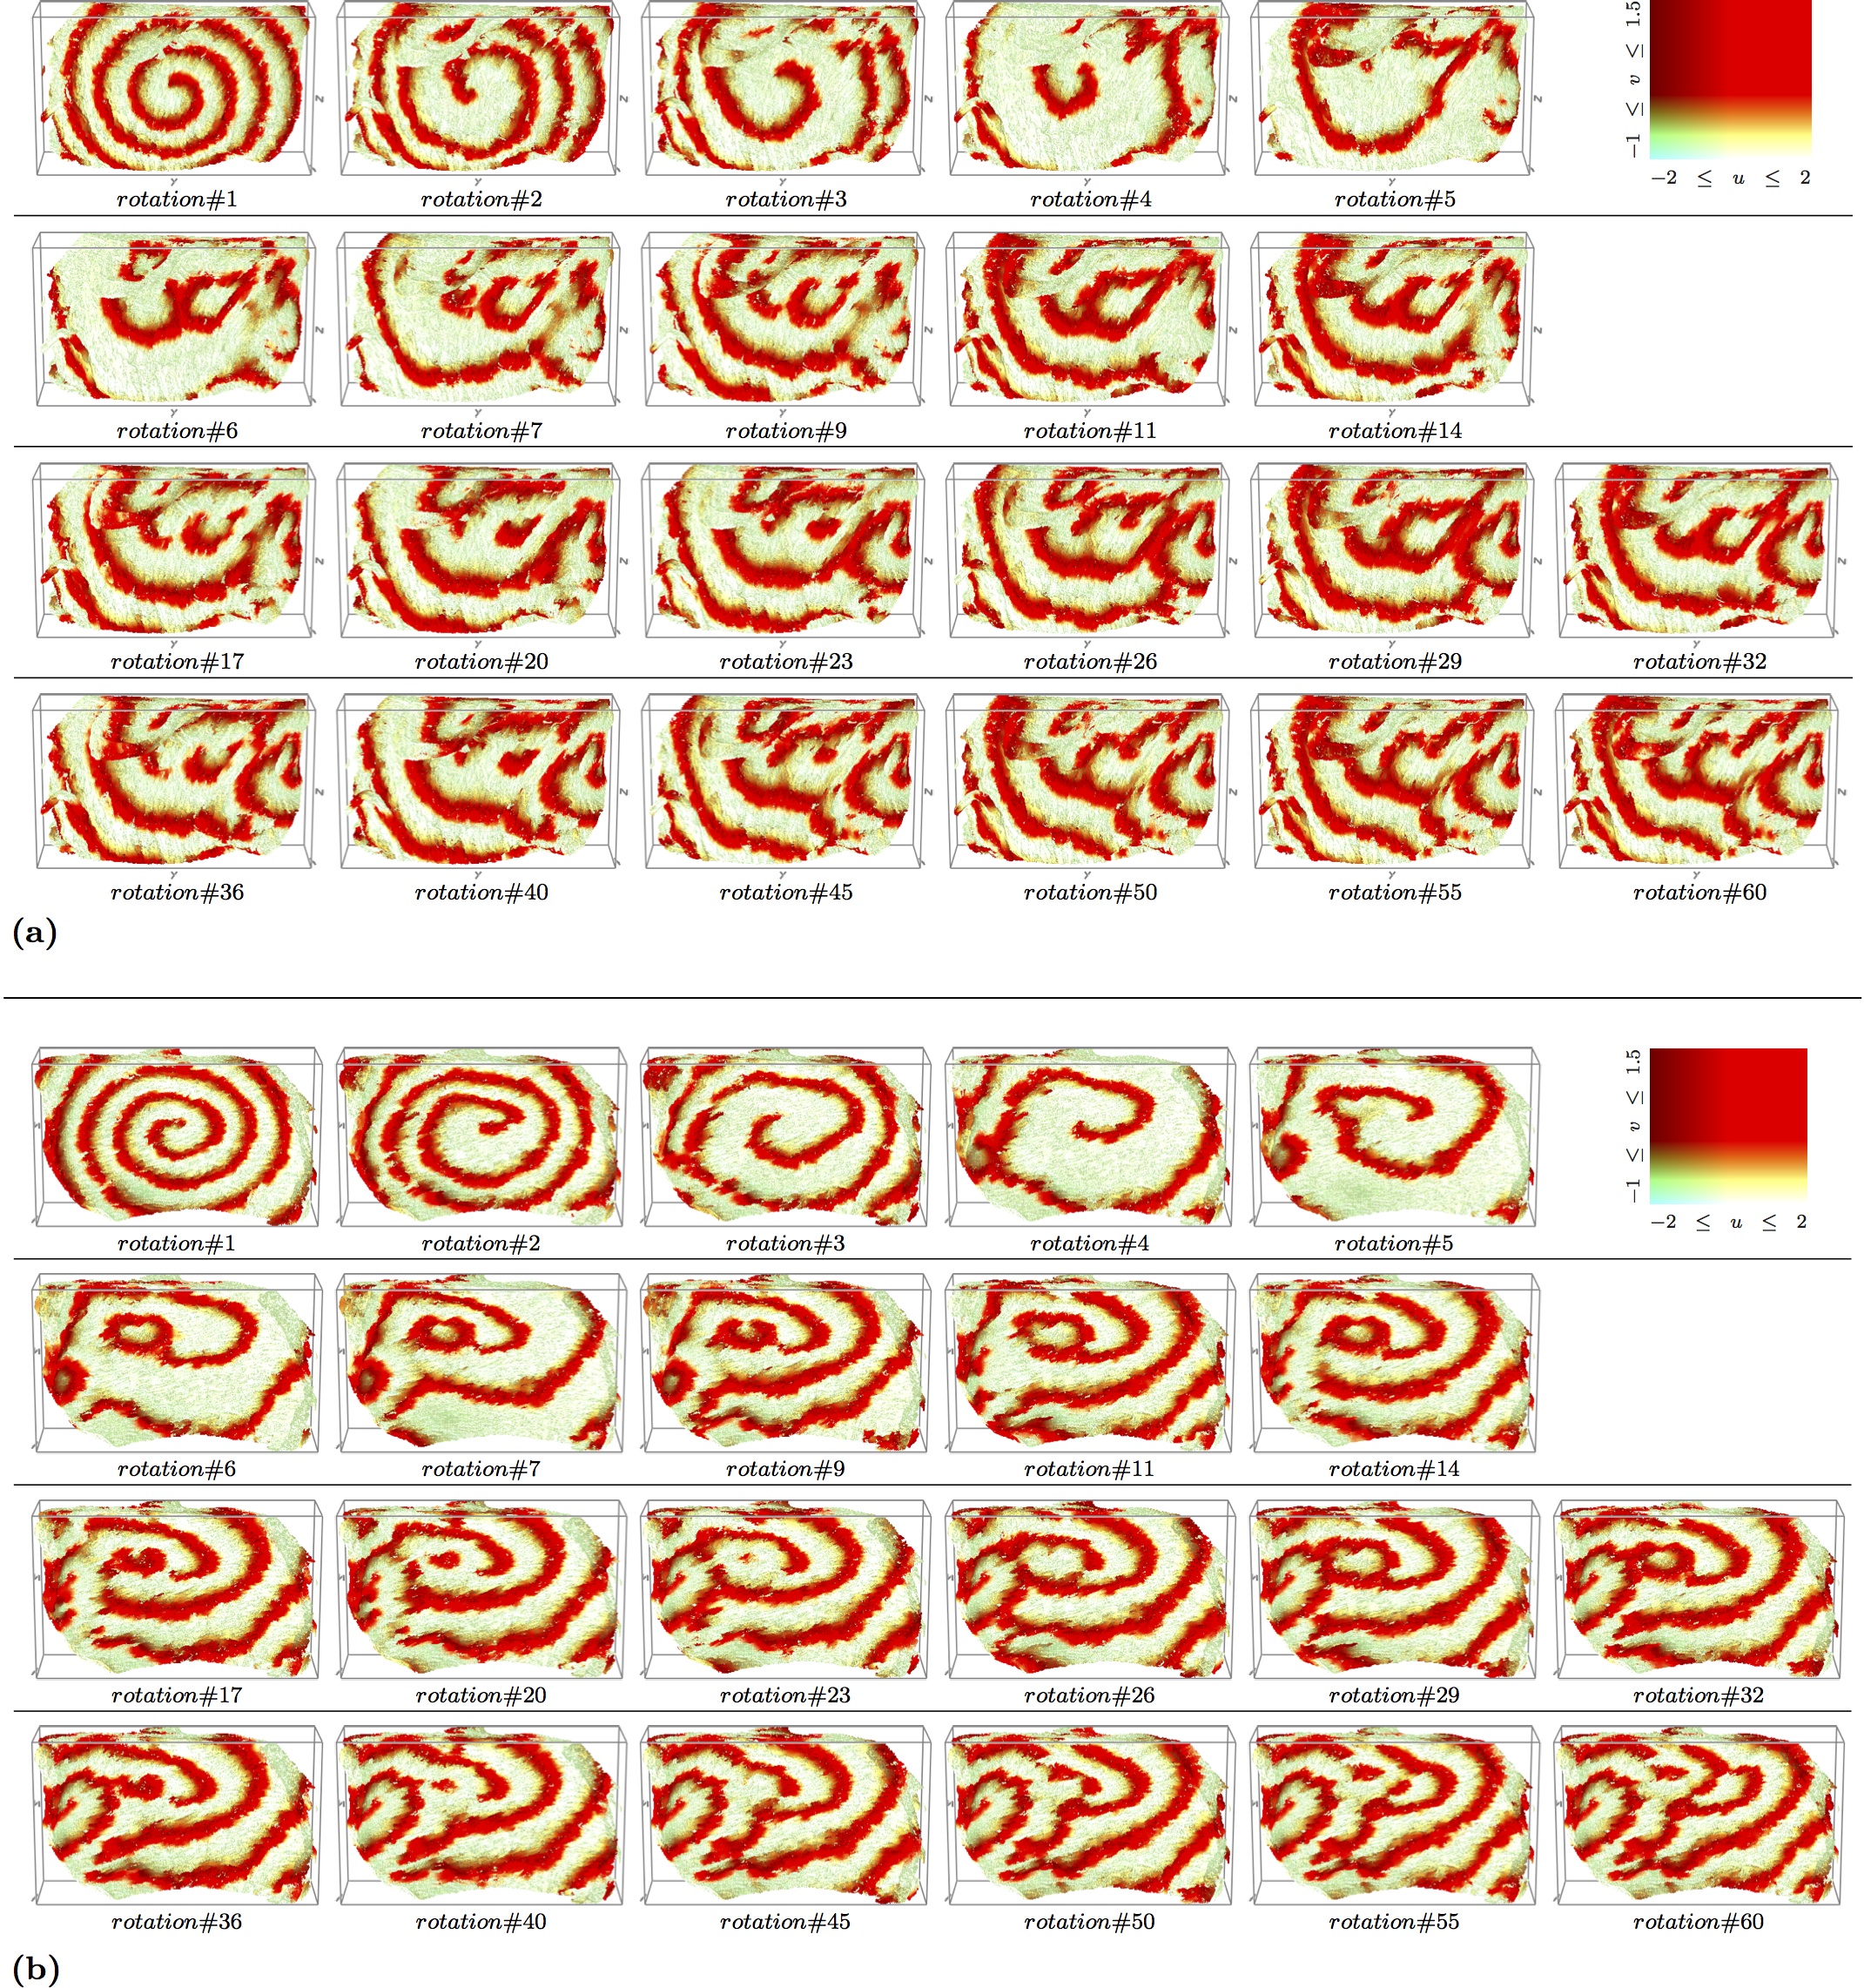
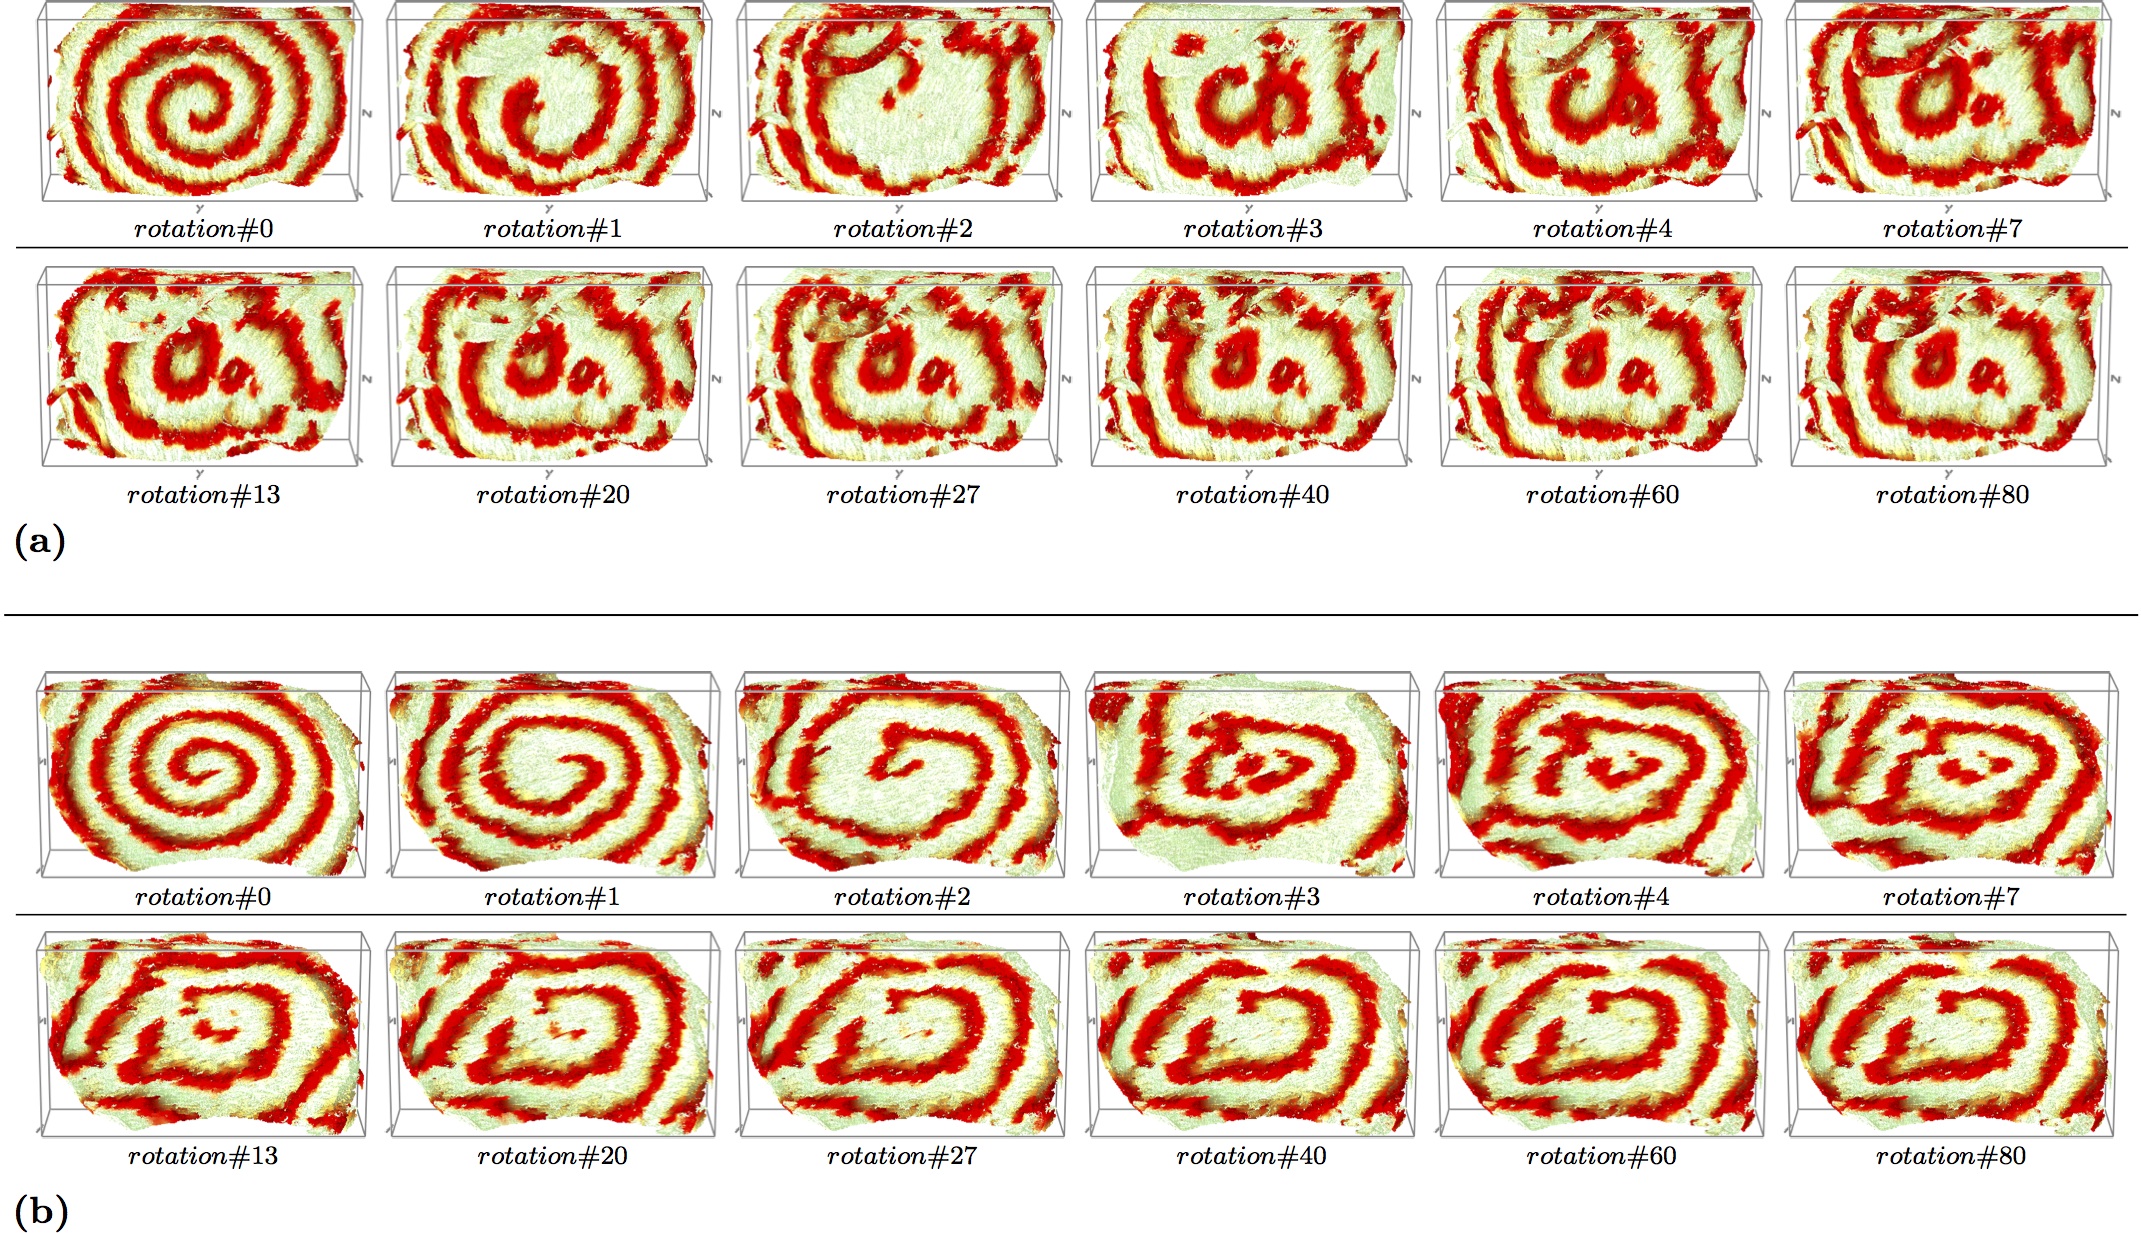
Figure 8 shows a stroboscopic epicardial, Figure 8(a), and the corresponding endocardial, Figure 8(b), visualisation of a counter-clockwise (in the epicardial view) excitation vortex initiated in the rat isotropic PV wall model by the phase distribution method (Biktashev and Holden, 1998), with the initial vortex filament transmurally along the axis through the middle of the wall at . From comparison of the epicardial, Figure 8(a), and the endocardial, Figure 8(b), views, it can be seen that although after a fast anatomy induced transient there is a stabilisation of multiple micro-anatomic reentrant drivers, at no point the epicardial view in Figure 8(a) is at least qualitatively similar to the corresponding instant endocardial view in Figure 8(b). Rather often what might look a re-entrant driver in the epicardial view looks a focal source in the corresponding instant endocardial view, and vice versa.
Figure 9 shows a stroboscopic epicardial, Figure 9(a), and the corresponding endocardial, Figure 9(b), visualisation of a clockwise (in the epicardial view) excitation vortex initiated in the rat isotropic PV wall model by the phase distribution method (Biktashev and Holden, 1998), with the initial vortex filament initiated transmurally along the axis through the middle of the wall at . Here, after a much faster anatomy induced transient than in the case of the counter clockwise initial re-entry shown in Figure 8, in Figure 9(b) from onwards there is a stabilisation to what looks like a “figure eight” re-entry in the middle of the instant endocardial views, with the couple of focal sources in the corresponding instant epicardial views in the Figure 9(a). Again, from comparison of the epicardial, Figure 9(a), and the corresponding endocardial, Figure 9(b), instant views, it can be seen that although after a fast anatomy induced transient there is a stabilisation of multiple micro-anatomic reentrant drivers, at no point an epicardial instant view in Figure 9(a) is similar to a corresponding endocardial instant view in Figure 9(b). Rather often what might look a re-entrant driver in the epicardial view looks a focal source in the corresponding instant endocardial view, and vice versa.
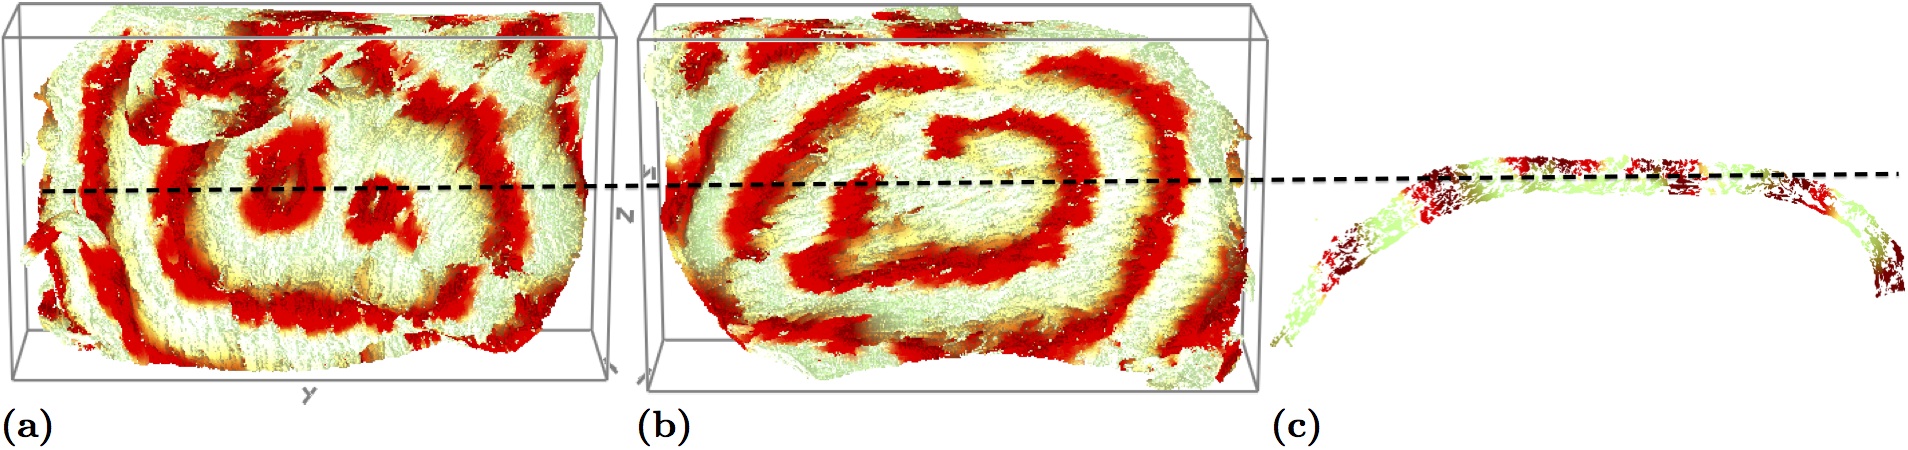
Figure 10 shows the transmural structure of the instant 3D excitation pattern seen in the corresponding epicardial and endocardial views in Figure 9 at the instant “rotation # 80”. Here, Figure 10(a) shows the enlarged epicardial view panel “rotation # 80” from Figure 9(a). Figure 10(b) shows the corresponding enlarged endocardial view panel “rotation # 80” from Figure 9(b). Figure 10(c) shows the transmural structure of the 3D excitation pattern shown in Figure 10(a) and Figure 10(b), in the middle cross section of the rat PV wall parallel to xy coordinate plane. The dashed line shows alignment of all the three panels in Figure 10(a-c). From comparison of the transmural structure of the 3D excitation pattern shown in Figure 10(c), with the rat PV wall fiber orientation structure shown in Figure 2(e-f), it can be seen that the difference in the PV wall epicardial and endocardial excitation patterns correlates with the transmural fiber rotation. Therefore, there is a clear separation of the “two focal sources” epicardium excitation pattern from the “figure of eight” endocardium excitation pattern seen in the cross section view in Figure 10(c).
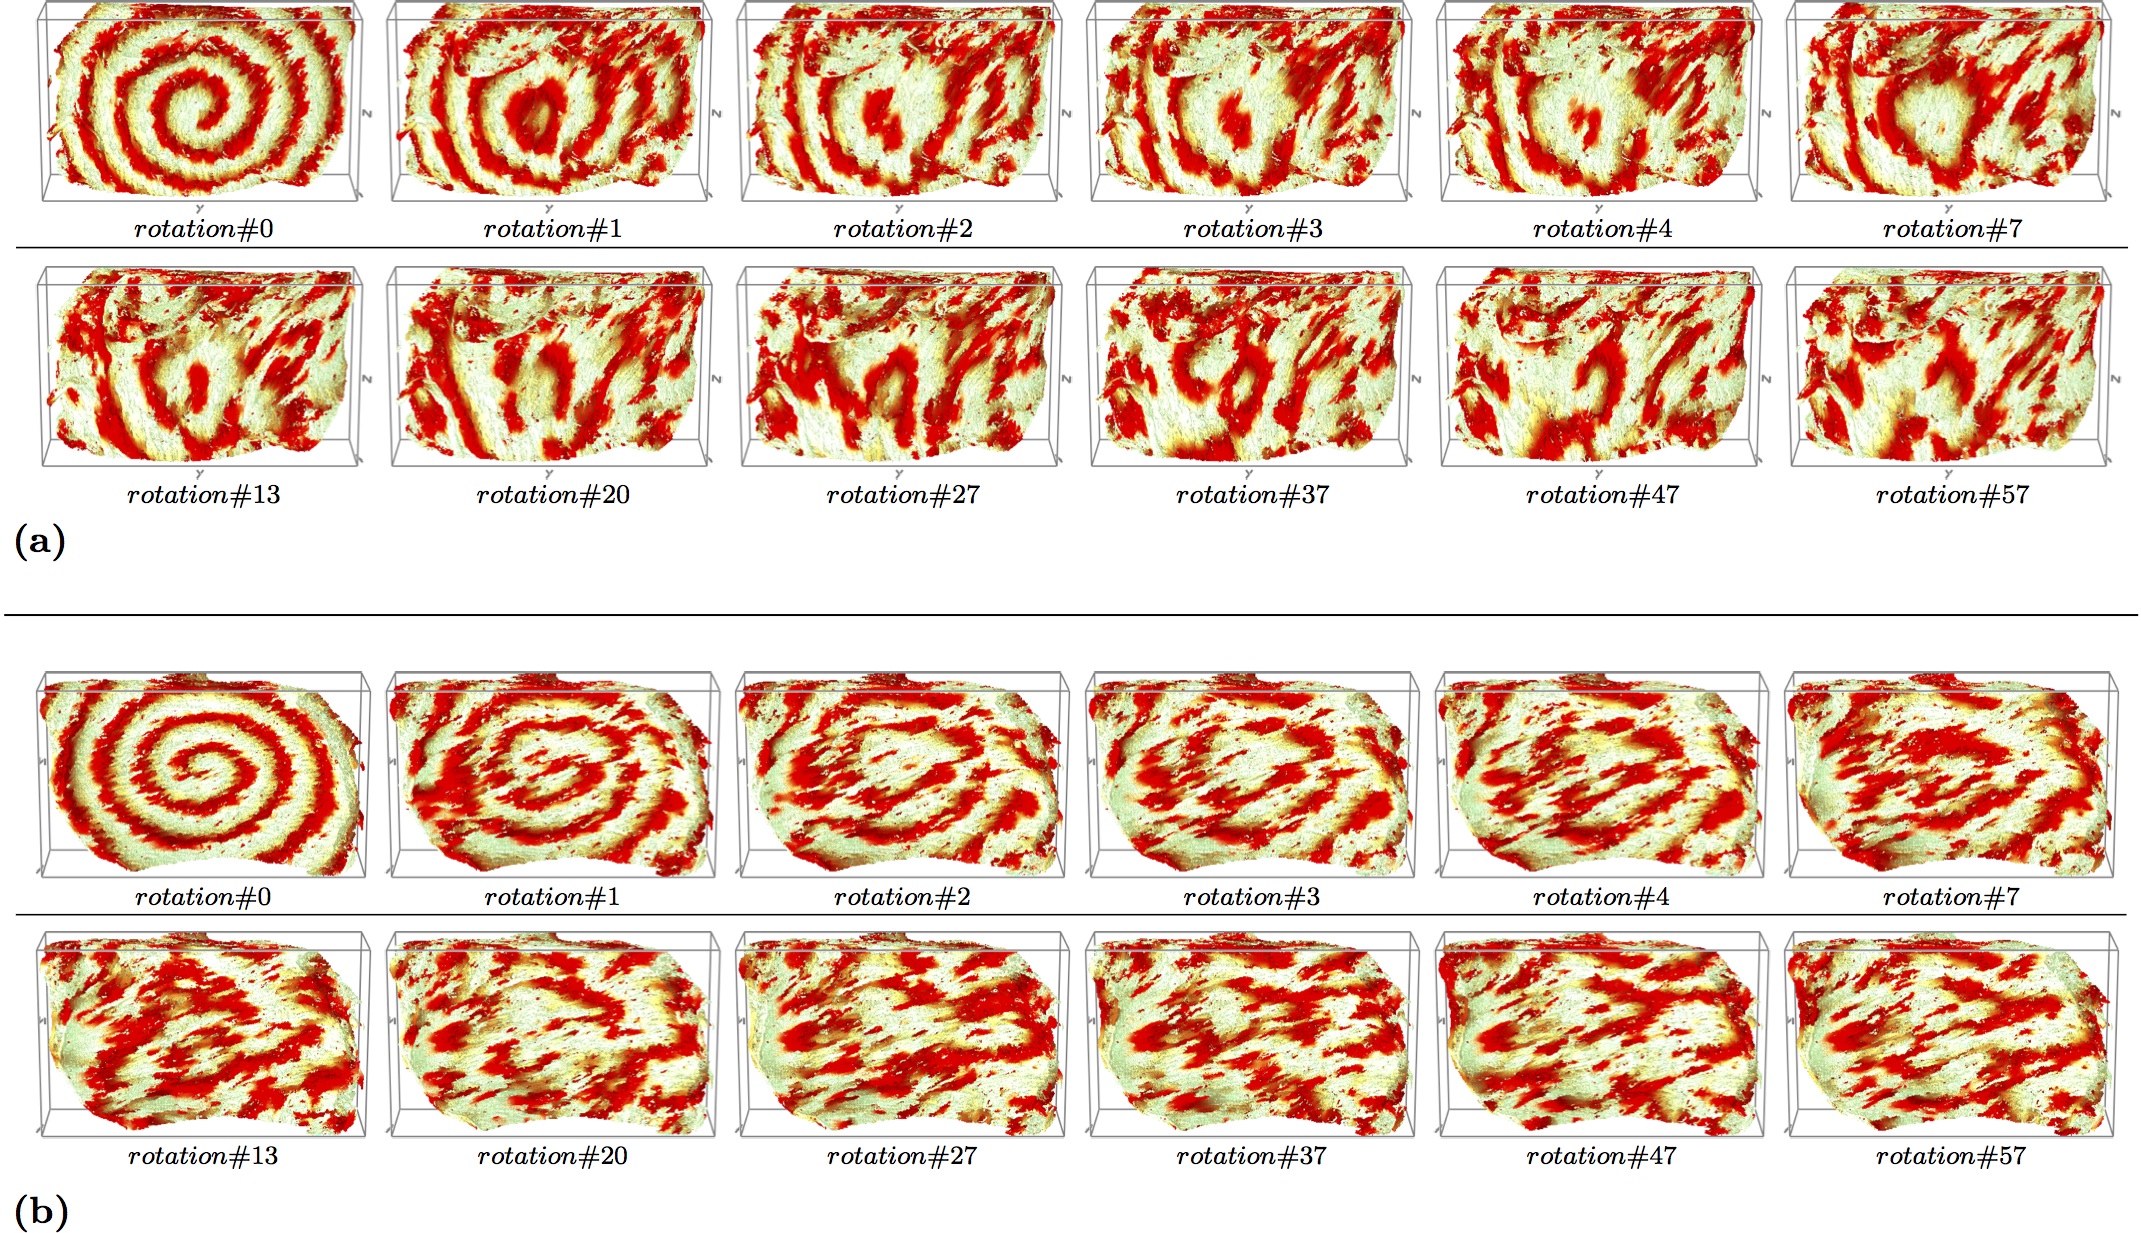
Figure 11 shows a stroboscopic epicardial, Figure 11(a), and the corresponding endocardial, Figure 11(b), visualisation of a clockwise (in the epicardial view) excitation vortex initiated in the rat anisotropic PV wall model by the phase distribution method (Biktashev and Holden, 1998), with the initial vortex filament initiated transmurally along the axis through the middle of the wall at . Here, again, no stabilisation of the resulting multiple micro-anatomic reentrant drivers is achieved, though no termination either, at least within the simulation time. Same as in the corresponding “isotropic” case shown in Figure 9, at no point an instant epicardial view in Figure 11(a) is similar to the corresponding instant endocardial view in Figure 11(b), with the obvious predominant excitation propagation along the fiber structures in the epicardium Figure 11(a) at the to the excitation propagation along the fiber structures in the endocardium in Figure 11(b).
6 Discussion
The role of heart anatomy and anisotropy in the origin and sustainability of cardiac arrhythmias has been an important open question for a long time. Anatomy of the heart, including its shape, fine anatomical detail, structured anisotropy of cardiac myocytes orientation, and the range of transmural fibre arrangement, shown to be consistent within a species (Hunter et al., 1997, p. 173), suggested a possibility of functional role of mammalian heart anatomy in cardiac re-entry dynamics. The recent discovery of the new phenomenon of interaction of dissipative vortices with small variations of thickness in the layer (Biktasheva et al., 2015; Ke et al., 2015) emphasised the possible effects of fine anatomical structures in the heart, such as e.g. Pectinate Muscles (PM), on the anatomy induced drift of cardiac re-entry (Wu et al., 1998; Yamazaki et al., 2012; Kharche et al., 2015a). However, there is limited experimental evidence to clarify the exact detail of heart anatomy and anisotropy effect on persistent cardiac arrhythmias and fibrillation.
Combination of High Performance Computing with the high-resolution DT-MRI, serial histological sections, and micro-CT data sets directly incorporated into the computationally demanding complete anatomically realistic computer simulations of the heart allows in-silico testing of the heart anatomy and anisotropy effects on the cardiac re-entry dynamics (Vigmond et al., 2009; Bishop et al., 2010; Kharche et al., 2015c, d; Antonioletti et al., 2017; Biktasheva et al., 2018). In this paper, we present anatomy and anisotropy realistic comparative computer simulation study of cardiac re-entry dynamics in high resolution isotropic and anisotropic sheep atria models based on the serial histological sections data sets, Figure 1, and in rat pulmonary vein wall model based on the highest subcellular resolution micro-CT data sets, Figure 2.
In order to eliminate complex effects of realistic cell kinetics, such as e.g. meander (Winfree, 1991), alternans (Karma, 1994), negative filament tension (Biktashev et al., 1994), etc., and elucidate pure effects of the heart anatomy and anisotropy on cardiac re-entry dynamics, simplified FitzHugh-Nagumo (Winfree, 1991) excitation model with rigidly rotating core and positive filament tension was chosen for this study. A specific interplay of realistic cardiac excitation kinetics with heart anatomy and anisotropy, such as e.g. frequency lock, should be addressed in future studies.
The dominant periods of all the simulated re-entries in the “down-sampled”, Figure 1(c) and Figure 3(c), and in the “complete”, Figure 1(a,b) and Figure 5, sheep atria models were close to the period 11.36 of the free spiral wave in the FitzHugh-Nagumo model (see Section 4.2), which was expected as we considered homogeneous models without any strong perturbations, and also served as an additional confirmation that we were dealing with functional rather than anatomical re-entries.
Our by all means initial comparative isotropic and anisotropic simulation of cardiac re-entry in the otherwise homogeneous high resolution models of sheep atria confirmed cardiac re-entry interaction with the fine anatomical structures (Wu et al., 1998; Yamazaki et al., 2012; Kharche et al., 2015c; Biktasheva et al., 2015). It can be seen in Figure 3(b,d) and Figure 4, that the abundance of fine endocardial structures in the sheep atria provides a lot of potential pinning sites for sheep atrial re-entry. So, depending on the re-entry initial location, it could pin to Bachman’s bundle and pectinate muscles in the left and right atrial appendages, see Figure 3(b,d) and Figure 4. This pinning to fluctualtions of thickness in the sheep atria can be seen in the less accurate “down-sampled” model, Figure 1(c) and Figure 3(b,c), as well as in the high resolution “complete” sheep atria model, Figure 1(a, b), Figure 3(d), Figure 4 and Figure 5.
From Figure 4 and Figure 5, it can be seen that, in general, anisotropy significantly changes the trajectory and pinning location of the anatomy induced drift. A comparison of the trajectories “with” (trajectories “(a)”, “(c)”, “(e)”, and “(g)” in Figure 4) and “without” anisotropy (trajectories “(b)”, “(d)”, “(f)”, and “(h)” in Figure 4), suggests that the sheep atria anisotropy tends to drift a re-entry away from the main blood vessesls into the right and left atrial appendages, although, of course, such a generalisation would require a lot more simulations in order to be statistically salient.
Theory (Wellner et al., 2002; Dierckx et al., 2015) predicts strong effects of anisotropy on dynamics of singular filaments, which must act in addition to purely geometric forces. An iteresting confirmation of the theoretical prediction is the case of isotropic vs anisotropic conductance in the sheep atria, which resulted in the very different lengths and orientation of the final pinned filaments shown in Figure 6(b) and in Figure 6(c). Different to the short isotropic transmural filament shown in Figure 6(b), the realistic anysotropy of the very thin sheep atria still was able to result in a long intramural filament stretched almost parallel to the epicardial surface, Figure 6(c). The transient increase in total number and length of re-entry filaments was shown to be a mechanism of re-entry self-termination in the DT-MRI based model of human foetal heart (Biktasheva et al., 2018). Although we also observed here the increase of the length of sheep atrial re-entry filaments due to the sheep atria anisotropy, we have not seen in the present sheep atria study a transient increase in number and length of the filaments followed by the self-termination of the re-entry, as e.g. in human foetal heart simulations (Biktasheva et al., 2018).
A comparison of the present study of anatomy induced drift in sheep atria with our previous studies of re-entry dynamics in human atria (Kharche et al., 2012, 2013, 2015b, 2015c), also suggests that different heart anatomy in different species can result in different patterns of atrial re-entry dynamics, albeit the general tendency to pin to a nearest stable pinning location persists (Biktashev et al., 2011).
The comparative simulations of micro-anatomic re-entry in the highest subcellular resolution rat PV wall model, where the transmural fiber direction change of is a salient feature of the PV wall anatomy, see Figure2(e,f), gave a number of important confirmations and new unexpected results.
Note that at the subcellular spatial resolution used, despite the obvious limitation due to the lack of biophysical realism, there are meaningful observations to be made. Namely, at this resolution, the anisotropic structure of the tissue is represented directly, see Figure 2(c,d), unlike the averaged representation in more traditional macroscopic models. Consequently, following the convenient alignment of the visible due to the high subcellular resolution orientation of the fibres in the rat PV wall micro-CT images, that is the endocardium fibers were aligned with the horisontal x axis (Figure 2(c)), while the epicardium fibers were aligned with the vertical y axis (Figure 2(d)), the effect of the fibre directions is observed in simulations with scalar (isotropic) diffusivity.
The plane wave simulation shown in Figure 7, confirmed a connectivity and capability of the subcellular resolution rat PV wall tissue model to propagate excitation waves. It also showed that the specific combination of the rat PV wall anatomy, including the small fluctuations of thickness due to the fine endocardium and epicardium structural features, together with the transmural fiber direction change of , Figure 2(c-f), may generate a re-entry out of a plane excitation wave without any electrophysiological inhomogeneities. Various “geometric” mechanisms of re-entry initiation have been discussed by theoreticians (Agladze et al., 1994; Zemlin and Pertsov, 2007); we stress though that in our case, whichever mechanism played the decisive role, the geometry was not in any way specially prepared but obtained from a real tissue preparation, and no specific stimulation protocol was applied apart from a single plane wave initiation.
From simulations shown in Figure 8 and Figure 9, it can be seen that re-entry of different chirality produce qualitatively different stabilisation patterns in the rat PV wall tissue model.
Importantly, the simulations confirmed that, because of the transmural fiber direction change of in the PV wall, a stable atrial micro-anatomic re-entry might produce qualitatively different endocardial and epicardial manifestation (Csepe et al., 2017), so that a clearly seen on the endocardium micro-anatomic “figure eight” reentry, Figure 10(b), might appear as a couple of focal sources on the epicardium, Figure 10(b, c), and vice versa: compare e.g. the corresponding time instant panels “rotation # 6” in Figure 8(a) and in Figure 8(b). Appreciation of the fact that even a rather thin the PV wall may still produce an essentially 3D excitation patten, as e.g. shown in Figure 10, might be important in atrial ablation when e.g. determining location of a re-entrant circuit.
Introduction of a diffusivity tensor based on the PV wall fibre directions further enhances the effect of anisotropy in the PV wall model. See e.g. Figure 11, which shows the expected enhanced epicardium propagation of excitation along the vertical y axis, and the enhanced endocardium propagation of excitation along the horisontal x axis, but in this context such enhancement might be entirely artificial.
Although a general role of fiber anisotropy in the genesis and sustenance of arrhythmias could be and has been addressed by numerics in idealised and simplified geometries with different spatial distributions of anisotropy, see e.g. the pioneering study (Fenton and Karma, 1998), we believe that the main novelty and significance of our present study is that the high resolution serial histological sections and the subcellular resolution micro-CT data sets, containing both the detail heart anatomy and the myofiber structure, can be directly incorporated into the computationally demanding HPC complete anatomy and anisotropy realistic computer simulations, and thus serve a model for comparative intra- and inter-species in-silico study of cardiac re-entry dynamics in mammalian hearts.
7 Nomenclature
7.1 Resource Identification Initiative
BeatBox, RRID:SCR_015780
Conflict of Interest Statement
The authors declare that the research was conducted in the absence of any commercial or financial relationships that could be construed as a potential conflict of interest.
Animal ethics statement
All surgical procedures were approved by the Animal Ethics Committee of the University of Auckland and conform to the Guide for the Care and Use of Laboratory Animals (NIH publication no. 85-23)
Author Contributions
GSR, BT, IJLeG, BHS, JZ, and IVB contributed conception and design of the study; GSR, BT, IJLeG, BHS, and JZ contributed the micro-CT and serial histological sections data sets; BT wrote Section 4.1.1; GSR wrote Section 4.1.3; GSR, BT, and VNB converted the data sets into BeatBox geometry format; IVB, VNB, and DPF ran the simulations; IVB and VNB did visualisation; IVB performed the analysis, and wrote the first draft of the manuscript. All authors contributed to manuscript revision, read and approved the submitted version.
Funding
We acknowledge support of the Health Research Council of New Zealand for the data sets. Development of BeatBox software was supported by EPSRC (UK) grant EP/I029664. We also acknowledge partial support by EPSRC (UK) grants EP/E016391/1, EP/N014391/1, EP/E018548/1, EP/P008690/1; by the University of Sheffield (UK) Network: POEMS - Predictive mOdelling for hEalthcare technologies through MathS under EPSRC (UK) grant EP/L001101/1; by the National Science Foundation (USA) under Grants No. NSF PHY99-07949 and NSF PHY-1748958.
Acknowledgements
We thank all the developers of the BeatBox HPC Simulation Environment for Biophysically and Anatomically Realistic Cardiac Electrophysiology. We thank EPSRC Centre for Predictive Modelling in Healthcare, University of Exeter, Exeter, UK for running the simulations on the CPMH compute servers.
Supplementary Material
The Supplementary Material for this article can be found online at …
References
- Agladze et al. (1994) Agladze, K., Keener, J., Müller, S., and Panfilov, A. (1994). Rotating spiral waves created by geometry. Science 264, 1746–1748
- Allessie et al. (1973) Allessie, M. A., Bonke, F. I. M., and Schopman, F. J. (1973). Circus movement in rabbit atrial muscle as a mechanism of tachycardia. Circ. Res. 32, 54–62
- Anselmino et al. (2011) Anselmino, M., Blandino, A., Beninati, S., Rovera, C., Boffano, C., Belletti, M., et al. (2011). Morphologic analysis of left atrial anatomy by magnetic resonance angiography in patients with atrial fibrillation: a large single center experience. Journal of Cardiovascular Electrophysiology 22, 1–7
- Antonioletti et al. (2017) Antonioletti, M., Biktashev, V. N., Jackson, A., Kharche, S. R., Stary, T., and Biktasheva, I. V. (2017). Beatbox - hpc simulation environment for biophysically and anatomically realistic cardiac electrophysiology. PLoS ONE 12(5), e0172292. https://doi.org/10.1371/journal.pone.0172292
- Balakhovsky (1965) Balakhovsky, I. (1965). Some regimes of excitation movement in an ideal excitable tissue. Biofizika 9, 1–63. In Russian
- Biktashev (1998) Biktashev, V. N. (1998). A three-dimensional autowave turbulence. Int. J. of Bifurcation and Chaos 8, 677–684
- Biktashev et al. (2010) Biktashev, V. N., Barkley, D., and Biktasheva, I. V. (2010). Orbital motion of spiral waves in excitable media. Phys Rev Lett 104, 058302
- Biktashev et al. (2011) Biktashev, V. N., Biktasheva, I. V., and Sarvazyan, N. A. (2011). Evolution of spiral and scroll waves of excitation in a mathematical model of ischaemic border zone. PLoS ONE 6, e24388
- Biktashev and Holden (1998) Biktashev, V. N. and Holden, A. (1998). Re-entrant waves and their elimination in a model of mammalian ventricular tissue. Chaos 8, 48–56
- Biktashev and Holden (1994) Biktashev, V. N. and Holden, A. V. (1994). Design principles of a low-voltage cardiac defibrillator based on the effect of feed-back resonant drift. J. Theor. Biol. 169, 101–113
- Biktashev et al. (1994) Biktashev, V. N., Holden, A. V., and Zhang, H. (1994). Tension of organizing filaments of scroll waves. Phil. Trans. Roy. Soc. Lond. ser. A 347, 611–630
- Biktasheva et al. (2018) Biktasheva, I. V., Anderson, R. A., Holden, A. V., Pervolaraki, E., and Wen, F. C. (2018). Cardiac re-entry dynamics and self-termination in dt-mri based model of human fetal heart. Frontiers in Physics 6, 15. 10.3389/fphy.2018.00015
- Biktasheva and Biktashev (2003) Biktasheva, I. V. and Biktashev, V. N. (2003). Wave-particle dualism of spiral waves dynamics. Phys. Rev. E 67, 026221
- Biktasheva et al. (2015) Biktasheva, I. V., Dierckx, H., and Biktashev, V. N. (2015). Drift of scroll waves in thin layers caused by thickness features: asymptotic theory and numerical simulations. Phys. Rev. Lett. 114, 068302
- Bishop and Plank (2012) Bishop, M. J. and Plank, G. (2012). The role of fine-scale anatomical structure in the dynamics of reentry in computational models of the rabbit ventricles. JOURNAL OF PHYSIOLOGY-LONDON 590, 4515–4535
- Bishop et al. (2010) Bishop, M. J., Plank, G., Burton, R., Schneider, J., Gavaghan, D., Grau, V., et al. (2010). Development of an anatomically detailed MRI-derived rabbit ventricular model and assessment of its impact on simulations of electrophysiological function. AMERICAN JOURNAL OF PHYSIOLOGY-HEART AND CIRCULATORY PHYSIOLOGY 298, H699–H718
- Bishop et al. (2011) Bishop, M. J., Vigmond, E., and Plank, G. (2011). Cardiac bidomain bath-loading effects during arrhythmias: Interaction with anatomical heterogeneity. Biophysical Journal 101, 2871–2881
- Bosch and Nattel (2002) Bosch, R. F. and Nattel, S. (2002). Cellular electrophysiology of atrial fibrillation. Cardiovascular Research 54, 259–269
- Christoph et al. (2018) Christoph, J., Chebbok, M., Richter, C., Schroeder-Schetelig, J., Bittihn, P., Stein, S., et al. (2018). Electromechanical vortex filaments during cardiac fibrillation. NATURE 555, 667–+. 10.1038/nature26001
- Csepe et al. (2017) Csepe, T., Hansen, B., and Fedorov, V. (2017). Atrial fibrillation driver mechanisms: Insight from the isolated human heart. TRENDS IN CARDIOVASCULAR MEDICINE 27, 1–11. 10.1016/j.tcm.2016.05.008
- Davydov et al. (1988) Davydov, V. A., Zykov, V. S., Mikhailov, A. S., and Brazhnik, P. K. (1988). Drift and resonance of spiral waves in active media. Radiofizika 31, 574–582. In Russian
- Dierckx et al. (2013) Dierckx, H., Brisard, E., Verschelde, H., and Panfilov, A. (2013). Drift laws for spiral waves on curved anisotropic surfaces. Phys. Rev. E 88, 012908
- Dierckx et al. (2015) Dierckx, H., Wellner, M., Bernus, O., and Verschelde, H. (2015). Generalized minimal principle for rotor filaments. Phys. Rev. Lett. 114, 178104
- Eckstein et al. (2011) Eckstein, J., Maesen, B., Linz, D., Zeemering, S., van Hunnik, A., Verheule, S., et al. (2011). Time course and mechanisms of endo-epicardial electrical dissociation during atrial fibrillation in the goat. CARDIOVASCULAR RESEARCH 89, 816–824
- Eckstein et al. (2013) Eckstein, J., Zeemering, S., Linz, D., Maesen, B., Verheule, S., van Hunnik, A., et al. (2013). Transmural conduction is the predominant mechanism of breakthrough during atrial fibrillation: Evidence from simultaneous endo-epicardial high-density activation mapping. Circulation: Arrhythmia and Electrophysiology 6, 334–341
- Ermakova et al. (1989) Ermakova, E. A., Pertsov, A. M., and Shnol, E. E. (1989). On the interaction of vortices in 2-dimensional active media. Physica D 40, 185–195
- Fenton and Karma (1998) Fenton, F. and Karma, A. (1998). Vortex dynamics in three-dimensional continuous myocardium with fiber rotation: Filament instability and fibrillation. Chaos 8, 20–47
- Fukumoto et al. (2016) Fukumoto, K., Habibi, M., Ipek, S., E. G. Zahid, Khurram, I. M., Zimmerman, S. L., Zipunnikov, V., et al. (2016). Association of left atrial local conduction velocity with late gadolinium enhancement on cardiac magnetic resonance in patients with atrial fibrillation. CIRCULATION-ARRHYTHMIA AND ELECTROPHYSIOLOGY 9, e002897
- Garey (1914) Garey, W. E. (1914). The nature of fibrillatory contraction of the heart – its relation to tissue mass and form. Am. J. Physiol. 33, 397–414
- Gerneke et al. (2007) Gerneke, D., Sands, G., Ganesalingam, R., Joshi, P., Caldwell, B., Smaill, B., et al. (2007). Surface imaging microscopy using an ultramiller for large volume 3d reconstruction of wax- and resin-embedded tissues. Microscopy Research and Technique 70, 886–894. 10.1002/jemt.20491
- Gray et al. (1996) Gray, R. A., Pertsov, A. M., and Jalife, J. (1996). Incomplete reentry and epicardial breakthrough patterns during atrial fibrillation in the sheep heart. Circulation 94, 2649–2661
- Hunter et al. (1997) Hunter, P. J., Smaill, B. H., Nielsen, P. M. F., and Le Grice, I. J. (1997). A mathematical model of cardiac anatomy. In Computational Biology of the Heart, eds. A. V. Holden and A. V. Panfilov (Chichester: Wiley), 171–215
- Karma (1994) Karma, A. (1994). Electrical alternans and spiral wave breakup in cardiac tissue. CHAOS 4, 461–472
- Ke et al. (2015) Ke, H., Zhang, Z., and Steinbock, O. (2015). Scroll wave drift along steps, troughs, and corners. CHAOS 25, 064303. 10.1063/1.4921718
- Keener (1988) Keener, J. P. (1988). The dynamics of three-dimensionsional scroll waves in excitable media. Physica D 31, 269–276
- Kharche et al. (2012) Kharche, S., Biktasheva, I., Seemann, G., Zhang, H., and Biktashev, V. (2012). Cardioversion using feedback stimuli in human atria. Computing in Cardiology 39, 133–136
- Kharche et al. (2015a) Kharche, S., Biktasheva, I., Seemann, G., Zhang, H., and Biktashev, V. N. (2015a). A computer simulation study of anatomy induced drift of spiral waves in the human atrium. BioMed Research International 8th International Conference on Functional Imaging and Modeling of the Heart, 731386. 10.1155/2015/731386
- Kharche et al. (2015b) Kharche, S., Biktasheva, I., Seemann, G., Zhang, H., Zhao, J., and Biktashev, V. (2015b). Computational modelling of low voltage resonant drift of scroll waves in the realistic human atria. LNCS 8th International Conference on Functional Imaging and Modeling of the Heart, 421–429
- Kharche et al. (2013) Kharche, S., Biktasheva, I., Zhang, H., and Biktashev, V. (2013). Simulating the role of anisotropy in human atrial cardioversion. In 2013 35TH ANNUAL INTERNATIONAL CONFERENCE OF THE IEEE ENGINEERING IN MEDICINE AND BIOLOGY SOCIETY (EMBC). IEEE Engineering in Medicine and Biology Society Conference Proceedings, 6838–6841
- Kharche et al. (2015c) Kharche, S. R., Biktasheva, I. V., Seeman, G., Zhang, H., and Biktashev, V. N. (2015c). A computer simulation study of anatomy induced drift of spiral waves in the human atrium. BioMed Research International 2015, 731386
- Kharche et al. (2015d) Kharche, S. R., Biktasheva, I. V., Seemann, G., Zhang, H., Zhao, J., and Biktashev, V. N. (2015d). Computational modelling of low voltage resonant drift of scroll waves in the realistic human atria. Lecture Notes in Computer Science 9126, 421–429
- Krinsky (1968) Krinsky, V. (1968). Fibrillation in the excitable media. Problemy Kibernetiki 2, 59–80. In Russian
- Kushiyama et al. (2016) Kushiyama, Y., Honjo, H., Niwa, R., Takanari, H., Yamazaki, M., Takemoto, Y., et al. (2016). Partial i-k1 blockade destabilizes spiral wave rotation center without inducing wave breakup and facilitates termination of reentrant arrhythmias in ventricles. American Journal of Physiology: Heart and Circulatory Physiology 311, H750–H75
- MacEdo et al. (2010) MacEdo, P. G., Kapa, S., Mears, J. A., Fratianni, A., and Asirvatham, S. J. (2010). Correlative anatomy for the electrophysiologist: ablation for atrial fibrillation. part ii: regional anatomy of the atria and relevance to damage of adjacent structures during af ablation. Journal of Cardiovascular Electrophysiology 21, 829–836
- Mines (1913) Mines, G. R. (1913). On dynamic equilibrium in the heart. J. Physiol. 46, 349–383
- Nattel (2002) Nattel, S. (2002). New ideas about atrial fibrillation 50 years on. Nature 415, 219–226
- Panfilov et al. (1984) Panfilov, A. V., Rudenko, A. N., and Pertsov, A. M. (1984). Twisted scroll waves in active 3-dimensional media. Doklady AN SSSR 279, 1000–1002. In Russian
- Pellman et al. (2010) Pellman, J., Lyon, R. C., and Sheikh, F. (2010). Extracellular matrix remodeling in atrial fibrosis: mechanisms and implications in atrial fibrillation. Journal of Molecular and Cellular Cardiology 48, 461–467
- Pertsov et al. (1993) Pertsov, A. M., Davidenko, J. M., Salomonsz, R., and Baxter, J., W. T. Jalife (1993). Spiral waves of excitation underlie reentrant activity in isolated cardiac muscle. Circ. Res. 72, 631–650
- Pertsov et al. (2000) Pertsov, A. M., Wellner, M., Vinson, M., and Jalife, J. (2000). Topological constraint on scroll wave pinning. Phys. Rev. Lett. 84, 2738–2741
- Rodriguez et al. (2006) Rodriguez, B., Eason, J. C., and Trayanova, N. (2006). Differences between left and right ventricular anatomy determine the types of reentrant circuits induced by an external electric shock. a rabbit heart simulation study. PROGRESS IN BIOPHYSICS & MOLECULAR BIOLOGY 90, 399–413
- Schroeder et al. (2006) Schroeder, W., Martin, K., and Lorensen, B. (2006). The Visualization Toolkit (4th ed.) (Kitware)
- Smaill et al. (2004) Smaill, B. H., LeGrice, I. J., Hooks, D. A., Pullan, A. J., Caldwell, B. J., and Hunter, P. J. (2004). Cardiac structure and electrical activation: Models and measurement. CLINICAL AND EXPERIMENTAL PHARMACOLOGY AND PHYSIOLOGY 31, 913–919
- Spach (2001) Spach, M. (2001). Mechanisms of the dynamics of reentry in a fibrillating myocardium - developing a genes-to-rotors paradigm. CIRCULATION RESEARCH 88, 753–755
- Takemoto et al. (2012) Takemoto, Y., Takanari, H., Honjo, H., Ueda, N., Harada, M., Kato, S., et al. (2012). Inhibition of intercellular coupling stabilizes spiral-wave reentry, whereas enhancement of the coupling destabilizes the reentry in favor of early termination. American Journal of Physiology: Heart and Circulatory Physiology 303, H578–H586
- Vigmond et al. (2009) Vigmond, E., Vadakkumpadan, F., Gurev, V., Arevalo, H., Deo, M., Plank, G., et al. (2009). Towards predictive modelling of the electrophysiology of the heart. EXPERIMENTAL PHYSIOLOGY 94, 563–577. 10.1113/expphysiol.2008.044073
- Wellner et al. (2002) Wellner, M., Berenfeld, O., Jalife, J., and Pertsov, A. M. (2002). Minimal principle for rotor filaments. PNAS 99, 8015–8018
- Wiener and Rosenblueth (1946) Wiener, N. and Rosenblueth, A. (1946). The mathematical formulation of the problem of conduction of impulses in a network of connected excitable elements, specifically in cardiac muscle. Arch. Inst. Cardiologia de Mexico 16, 205–265
- Winfree (1991) Winfree, A. T. (1991). Varieties of spiral wave behaviour — an experimentalist’s approach to the theory of excitable media. Chaos 1, 303–334
- Workman et al. (2008) Workman, A. J., Kane, K. A., and Rankin, A. C. (2008). Cellular bases for human atrial fibrillation. Heart Rhythm 5, S1–S6
- Wu et al. (1998) Wu, T. J., Yashima, M., Xie, F., Athill, C. A., Kim, Y. H., Fishbein, M. C., et al. (1998). Role of pectinate muscle bundles in the generation and maintenance of intra-atrial reentry. potential implications for the mechanism of conversion between atrial fibrillation and atrial flutter. Circulation Research 83, 448–462
- Yamazaki et al. (2012) Yamazaki, M., Mironov, S., Taravant, C., Brec, J., Vaquero, L. M., Bandaru, K., et al. (2012). Heterogeneous atrial wall thickness and stretch promote scroll waves anchoring during atrial fibrillation. Cardiovascular Research 94, 48–57
- Yoo et al. (2002) Yoo, T., Ackerman, M. J., Lorensen, W. E., Schroeder, W., Chalana, V., Aylward, S., et al. (2002). Engineering and algorithm design for an image processing api: A technical report on itk - the insight toolkit. In Medicine Meets Virtual Reality (IOS Press Amsterdam), 586–592
- Zemlin and Pertsov (2007) Zemlin, C. and Pertsov, A. (2007). Bradycardic onset of spiral wave re-entry: structural substrates. Europace 9, vi59–vi63. https://doi.org/10.1093/europace/eum205
- Zhao et al. (2012) Zhao, J., Butters, T. D., Zhang, H., Pullan, A. J., LeGrice, I. J., Sands, G. B., et al. (2012). An image-based model of atrial muscular architecture effects of structural anisotropy on electrical activation. Circulation: Arrhythmia and Electrophysiology 5, 361–370. 10.1161/CIRCEP.111.967950