Scaling Spike Detection and Sorting for Next Generation Electrophysiology
a Institute for Adaptive Neural Computation, School of Informatics, University of Edinburgh, Informatics Forum, 10 Crichton Street, Edinburgh EH8 9AB, Scotland, United Kingdom b School of Computer Science and Communication, KTH Royal Institute of Technology, Lindstedtsvägen 5, 114 28 Stockholm, Sweden
Abstract
Reliable spike detection and sorting, the process of assigning each detected spike to its originating neuron, is an essential step in the analysis of extracellular electrical recordings from neurons. The volume and complexity of the data from recently developed large scale, high density microelectrode arrays and probes, which allow recording from thousands of channels simultaneously, substantially complicate this task conceptually and computationally. This chapter provides a summary and discussion of recently developed methods to tackle these challenges, and discuss the important aspect of algorithm validation, and assessment of detection and sorting quality.
1 Introduction
Extracellular electrical recording of neural activity is an essential tool in neuroscience. If an electrode is placed sufficiently close to a spiking neuron, the extracellular potential recorded often contains a clear, readily detectable signature of the action potential. As extracellular electrodes do not interfere with neural function, such recordings provide an unbiased and precise record of the functioning of intact neural circuits.
Recent progress in CMOS technology (Complementary metal-oxide semiconductor technology for low power integrated circuits) has provided systems that allow recording from thousands of closely spaced channels simultaneously with ever increasing density and sampling rates. With this technology, it becomes possible to reliably monitor several thousand neurons simultaneously both in vitro and in vivo (Eversmann et al.,, 2003; Berdondini et al.,, 2005; Frey et al.,, 2010; Ballini et al.,, 2014; Müller et al.,, 2015; Yuan et al.,, 2016; Lopez et al.,, 2016; Jun et al., 2017b, ; Dimitriadis et al.,, 2018). This is a significant advancement as it enables, for the first time, the systematic investigation of interactions between neurons in large circuits. Understanding these interactions will contribute to learning more about how neural circuitry is altered by cellular changes in diseases, injury, and during pharmacological interventions.
To appreciate the advantages of recording the activity of many neurons, it is important to emphasize that neural circuits are usually highly diverse and heterogeneous (Hromádka et al.,, 2008; Buzsáki and Mizuseki,, 2014; Panas et al.,, 2015). Not only do they consist of different neuron types, but even within groups of neurons of the same type, the firing rates may differ by orders of magnitude. This observation has been made consistently in vitro and in vivo, and it stands to reason that this has biological relevance. Conventional technologies, which allow simultaneous recording of a handful (rarely more than a hundred) of neurons, severely under-sample highly heterogeneous populations. If the recorded neurons are not representative of the whole population, both experimental accuracy and reproducibility between experiments will be negatively affected. Moreover, dense recording systems increase the fraction of neurons isolated in a local population, to a level that was, so far, only accessible with calcium imaging.
A further advantage of recording many neurons at once is that it can be an effective way of probing neural excitability and connectivity, using functional interactions as a proxy measure for the effects of synaptic interactions. In vitro assays are particularly suited for investigation of functional interactions, as they can be augmented with stimulation, fluorescent labeling and targeted optogenetic stimulation (Zhang et al.,, 2009; Obien et al.,, 2015). A combination of dense multielectrode arrays and imaging technologies could allow phenotyping at the level of single cells, potentially in combination with further modalities such as gene expression profiling. The high yield of such approaches thus provides entirely new possibilities for systematic assessment of the roles of different genotypes and of drug effects.
The analysis of single neuron activity requires the correct assignment of each detected spike to the originating neuron, a process called spike sorting. In this chapter, we will provide an overview of the most frequently employed methods for the spike sorting for large-scale, dense multielectrode arrays. While many of the issues discussed will also apply to dense in vivo probes, the focus is on in vitro arrays, because they typically provide a large surface area evenly covered with recording channels, which is advantageous for spike sorting. A major additional challenge in in vivo recordings is tissue movement, which causes the signals of neurons to drift over time. For an excellent review of the challenges encountered in vivo, and of methodology for conventional recording devices with fewer channels, the reader may consult Rey et al., (2015).
In the first section, we will discuss in more detail the technical and practical issues that are introduced when moving from conventional devices with tens of channels to larger, more dense systems. Next, we will introduce the main components of modern spike sorting pipelines, and then discuss each component and existing algorithms in detail. Finally, we will provide an overview of approaches for validation of the quality of these algorithms.
2 Challenges for large-scale spike sorting
On both conventional and high density recording devices, electrodes will usually pick up the activity of multiple neurons. While it is possible to directly analyse the multi-unit activity (MUA) from each channel, spike sorting is required to resolve single-unit activity (SUA). Spike sorting resembles the classic “cocktail party” problem: to isolate the voice of a single speaker in a crowd of people. Since the recorded spike waveforms differ in shape and amplitude among neurons, the resulting signal can be de-mixed using either dimensionality reduction paired with clustering or spike templates along with template matching. These approaches have been successfully employed on conventional devices with few, spatially well separated channels. On large-scale, dense arrays, however, these traditional methods become more difficult both computationally and algorithmically. Instead of finding a single voice in a crowd, the challenge is to isolate the voices of thousands of speakers in a room equipped with thousands of microphones. Overcoming this challenge is imperative as wrong assignments can severely bias subsequent analysis of neuronal populations (Ventura and Gerkin,, 2012).
Spike sorting is a tractable problem for conventional extracellular recordings as it is commonly done for each recording channel separately. In this case, only a small number of neurons are expected to contribute to the signal on each channel, which allows the use of precise, but computationally more costly algorithms. Also, most existing algorithms for spike sorting still include an element of manual intervention to adjust or improve sorting results. These traditional algorithms struggle when faced with large-scale, dense arrays.
On dense arrays, a single action-potential from a neuron is visible on multiple, nearby channels. As a result, spike sorting on single channels is no longer appropriate. Removing duplicate events is feasible in principle, but becomes challenging when nearby neurons are firing with high synchrony. Poor treatment of duplicate removal can lead to false exclusions of action potentials or retention of multiple spikes from the same action potential.
Conventional spike sorting algorithms also struggle with the sheer volume of data large-scale arrays produce. For instance, a recording from 4,096 channels with 18kHz sampling rate yields about 140 megabytes per second, or over 8 gigabytes per minute. Simply reading this data volume from hard disk into memory for analysis can be a severe bottleneck in any spike sorting pipeline. In addition, the massive data volume prevents extensive manual curation of spike sorting results. Highly automated pipelines with minimal need for intervention are needed to overcome these challenges and to fully exploit the capabilities of dense arrays.
3 From raw data to single neuron activity
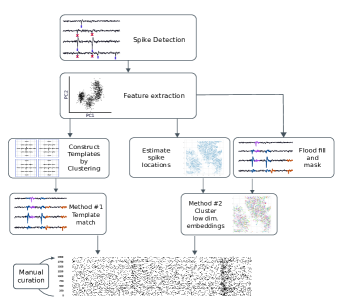
A typical spike sorting pipeline begins with the detection of candidate events followed by some method of assigning these events to specific neurons. (Lewicki,, 1998; Rey et al.,, 2015). On large-scale arrays, two approaches have emerged as particularly suitable. One method is based on creating spike templates and then performing template matching. The other method relies on feature extraction and clustering, using both the spike shape and estimated location of the event. A summary of the steps required to obtain sorted spikes from raw data is shown in Figure 1. Each of these steps is discussed in more detail below.
3.1 Spike detection
Spikes in the raw signal take the form of biphasic deflections from a baseline level. They can be found through detection of threshold crossings and by using additional shape parameters such as the presence of a biphasic shape as acceptance criteria. As the noise levels may vary among channels and over time, the threshold is usually defined relative to the noise level, which is estimated from portions of the raw signal that do not contain spikes. It is worth noting that signal fluctuations in extracellular data are typically highly non-Gaussian. As a result, a noise estimate based on percentiles is more accurate and also easier to obtain, as opposed to computing the signal variance (Fee et al.,, 1996; Muthmann et al.,, 2015).
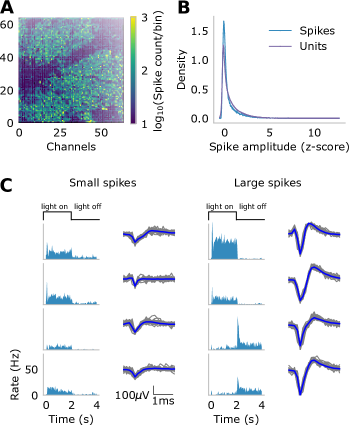
The choice of the detection threshold determines which events are retained for further analysis. Spikes from well-detected neurons are easily identifiable, but deflections with amplitudes closer to the background noise level are harder to isolate. Since there is typically no clear-cut separation between spikes and noise, events detected close to the threshold may originate from neurons for which only an incomplete activity record can be obtained. The magnitude of electrical noise, which can be estimated when recording from an empty array, is usually much smaller than the magnitude of the fluctuations recorded in the absence of clearly visible spiking activity (Muthmann et al.,, 2015). This indicates that a large component of the recorded signal fluctuations are due to neural activity, such as neurons located further away from the electrode, or smaller events such as currents during synaptic transmission. The analysis of recordings from the retina shows that even very small detected signals may reflect activity that is typical of stimulus-evoked responses from retinal ganglion cells, hence carries signatures of neural activity rather than noise (Figure 2).
As a result, the detection step significantly affects the subsequent isolation of single neuron activity. Choosing a high detection threshold is not an ideal solution as this will potentially leave valid spikes undetected. In contrast, a low threshold guarantees reliable detection of neurons with stronger signals, but also increases the fraction of false positives. As a good compromise, a strategy can be adopted to detect events with a low threshold, and to subsequently discard unreliable units. This can either be done after detection, for instance by using a classifier trained on true spikes and noise events obtained from channels not reporting neural activity (Hilgen et al.,, 2017), or by removing sorted units with a small number of spikes or poor clustering metric scores post spike sorting (Hill et al.,, 2011).
Recently, a new method for spike detection using a pre-trained neural network was introduced by Lee et al., (2017). This method was shown to outperform conventional threshold-based methods on simulated ground truth data, in particular by achieving a lower false positive rate. When run on a modern GPU, a neural-network based method is also much faster. This is a very promising avenue, although the considerations regarding detection thresholds outlined above still remain relevant.
3.2 Dealing with duplicate spikes
Unlike in conventional recordings, on dense arrays, spikes are detectable on multiple channels. These duplicate spikes pose two significant problems for traditional spike sorting algorithms. First, the amount of computation and memory used for processing each detected event increases with the number of duplicates. Second, the rate of misclassification in spike sorting potentially increases since each duplicate spike must be sorted into the same event.
To avoid the pitfalls associated with duplicate spikes, it is suggested to identify and remove duplicates during detection. One naive method for duplicate removal is to remove all but the largest amplitude spike in a radius that encompasses the spatial footprint of the event. This method will remove almost every duplicate event, but as the radius of duplicate removal increases, so does the number of spikes removed that are not associated with the original event. A more rigorous method for duplicate removal involves keeping the largest amplitude spikes and removing all spikes in a radius that have decayed in amplitude. This method allows for the separating of near-synchronous events that are in the same spatial area of the array. Its success, however, relies on the assumption that the timing of spikes from the same event on nearby electrodes is almost identical and only weakly influenced by noise and that the signal spatially decays away from its current source (Hagen et al.,, 2015).
3.3 Feature Extraction
The relevant signal a spike causes in extracellular recordings lasts around 3 ms, which, depending on the acquisition rate, may correspond to up to 90 data points per event. However, spike shapes are highly redundant and can be efficiently represented in a low dimensional space. Thus, an appropriate projection method can be used to compute a small number of features for each event, which can be more efficiently clustered than raw waveforms.
The most common feature extraction method for extracellular spikes is Principal Component Analysis (PCA), performed on whitened and peak-aligned spike waveforms. PCA finds principal components, or orthogonal basis vectors, whose directions maximize the variance in the data. Extracellular spikes can be summarized well by just 3-4 principal components, a manageable dimensionality for most clustering algorithms. (Adamos et al.,, 2008). Other less frequently used methods include independent component analysis (ICA) (Hermle et al.,, 2004) and wavelet decomposition (Quiroga et al.,, 2004). A comparison of these methods showed that the performance of sorting algorithms depends not only on the feature extraction method employed, but also on the clustering algorithm (Quiroga et al.,, 2004). In practice, the comparably low computational cost and relative effectiveness of PCA in discriminating between different neurons and neuron types makes it particularly suitable for large scale recordings (Adamos et al.,, 2008). To reduce memory load, the PCA decomposition can be evaluated for a subset of events from a large recording and all events can be projected along the chosen dimensions efficiently in batches (Hilgen et al.,, 2017).
3.4 Clustering spatio-temporal event footprints
There are five fundamental problems with the clustering phase. The first problem is that the extracellular waveform of neurons are known to change amplitude and shape during bursting (Fee et al.,, 1996). The second problem is that some recorded waveforms are distorted by overlapping action potentials from synchronous, spatially-local events. This occurs frequently in dense arrays and usually exist as outliers in the chosen feature space. The third problem is that electrodes can drift in the extracellular medium, changing the relative position of each neuron to the electrodes. Drift distorts waveform shapes over the duration of the recording. The fourth problem is that the duplication of spikes over neighboring channels can lead to refractory period violations or misclassifications. The fifth and final problem is that the number of observed neurons is unknown, which requires the use of non-parametric clustering algorithms or requires the user to estimate the number of neurons for a parametric clustering algorithm.
The choice of the clustering algorithm will be determined by the speed and scalability considerations, by hypotheses over the typical shape of a cluster in this space, and by how well the algorithm can deal with the previously listed problems. Many spike sorting methods cluster by fitting Gaussian Mixture Models (GMMs), modelling the feature density profiles as a sum of Gaussians (Harris et al.,, 2000; Rossant et al.,, 2016), or by fitting a mixture of t-distributions (Shoham et al.,, 2003). The unknown number of actual neurons can be introduced as a latent variable, and the inference problem be solved with the expectation-maximisation (EM) algorithm. Bayesian approaches, which also quantify parameter uncertainty, have also been introduced (Wood and Black,, 2008). These approaches, however, only perform well for single channels and are conceptually and computationally hard to scale up to large, full-chip datasets.
More recent clustering algorithms for spike sorting are density-based. Density-based algorithms generally detect peaks or high-density regions in the feature space that are separated by low-density regions. These algorithms are non-parametric, allowing the classification pipeline to be fully automatic, however, the number of clusters found can depend heavily on both hyper-parameters and the chosen feature space. Density-based clustering algorithms have been implemented for spike sorting with promising results (Hilgen et al.,, 2017; Chung et al.,, 2017).
For dense arrays, an added complication arises since the information contained in event footprints cannot be used directly for sorting spikes, since it is unknown which channels contain responses of a single neuron and how many neurons cause the observed responses. The resulting combinatorial explosion can be dealt with in three ways:
Masked clustering
A straight-forward way to reduce the dimensionality of the clustering problem is to include only channels with detectable responses for each event. Classical expectation maximisation on a mixture model is then possible when the irrelevant parts of the data are masked out and replaced with a tractable noise model (Kadir et al.,, 2014). This strategy produces excellent results with the help of a semi-automated refinement step. (Rossant et al.,, 2016). A main limitation is, however, a super-linear scaling with the number of recordings channels, which makes it less suitable for the latest generations of large-scale arrays.
Template matching
Since the raw recorded signal can be linearly decomposed into a mixture of footprints from different neurons (Segev et al.,, 2004), template matching has been a successful strategy for spike sorting, and implementations are available that scale up to thousands of channels (Pachitariu et al.,, 2016; Lee et al.,, 2017; Yger et al.,, 2018). This approach has two steps. First a collection of spatio-temporal footprints is obtained in a single pass over the data and dimensionality reduction and clustering is used to build templates for single neurons. In a second pass, all events are assigned to the most likely template or combination of templates in the case of temporally overlapping events.
A major advantage of template matching that temporally overlapping spikes are naturally accounted for through addition of two relevant templates. This makes it very suitable for recordings with high firing rates and correlations between nearby neurons. A potential limitation is that neurons spiking at very low rates may remain undiscovered as no reliable template can be built through averaging. Moreover, current implementations require a final manual curation step. This is, however, simplified by correcting the assignment based on templates, which can be merged or split, rather than based on single events.
Spike localisation
As explained above, the spatial spike footprint allows event localisation through an estimation of the barycentre from the peak event amplitudes in nearby channels. This produces density maps with clear, isolated peaks in event density, which represent spikes from single or multiple, nearby neurons (see Figure 2 for an example). A two-dimensional density map can be clustered very efficiently, and the combination of locations and waveform features obtained through dimensionality reduction allows successful separation of nearby neurons. Density-based clustering algorithms have been successfully employed to solve this task: DPClus, based on the identification of density peaks (Jun et al., 2017a, ), ISO-SPLIT to grow uni-modal clusters from small seeds (Chung et al.,, 2017) and Mean Shift, which herds data points towards high-density areas (Hilgen et al.,, 2017).
Of all methods discussed here, spike localisation and clustering potentially has the best computational performance, since the actual computation is performed on a data set with much lower dimensionality than the original data (Hilgen et al.,, 2017; Jun et al., 2017a, ). Because the number of dimensions in the clustering step has to be kept small, it also discards useful information. However, usually locations and spatio-temporal waveform features exhibit substantial redundancy (Hilgen et al.,, 2017), making this approach the most suitable for very large arrays.
4 Evaluation
The evaluation of spike detection and sorting quality is complicated by data volume and complexity, which makes both manual and automated curation challenging. It is however possible to assess the quality of an algorithm using data with ground truth annotation. Moreover, methods for post-hoc quality assessment of desirable properties of single units can be used to accept or reject units found through spike sorting.
Specifically, the desired result of a spike sorting pipeline to minimise the false detection of noise as spikes (false positives in detection), and the number of real spikes left undetected (false negatives in detection). Moreover, it should not assign spikes to the wrong neuron, hence it should minimise false positives and negatives in a cluster assignment.
When ground truth annotations are available, false positives and false negatives can be easily counted. A direct, but technically challenging method to obtain ground truth information, is the simultaneous recording of a single neuron, together with an array recording, which will then be analysed using the spike sorting algorithm in question. Three such data sets recorded with dense arrays are currently available, two from the rat cortex recorded in vivo (Neto et al.,, 2016; Marques-Smith et al.,, 2018), and one from the mouse retina recorded in vitro (Yger et al.,, 2018). In both cases, a single juxtacellular electrode placed very closely to the array reliably recorded all spikes from a single neuron. A systematic analysis of spike sorting has shown a clear relationship between measured spike amplitude and classification accuracy with errors strongly increasing for events smaller than 50 mV (Yger et al.,, 2018). This important result can help motivate exclusion of units with weaker signals.
Ground truth for spike sorting can also be produced by simulations. Recently, it has become possible to simulate a complete biophysical forward model for recorded extracellular potentials in neural tissue (Hagen et al.,, 2015). This has produced several data sets that are now used to benchmark spike sorting algorithms (see e.g. Lee et al., (2017)). In another study, ground truth data was generated by superimposing synthetic spikes onto a recording from an empty array. This data was used to evaluate the effect of noise on event localisation accuracy and to discover that localisation is inevitably a trade-off between position uncertainty and bias (Muthmann et al.,, 2015). It is an open question, however, how well results collected from simulated data generalise, since the precise noise model, which may differ between recording systems, impacts spike sorting algorithm performance (Muthmann et al.,, 2015).
Finally, for cases where no ground truth data is available, Hill et al., (2011) proposed a set of metrics that should accompany all spike sorting methods as an evaluation of their reliability. Their metrics, applied a posteriori, are based on different features of the sorted dataset, which can be summarised as follows:
-
•
The waveforms in each cluster. The average waveform can present non-biological features, hinting that the cluster may be a collection of wrongly detected events. Additionally, if properties of the typical waveform change over time, this may be a sign of neurons drifting away from their initial position on the chip. Finally, anomalous variability of each feature above the noise level may be a sign that multiple neurons contributed to the same cluster.
-
•
The times of all spikes in a cluster. Violations of the refractory period show the cluster contains false positives: these can be studied via the autocorrelation function or inter-spike histogram of each cluster.
-
•
The amplitudes of action potentials. A sharp drop in the amplitude distribution, caused by the detection threshold, signifies that the latter has introduced an artificial bias.
-
•
The separation between pairs of clusters. Ample, sharp interfaces between clusters mean the properties of each neuron’s spikes overlap in the selected feature space. If this occurs, there will be a theoretical minimum of false positives and negatives due to the incorrect assignment of events to the wrong cluster.
The last point can be evaluated by re-examining a group of clustered neurons with a mixture model (usually Gaussian), which can be fit using more features than the original algorithm. Assuming that this fit is at least as reliable as the original sorting algorithm, a comparison of the two assignments is informative regarding the reliability of each unit. A statistic summarizing all these tests can then be used to exclude events and units post hoc. Using this method, detection and clustering parameters do not have to be adjusted carefully prior to each analysis.
5 Outlook
In this chapter, we discussed the existing methodology for recovering single neuron activity from high density recordings and the challenges and problems that each approach faces. Six freely available spike sorting pipelines for large-scale extracellular arrays and the methods they use are summarised in Table 1. For more information on their unique advantages and disadvantages, please review their associated references.
| Name and reference | Method | Notes | ||
|---|---|---|---|---|
|
TM | GPU support; MATLAB based; semi-automated final curation. | ||
|
TM | Neural network-based detection (GPU); outlier triaging; template matching; clustering. | ||
|
SL+D | Fast and scalable; tested on multiple array geometries | ||
|
D | Fully automatic; scalable; graphical user interface; unique clustering method | ||
|
SL+D | Probe drift correction; GPU support. | ||
|
TM | GPU support; tested on many datasets; robust to overlapping spikes; graphical user interface. |
Since inaccurate detection and sorting can influence subsequent analysis of neural populations (Ventura and Gerkin,, 2012), manual curation steps are often still required to guarantee good data quality. However, the recent methods we summarised in this chapter take significant steps in increasing the speed, automatisation, and accuracy of the spike sorting pipeline. Looking forward, it may be possible to apply novel machine learning techniques to improving spike sorting. This has already been put into practice with a recent spike sorting algorithm where a neural network is used to improve detection of neural events (Lee et al.,, 2017). Although neural networks are showing promising results in detection, it may be possible to find new breakthroughs in both feature extraction and in classification using these methods. Moreover, a neural network approach may have the potential of encompassing all of the spike sorting steps within a single model. A challenge when using these machine learning algorithms, however, is the difficulty of obtaining ground truth data, which is poorly available and usually under specific experimental conditions that may not generalize to other data sets.
Increased automation also means more work is needed in developing reliable methods for validation and quality control of spike sorting results. The introduction of synthetic (Hagen et al.,, 2015) and experimetal ground truth datasets (Neto et al.,, 2016; Yger et al.,, 2018) is an important step forward in this direction. A standardisation, both of the sorting pipeline and of its evaluation, should be considered among the next objectives of the spike sorting community. A joint effort should be made in order to guarantee that methods are intuitive to use and results are easy to compare.
References
- Adamos et al., (2008) Adamos, D. A., Kosmidis, E. K., and Theophilidis, G. (2008). Performance evaluation of pca-based spike sorting algorithms. Computer Methods and Programs in Biomedicine, 91(3):232–244.
- Ballini et al., (2014) Ballini, M., Muller, J., Livi, P., Chen, Y., Frey, U., Stettler, A., Shadmani, A., Viswam, V., Jones, I. L., Jackel, D., Radivojevic, M., Lewandowska, M. K., Gong, W., Fiscella, M., Bakkum, D. J., Heer, F., and Hierlemann, A. (2014). A 1024-channel CMOS microelectrode array with 26,400 electrodes for recording and stimulation of electrogenic cells in vitro. IEEE Journal of Solid-State Circuits, 49(11):2705–2719.
- Berdondini et al., (2005) Berdondini, L., van der Wal, P. D., Guenat, O., de Rooij, N. F., Koudelka-Hep, M., Seitz, P., Kaufmann, R., Metzler, P., Blanc, N., and Rohr, S. (2005). High-density electrode array for imaging in vitro electrophysiological activity. Biosensors & Bioelectronics, 21(1):167–74.
- Bestel et al., (2012) Bestel, R., Daus, A. W., and Thielemann, C. (2012). A novel automated spike sorting algorithm with adaptable feature extraction. Journal of Neuroscience Methods, 211(1):168–178.
- Buzsáki and Mizuseki, (2014) Buzsáki, G. and Mizuseki, K. (2014). The log-dynamic brain: how skewed distributions affect network operations. Nature Reviews Neuroscience, 15(4):264.
- Chung et al., (2017) Chung, J. E., Magland, J. F., Barnett, A. H., Tolosa, V. M., Tooker, A. C., Lee, K. Y., Shah, K. G., Felix, S. H., Frank, L. M., and Greengard, L. F. (2017). A fully automated approach to spike sorting. Neuron, 95(6):1381–1394.
- Dimitriadis et al., (2018) Dimitriadis, G., Neto, J. P., Aarts, A., Alexandru, A., Ballini, M., Battaglia, F., Calcaterra, L., David, F., Fiath, R., Frazao, J., et al. (2018). Why not record from every channel with a cmos scanning probe? bioRxiv, page 275818.
- Eversmann et al., (2003) Eversmann, B., Jenkner, M., Hofmann, F., Paulus, C., Brederlow, R., Holzapfl, B., Fromherz, P., Merz, M., Brenner, M., Schreiter, M., Gabl, R., Plehnert, K., Steinhauser, M., Eckstein, G., Schmitt-landsiedel, D., and Thewes, R. (2003). A 128 128 CMOS Biosensor Array for Extracellular Recording of Neural Activity. IEEE Journal of Solid-State Circuits, 38(12):2306–2317.
- Fee et al., (1996) Fee, M. S., Mitra, P. P., and Kleinfeld, D. (1996). Variability of extracellular spike waveforms of cortical neurons. Journal of Neurophysiology, 76(6):3823–3833.
- Frey et al., (2010) Frey, U., Sedivy, J., Heer, F., Pedron, R., Ballini, M., Mueller, J., Bakkum, D., Hafizovic, S., Faraci, F. D., Greve, F., Kirstein, K. U., and Hierlemann, A. (2010). Switch-matrix-based high-density microelectrode array in CMOS technology. IEEE Journal of Solid-State Circuits, 45(2):467–482.
- Hagen et al., (2015) Hagen, E., Ness, T. V., Khosrowshahi, A., Sørensen, C., Fyhn, M., Hafting, T., Franke, F., and Einevoll, G. T. (2015). ViSAPy: A Python tool for biophysics-based generation of virtual spiking activity for evaluation of spike-sorting algorithms. Journal of Neuroscience Methods, 245:182–204.
- Harris et al., (2000) Harris, K. D., Henze, D. A., Csicsvari, J., Hirase, H., and Buzsáki, G. (2000). Accuracy of tetrode spike separation as determined by simultaneous intracellular and extracellular measurements. Journal of Neurophysiololgy, 84(1):401–414.
- Hermle et al., (2004) Hermle, T., Schwarz, C., and Bogdan, M. (2004). Employing ica and som for spike sorting of multielectrode recordings from cns. Journal of Physiology-Paris, 98(4-6):349–356.
- Hilgen et al., (2017) Hilgen, G., Sorbaro, M., Pirmoradian, S., Muthmann, J.-O., Kepiro, I. E., Ullo, S., Ramirez, C. J., Encinas, A. P., Maccione, A., Berdondini, L., et al. (2017). Unsupervised spike sorting for large-scale, high-density multielectrode arrays. Cell Reports, 18(10):2521–2532.
- Hill et al., (2011) Hill, D. N., Mehta, S. B., and Kleinfeld, D. (2011). Quality metrics to accompany spike sorting of extracellular signals. Journal of Neuroscience, 31(24):8699–705.
- Hromádka et al., (2008) Hromádka, T., Deweese, M. R., and Zador, A. M. (2008). Sparse representation of sounds in the unanesthetized auditory cortex. PLoS Biology, 6(1):e16.
- (17) Jun, J. J., Mitelut, C., Lai, C., Gratiy, S., Anastassiou, C., and Harris, T. D. (2017a). Real-time spike sorting platform for high-density extracellular probes with ground-truth validation and drift correction. bioRxiv, page 101030.
- (18) Jun, J. J., Steinmetz, N. A., Siegle, J. H., Denman, D. J., Bauza, M., Barbarits, B., Lee, A. K., Anastassiou, C. A., Andrei, A., Aydın, Ç., et al. (2017b). Fully integrated silicon probes for high-density recording of neural activity. Nature, 551(7679):232.
- Kadir et al., (2014) Kadir, S. N., Goodman, D. F., and Harris, K. D. (2014). High-dimensional cluster analysis with the masked em algorithm. Neural Computation, 26(11):2379–2394.
- Lee et al., (2017) Lee, J. H., Carlson, D. E., Razaghi, H. S., Yao, W., Goetz, G. A., Hagen, E., Batty, E., Chichilnisky, E., Einevoll, G. T., and Paninski, L. (2017). Yass: Yet another spike sorter. In Advances in Neural Information Processing Systems, pages 4005–4015.
- Lewicki, (1998) Lewicki, M. S. (1998). A review of methods for spike sorting: the detection and classification of neural action potentials. Network, 9(January):R53–R78.
- Lopez et al., (2016) Lopez, C. M., Mitra, S., Putzeys, J., Raducanu, B., Ballini, M., Andrei, A., Severi, S., Welkenhuysen, M., Van Hoof, C., Musa, S., et al. (2016). 22.7 a 966-electrode neural probe with 384 configurable channels in 0.13 m soi cmos. In Solid-State Circuits Conference (ISSCC), 2016 IEEE International, pages 392–393. IEEE.
- Marques-Smith et al., (2018) Marques-Smith, A., Neto, J. P., Lopes, G., Nogueira, J., Calcaterra, L., Frazão, J., Kim, D., Phillips, M. G., Dimitriadis, G., and Kampff, A. R. (2018). Recording from the same neuron with high-density cmos probes and patch-clamp: a ground-truth dataset and an experiment in collaboration. bioRxiv, page 370080.
- Müller et al., (2015) Müller, J., Ballini, M., Livi, P., Chen, Y., Radivojevic, M., Shadmani, A., Viswam, V., Jones, I. L., Fiscella, M., Diggelmann, R., Stettler, A., Frey, U., Bakkum, D. J., Hierlemann, A., Muller, J., Ballini, M., Livi, P., Chen, Y., Radivojevic, M., Shadmani, A., Viswam, V., Jones, I. L., Fiscella, M., Diggelmann, R., Stettler, A., Frey, U., Bakkum, D. J., and Hierlemann, A. (2015). High-resolution CMOS MEA platform to study neurons at subcellular, cellular, and network levels. Lab on a Chip, 15(13):2767–2780.
- Muthmann et al., (2015) Muthmann, J.-O., Amin, H., Sernagor, E., Maccione, A., Panas, D., Berdondini, L., Bhalla, U. S., and Hennig, M. H. (2015). Spike Detection for Large Neural Populations Using High Density Multielectrode Arrays. Frontiers in Neuroinformatics, 9(December):1–21.
- Neto et al., (2016) Neto, J. P., Lopes, G., Frazão, J., Nogueira, J., Lacerda, P., Baião, P., Aarts, A., Andrei, A., Musa, S., Fortunato, E., et al. (2016). Validating silicon polytrodes with paired juxtacellular recordings: method and dataset. Journal of Neurophysiology, 116(2):892–903.
- Obien et al., (2015) Obien, M. E. J., Deligkaris, K., Bullmann, T., Bakkum, D. J., and Frey, U. (2015). Revealing neuronal function through microelectrode array recordings. Frontiers in Neuroscience, 9(JAN):423.
- Pachitariu et al., (2016) Pachitariu, M., Steinmetz, N. A., Kadir, S. N., Carandini, M., and Harris, K. D. (2016). Fast and accurate spike sorting of high-channel count probes with kilosort. In Advances in Neural Information Processing Systems, pages 4448–4456.
- Panas et al., (2015) Panas, D., Amin, H., Maccione, A., Muthmann, O., van Rossum, M., Berdondini, L., and Hennig, M. H. (2015). Sloppiness in Spontaneously Active Neuronal Networks. Journal of Neuroscience, 35(22):8480–8492.
- Quiroga et al., (2004) Quiroga, R. Q., Nadasdy, Z., and Ben-Shaul, Y. (2004). Unsupervised spike detection and sorting with wavelets and superparamagnetic clustering. Neural Computation, 16(8):1661–87.
- Rey et al., (2015) Rey, H. G., Pedreira, C., and Quian Quiroga, R. (2015). Past, present and future of spike sorting techniques. Brain Research Bulletin, 119:106–117.
- Rossant et al., (2016) Rossant, C., Kadir, S. N., Goodman, D. F. M., Schulman, J., Hunter, M. L. D., Saleem, A. B., Grosmark, A., Belluscio, M., Denfield, G. H., Ecker, A. S., Tolias, A. S., Solomon, S., Buzsáki, G., Carandini, M., and Harris, K. D. (2016). Spike sorting for large, dense electrode arrays. Nature Neuroscience, 19(4):634–641.
- Segev et al., (2004) Segev, R., Goodhouse, J., Puchalla, J., and Berry II, M. J. (2004). Recording spikes from a large fraction of the ganglion cells in a retinal patch. Nature Neuroscience, 7(10):1155.
- Shoham et al., (2003) Shoham, S., Fellows, M. R., and Normann, R. A. (2003). Robust, automatic spike sorting using mixtures of multivariate t-distributions. Journal of Neuroscience Methods, 127(2):111 – 122.
- Ventura and Gerkin, (2012) Ventura, V. and Gerkin, R. C. (2012). Accurately estimating neuronal correlation requires a new spike-sorting paradigm. Proceedings of the National Academy of Sciences, 109(19):7230–7235.
- Wood and Black, (2008) Wood, F. and Black, M. J. (2008). A nonparametric bayesian alternative to spike sorting. Journal of Neuroscience Methods, 173(1):1–12.
- Yger et al., (2018) Yger, P., Spampinato, G. L., Esposito, E., Lefebvre, B., Deny, S., Gardella, C., Stimberg, M., Jetter, F., Zeck, G., Picaud, S., et al. (2018). A spike sorting toolbox for up to thousands of electrodes validated with ground truth recordings in vitro and in vivo. eLife, 7:e34518.
- Yuan et al., (2016) Yuan, X., Kim, S., Juyon, J., D’Urbino, M., Bullmann, T., Chen, Y., Stettler, A., Hierlemann, A., and Frey, U. (2016). A microelectrode array with 8,640 electrodes enabling simultaneous full-frame readout at 6.5 kfps and 112-channel switch-matrix readout at 20 ks/s. In VLSI Circuits (VLSI-Circuits), 2016 IEEE Symposium on, pages 1–2. IEEE.
- Zhang et al., (2009) Zhang, J., Laiwalla, F., Kim, J. A., Urabe, H., Van Wagenen, R., Song, Y.-K., Connors, B. W., Zhang, F., Deisseroth, K., and Nurmikko, A. V. (2009). Integrated device for optical stimulation and spatiotemporal electrical recording of neural activity in light-sensitized brain tissue. Journal of neural engineering, 6(5):055007.