280 \volnumber4
M.A. Burlak, I.M. Volkov and N.P. Ikonnikova
Russia, 22email: hwp@yandex.ru
Absolute parameters and period variation in a semidetached eclipsing variable V2247 Cyg
Abstract
We aim to determine the absolute parameters of the components of a poorly studied Algol-type eclipsing binary V2247 Cyg. The data analysis is based on our numerous precise photometric observations and low resolution spectra. The photometric solution reveals a semi-detached configuration with a less-massive component filling its Roche lobe. The mass ratio, inclination, effective temperatures, and fractional radii were determined. Masses and radii of the components were obtained by a non-direct method. The Eclipse Time Variation (ETV) diagram revealed the period changes.
keywords:
stars: binaries: eclipsing – stars: binaries: close – stars: interstellar reddening – stars: fundamental parameters1 Introduction
Algol-type stars (EA) are eclipsing binaries consisting of spherical or ellipsoidal components and characterized by light curves (LCs) in which it is possible to specify the beginning and the end of eclipses. Algols are detached if both components are inside corresponding Roche lobes and semi-detached if one of the components fills its Roche lobe and loses matter. If the light changes between eclipses due to the gravitational deformation, we can estimate the mass ratio of the components without involving spectral studies. The analysis of multicolour LCs of Algols (EA) provides absolute parameters for their components which make possible clarifying the evolutionary status of the eclipsing binary.
The star BD +33 4035 =10.9 mag was designated as V2247 Cyg (EA) in the 76th name-list of variable stars, Kazarovetz et al.(2001), based on a private communication of N.E. Kurochkin and V.P. Goranskij, 1999, hereinafter KG. Due to the lack of data on the spectroscopic orbit of the object, we estimated the absolute parameters such as semi-major axes, radii and masses by the non-direct method described in Volkov et al. (2017). The precision of these values is not better than 10 percents, but it is good enough to find out that the location of the components on the diagrams given at the end of this article coincides with that of other binaries with well known parameters. Another aim of this work is to construct an ETV diagram for the star using our own and archive observations and to interpret the orbital period long-term change first found in this study.
2 Observations and data reduction
UBVRcIc photometry. The main set of observations of V2247 Cyg was obtained in 2013-2017 at the Crimean station of the Sternberg Astronomical Institute (SAI) with the 0.5-m f/4 Maksutov telescope (AZT-5) equipped with a CCD camera Apogee Alta U16M. All reductions and aperture photometry were made using the MaximDL software. The observational data were reduced to the standard Johnson-Cousins photometric system according to the following linear formulae:
| (1) |
where index represents instrumental magnitudes of the observed star and refers to the magnitudes of the standard star. The reduction coefficients were obtained by averaging the results of our observations of the standard area PG1633+099 of Landolt (1992) and observations of M67 performed by D.Yu. Tsvetkov.
The CCD photometer equipped with a VersArray 512UV designed by one of the authors was used to make a calibration of the star in the standard Johnson-Cousins system on August 11, 2017. An equatorial standard GSC 543 227 was observed, whose magnitudes were taken from Landolt (2009) and from Moffett & Barnes (1979), where the star was designated as 113 466. The observations were carried out with a Zeiss-600 reflector located at Mt. Koshka, Crimean Astrophysical Observatory(CrAO).
Photoelectric observations. The 0.6-m Zeiss f/12.5 Cassegrain telescope installed at the Crimean station of SAI equipped with the photometer with a photomultiplier EMI 9789 (PMT), constructed by Lyutyj (1971), was used to get full LCs. This photometer has an instrumental system much closer to that of Johnson than AZT-5 which has glass elements in its optical path such as a meniscus and a corrector. So we used these observations to check our AZT-5 -observations and found good coincidence.
For both sets of observations with AZT-5 and PMT the only reference star GSC 2695 1362(=11.24, =0.40) was used. No variability of the star was detected during the whole period of the observations.
The log of and observations is given in Table 1.
| Year | JD | N | System | Telescope |
|---|---|---|---|---|
| 2400000+… | ||||
| 2013 | 56492-56495 | 1401 | AZT-5, SAI | |
| 2014 | 56849-56857 | 2675 | AZT-5, SAI | |
| 2015 | 57196-57240 | 5174 | AZT-5, SAI | |
| 2017 | 57934-57980 | 2820 | AZT-5, SAI | |
| 2017 | 57979-57994 | 25 | PMT, SAI |
Spectral observations. Low-resolution spectra of V2247 Cyg were obtained at the 1.25-m reflector of the SAI Crimean station. We used a diffraction spectrograph with a 600 lines/mm grating. The slit width was 4′′. The detector was an ST–402 CCD ( pixels of m). The spectral resolution (FWHM) was 7.4 Å. The spectra cover the wavelength interval from 3900 to 7200 Å. V2247 Cyg was observed on July 21, 30, August 27, and October 12, 2017.
Photographic observations. One extra timing of the primary minimum was obtained from an unpublished study of KG, who measured the star’s magnitudes using 165 photographic plates of the SAI archive and derived a correct period of eclipses by the Lafler-Kinman method, Lafler & Kinman (1965), . These data one can find in the card catalogue of SAI.
The system is listed in the catalogues of eclipsing stars of Malkov et al.(2006) and Avvakumova et al. (2013) which contain no ephemeris for the object. Otero (2008) derived a period of for the system, which perfectly coincides with the KG value.
3 Colour indices, spectra and determination of temperatures of the components
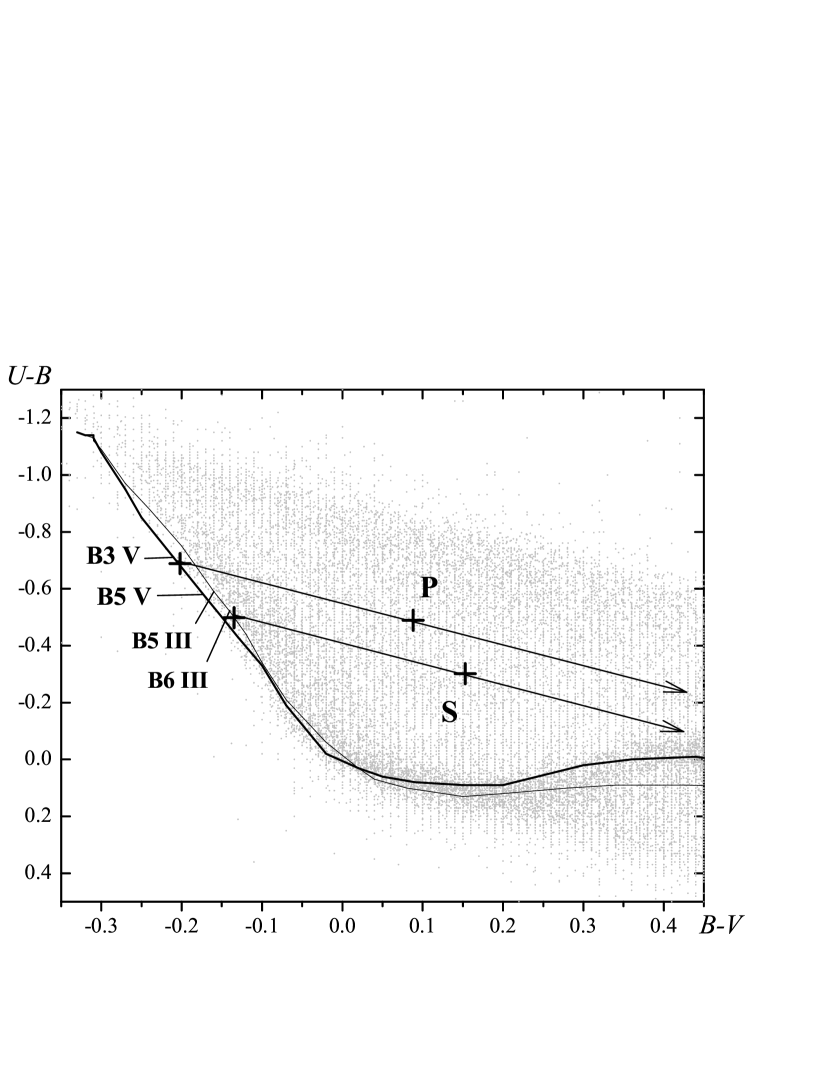
The most important parameters for the current analysis are the temperatures of the components that can be found in the following way. The colour indices of the light loss in the primary and secondary minima are calculated directly from the LCs in different passbands with no additional assumptions. Observed colour indices of the primary and secondary components are dereddened using a two-colour diagram, see Fig. 1, was accepted for the B5 spectral class from Table 11 in Straižys (1992). The colour indices calculated this way are applied to determine the temperatures of the components with the help of well-known calibrations.
| (2) |
For completeness we calculated mean colour indices in both minima and maxima of the LC. They are presented in Table 2. Keep in mind that these data are not dereddened.
| Phase | ||||
|---|---|---|---|---|
| 0.0 | -0.33 | 0.133 | 0.097 | 0.144 |
| 0.25 | -0.43 | 0.102 | 0.072 | 0.115 |
| 0.5 | -0.45 | 0.095 | 0.064 | 0.109 |
| 0.75 | -0.42 | 0.111 | 0.069 | 0.116 |
We derived K and K from Flower (1996). Popper (1980) gives the temperatures that are 2000 K higher for the primary and 800 K higher for the secondary. We can see that the temperatures derived from the calibrations may have an uncertainty up to 1000 K for this range of temperatures. Equal values of interstellar reddening for both components can be obtained only if we attribute the third or fourth class of luminosity to the secondary component. We compared the results with the data from available surveys. A new review of interstellar extinction made by Green et al. (2015) gives for the distance to the star pc (see Table 3). From Schlafly & Finkbeiner (2011) and Schlegel et al. (1998) one can obtain for the total extinction along the given line of sight in the Galaxy. Taking into account the distance to the star we get from an equation in Bonifacio (2000). The errors of these surveys seem to be understated. Nevertheless, we argue that such a discrepancy is not critical and we accept the value that follows from the photometry.
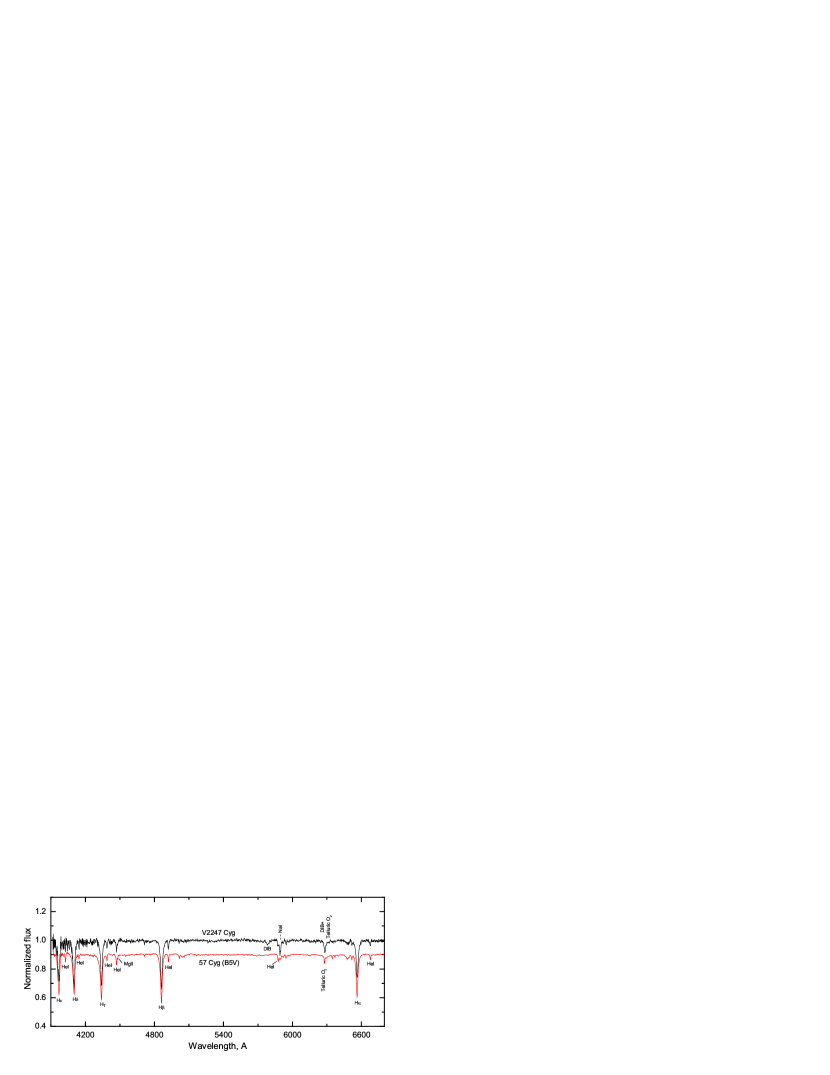
We obtained low-resolution spectra for the star in different phases of the orbital period. We did not detect any significant difference between the spectra obtained in the maximum and at the bottom of the primary minimum. The spectrum is dominated by the Balmer lines of hydrogen and lines of neutral helium. No lines of ionized helium are seen. The presence of He I lines in the absence of He II lines indicates the B spectral class (Gray & Corbally, 2009). The relative intensities of H I and He I lines alone do not allow the precise temperature determination due to possible helium abundance anomalies, which are not rare in B-class stars. The ratio may be of use for specifying the temperature of stars later than B3 and in our study it appeared very helpful as the lines of Si III and Si IV, which are weaker, could not be resolved. Besides, low spectral resolution and a low S/N ratio of our spectral data prevent a precise luminosity classification. The comparison with the stars of spectral classes between B3 and A0, and of luminosity classes from V to III, yields the best agreement for the spectral class B5 V. The uncertainty is about one subclass. The spectrum of V2247 Cyg is similar to that of 57 Cyg (B5 V) (Fig. 2). A B5 V-III spectrum corresponds to a temperature of 15 400 K according to the calibration of Straižys (1982), in good coincidence with photometric results.
In addition to H I and He I absorptions in the spectrum of V2247 Cyg, we identified prominent diffuse interstellar bands (DIBs) centered at 5780 and 6284 and the strong interstellar NaI D doublet. The strengths of these lines in stellar spectra show a positive correlation with the observed extinction, though there is a significant dispersion about the mean relationship (Friedman et al., 2011; Herbig, 1993). To estimate interstellar extinction, one needs to resolve Na I D1 and D2 lines, to measure their strengths separately, and to control the D2/D1 ratio, because the uncertainty is large at the higher Na column densities due to the line saturation. The low resolution of our spectra does not allow us to perform such a procedure. Similar problems arise if we intend to estimate extinction from the equivalent widths of DIBs: the DIB at 6284 is blended with a telluric O2 band consisting of several absorption lines which are not detectable with given resolution, and the DIB at 5780 is too broad and shallow to be measured securely, given a low S/N ratio.
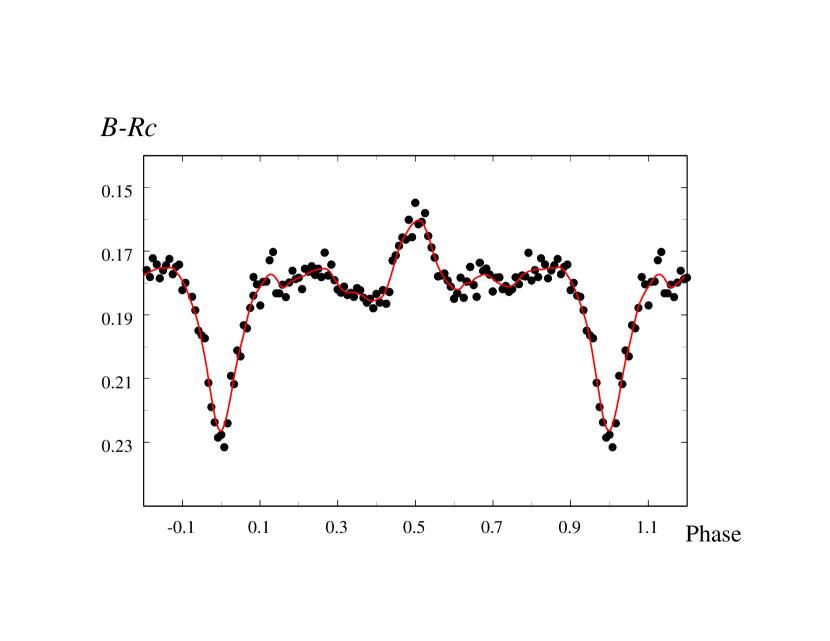
4 Light curves solution
The LCs of the binary show clear evidence for proximity effects, see Fig. 3. So, we used the PHOEBE program of Prša & Zwitter (2005) a to analyze them. The best fit yielded a semidetached system with the secondary filling its Roche lobe. This agrees with the consideration inferred from our photometry that the secondary component has moved far enough in its evolution from the initial main sequence. We got an individual solution for each passband of AZT-5 observations and then repeated the procedure for less numerous PMT observations in 2017. All solutions led to similar parameters: the mass ratio , inclination , effective temperatures , fractional radii , and the potential . Mean weighted values of the parameters are presented in Table 3. The solution of the LCs did not show any presence of a third light and it was assumed to be zero, .
The temperatures of the components were included in solving LCs, as the values obtained from calibrations seemed to have discrepancies of up to 1000K for the considered temperature range, see the previous section. We accepted a temperature of K as the first approximation for the primary component. Solutions provided a confident minimum for the temperatures of the components, K and K, and these are 500 and 1500 K lower than it follows from photometric calibrations. The found temperatures correspond to the spectral types B4-5 V and B8 III-IV in the calibration of Straižys (1982).
Taking into account high accuracy and a large amount of observational data we included the albedo () of the secondary component and the gravity brightening coefficients () as varied parameters into the process of minimizing residuals. We found a shallow minimum for ==0.90 and =0.8, but its reality is uncertain. So we assumed the theoretical values, see Table 3. The albedo of the primary component has a negligible effect on the shape of the LCs and was accepted from the PHOEBE of Prša & Zwitter (2005). The limb-darkening coefficients can be found from temperatures and gravitational accelerations of the components. The best results were obtained with a linear limb-darkening law. The coefficients were derived with the PHOEBE program according to van Hamme (1993). The solution is given in Table 3.
| Parameter | Primary | Secondary |
|---|---|---|
| [∘] | ||
| ) | ||
| (K) | ||
| B4 V | B7 III-IV | |
| (mag) | ||
| 0.6 | 0.6 | |
| 1.0 | 1.0 | |
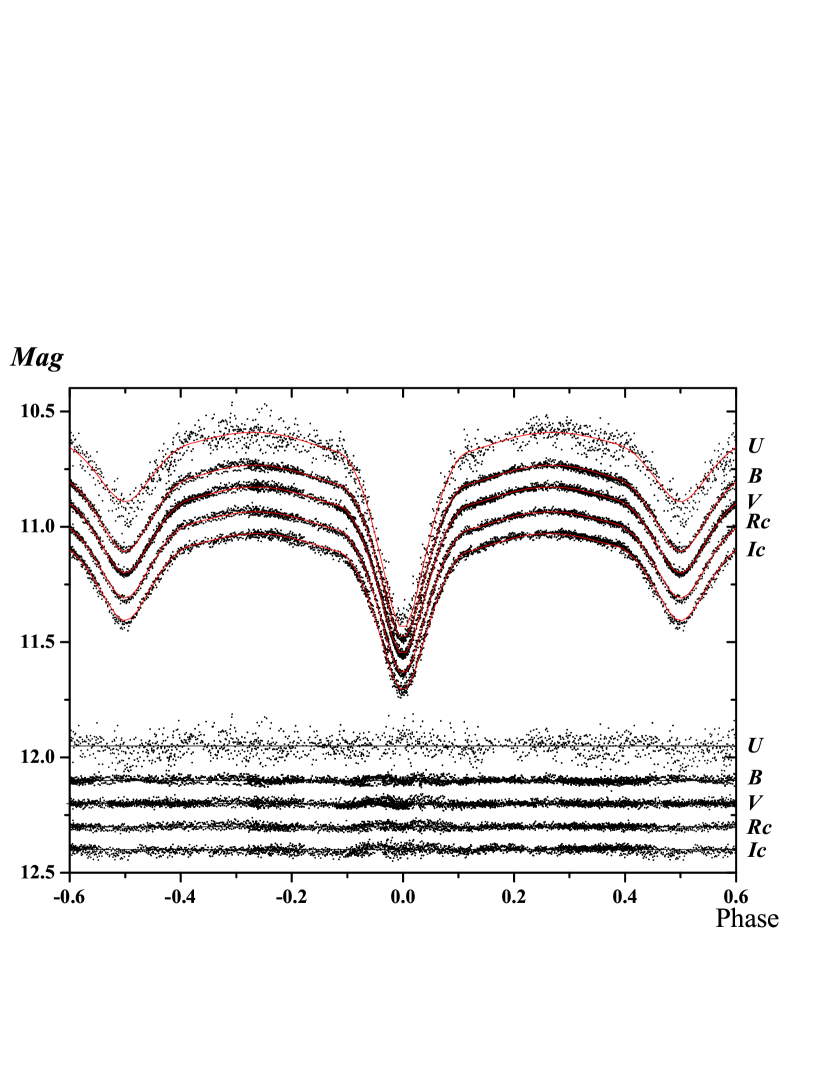
Assuming a normal distribution for the residuals we get a mean error for an individual observational point in every spectral band:
(1305 points), (2358 points), (3720 points), (2308 points), (2326 points).
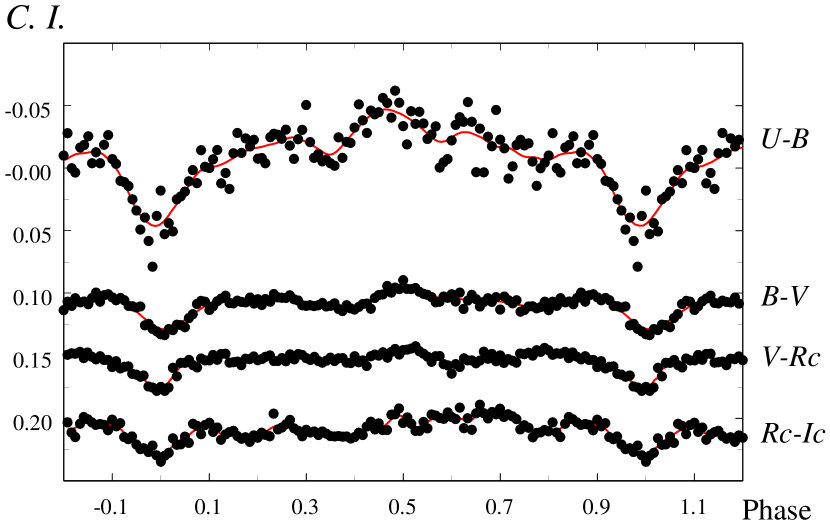
Fig. 4 contains the phased colour curves for the star. The period was split into 120 intervals and the colour data were averaged within each interval. This plot is of interest as it demonstrates some asymmetry, especially in the colour index, which could be attributed to physical processes in the system.
Fig. 5 shows the phased colour curve for V2247 Cyg which best describes the tendency of the binary to get redder when approaching the secondary minimum. If there were the reflection effect, the object would get bluer.
5 Absolute parameters and ETV diagrams
We found the masses of the components by a non-direct method we used in Volkov et al. (2017). The method is based on the empirical mass-luminosity relation, the 3rd Kepler law, and the relation between the absolute and relative radii:
| (3) |
While the light curves solution provides a reliable value for semidetached systems, see Table 3, the non-direct method yields , which is in perfect agreement with the value from the LCs solution. The absolute parameters of the system are presented in Table 4. Our photometric parallax, mas, matches quite well the GAIA DR2 value, mas, of Luri et al. (2018). We hope that with the use of these new GAIA data, temperature calibrations will be refined.
| Parameter | Primary | Secondary |
|---|---|---|
| (M⊙) | ||
| ) | ||
| (R⊙) | ||
| log (L⊙) | ||
| log | ||
| (R⊙) | 10.2 0.4 | |
| d [pc] | ||
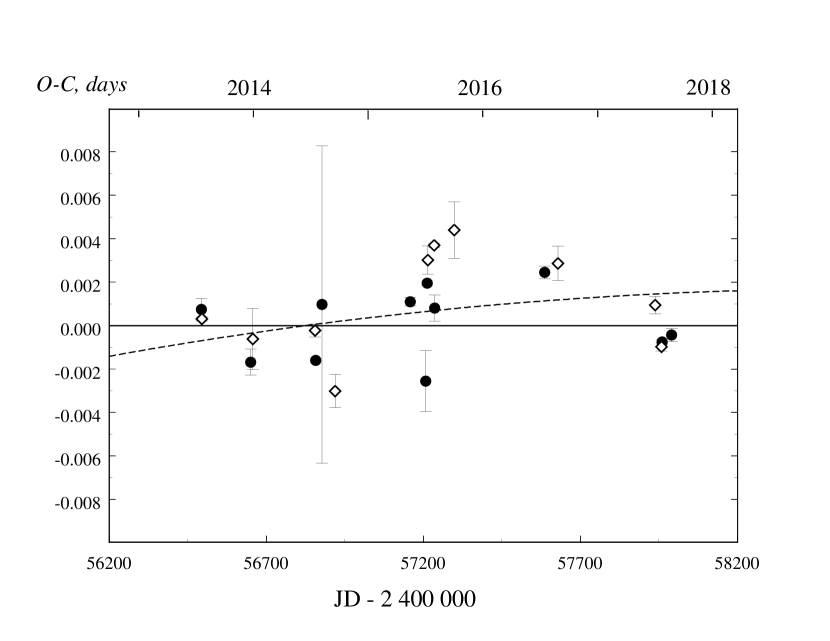
To derive precise minima times from photoelectric and CCD observations, we fitted the synthetic LCs, obtained during single overnight runs, by means of the PHOEBE program varying only the specific epoch. Sometimes, when only parts of the minimum were available for the close dates of observations, we compiled them into one minimum and assigned the acquired minimum time to the night with more numerous observations. In the case of simultaneous observations in several filters, the minima times were weighted and mean values were calculated. The minima times are listed in Table 5, together with the already published ones. Primary and secondary minima times were used to construct an ETV diagram, see Fig. 6. One can see that the period of the system is changing: close to JD=2456000, it became shorter.

The residuals in the ETV diagram (Fig. 6) and in Table 5 were calculated using the linear ephemeris which is suitable for the modern epoch:
HJD . (4)
The secondary component fills its Roche lobe and the mass transfer, or mass loss, might be responsible for the period change. Timings before JD2456000 satisfy the formula:
HJD , (5)
which coincides with the KG and Otero (2008) within errors. The minima times in the ETV diagram can also be fitted by a parabola (a continuous period change), represented by the following ephemeris:
HJD. (6)
| HJD2400000 | Epoch | Residuals | Residuals | Source |
|---|---|---|---|---|
| from linear | from para- | |||
| ephemeris (4) | bolic fit (6) | |||
| 43706.49 | -10480 | 0.1127 | 0.0060 | 1 |
| 51378.67 | -4366 | 0.0550 | 0.0285 | 2 |
| 55050.3899(11) | -1440 | 0.0116 | 0.0065 | 3 |
| 55833.4098(11) | -816 | 0.0150 | 0.0126 | 4 |
| 56493.4740(5) | -290 | 0.0008 | 0.0014 | t.w., |
| 56495.3549(1) | -288.5 | 0.0003 | 0.0010 | ” |
| 56650.3272(6) | -165 | 0.0017 | 0.0013 | 5 |
| 56657.2290(14) | -159.5 | 0.0006 | 0.0003 | ” |
| 56855.4949(3) | -1.5 | 0.0002 | 0.0003 | t.w., |
| 56857.3767(1) | 0 | 0.0016 | 0.0017 | ” |
| 56877.457(7) | 16 | 0.0010 | 0.0009 | 6 |
| 56919.4892(8) | 49.5 | 0.0030 | 0.0032 | 7 |
| 57158.5422(2) | 240 | 0.0011 | 0.0005 | ” |
| 57207.4775(14) | 279 | 0.0026 | 0.0032 | 8 |
| 57212.5014(1) | 283 | 0.0020 | 0.0013 | t.w., |
| 57214.3838(7) | 284.5 | 0.0030 | 0.0024 | 7 |
| 57234.4620(1) | 300.5 | 0.0037 | 0.0030 | t.w., |
| 57236.3423(6) | 302 | 0.0008 | 0.0001 | t.w., |
| 57298.4598(13) | 351.5 | 0.0044 | 0.0036 | 9 |
| 57586.4457(3) | 581 | 0.0025 | 0.0013 | 7 |
| 57628.4825(8) | 614.5 | 0.0029 | 0.0017 | ” |
| 57938.4273(4) | 861.5 | 0.0009 | 0.0005 | t.w., |
| 57958.5029(2) | 877.5 | 0.0010 | 0.0024 | ” |
| 57960.3863(1) | 879 | 0.0008 | 0.0022 | ” |
| 57990.5029(3) | 903 | 0.0004 | 0.0019 | t.w., , PMT |
Notes. 1 - KG; 2 - Otero (2008); 3 - Hubscher et al. (2010); 4 - Hubscher et al. (2013); 5 - Hubscher (2014); 6 - Hubscher & Lehmann (2015); 7 - Zasche et al. (2017); 8 - Hubscher (2016); 9 - Hubscher (2017); t.w. - this work.
The weights for the minima times were set equal to . Usually for such a configuration of the system one could expect mass transfer from the secondary component to the primary through the inner Lagrange point . In this case there should be a gradual increase in the orbital period of the binary star. But we are watching the opposite case – the period is decreasing. This means that a non-conservative mass loss from the secondary through the Lagrange point takes place. We can’t rule out the abrupt period decrease close to JD =2456000. Fig. 7 presents the ETV diagram for the modern epoch on a large scale. We cannot say that the parabolic fit has any advantage comparing to the linear law. The linear fit explains old observations better than the parabola does, see Fig. 6. So we may suppose that the processes of mass loss and mass transfer in this system can occur episodically but not continuously. Some systematic difference is seen in the shape of the light curve observed in 2013 comparing to LCs obtained in the 2014-2017 interval, i.e., the primary minimum was deeper by 0.01 in 2013. This difference may also be assigned to the processes mentioned above.
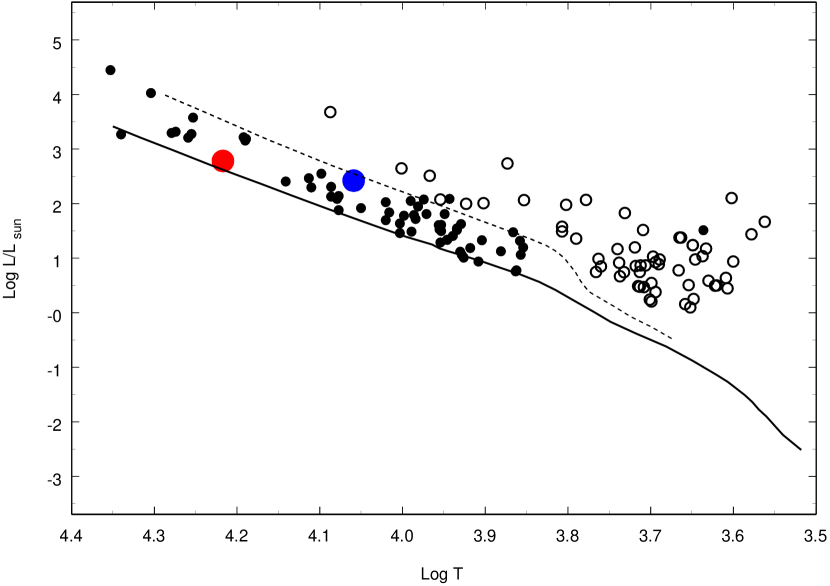
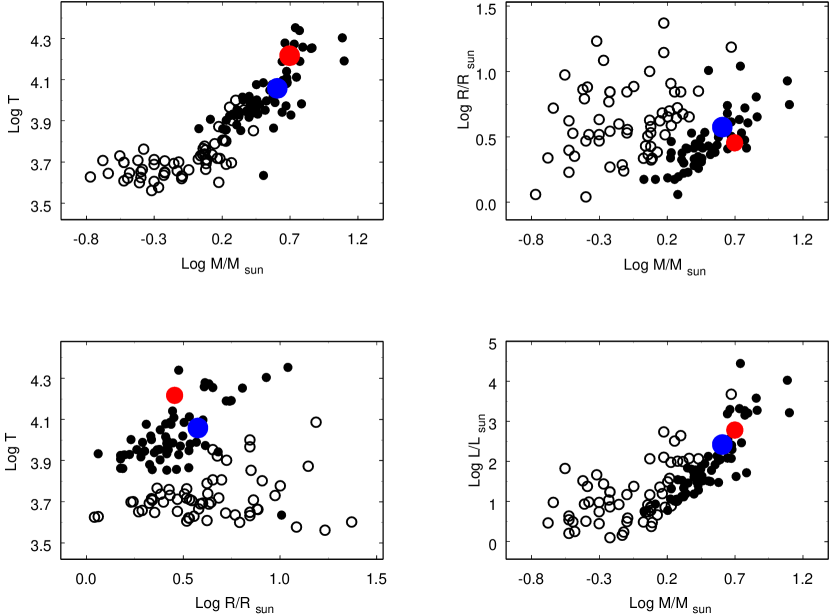
Figs. 8 and 9 show the location of the primary and secondary components in the HR diagram and , , , and diagrams for V2247 Cyg as well as for 61 semidetached Algol binaries with well-determined absolute parameters (Ibanoǧlu et al., 2006). While the position of the primary component is similar to that of other primaries, the secondary of V2247 Cyg lies near the border, of or even outside, the region occupied by other secondaries. It’s worth mentioning that, among 61 semidetached binaries listed in Ibanoǧlu et al. (2006), none of the systems consists of two B-class stars. What makes V2247 Cyg unusual, when compared to other semidetached Algol-type binaries, is its higher mass and temperature of the secondary.
6 Conclusions
Using multicolour photometry we obtained reliable parameters for the Algol-type binary V2247 Cyg: colour indices, interstellar reddening, mass ratio, inclination, effective temperatures of the components, fractional radius, the potential, as well as the albedo of the secondary and the gravity brightening coefficients. V2247 Cyg was found to be a semidetached system with the secondary filling its Roche lobe.
The B5III-V spectral type was ascribed to the low-resolution spectrum of V2247 Cyg.
Due to the lack of data on radial velocities, the masses of the components were computed by a non-direct method. The mass ratio derived this way is in excellent agreement with the value obtained through solving LCs.
The study of the ETV diagram enabled us to discover the orbital period decrease. It can be explained by a mass loss from the less massive secondary component.
In the HR and , , , and diagrams the primary component of V2247 Cyg lies well within the region occupied by the primaries of semidetached Algol-type binaries, whereas its secondary differs from other secondaries due to its higher mass and temperature.
We’d like to encourage high-resolution and high signal-to-noise spectroscopic observations of the system in order to determine the masses of the components from radial velocity curves.
Acknowledgements.
This study was partly supported by the scholarship of the Slovak Academic Information Agency(IMV), RNF grant 14-12-00146 and RFBR grant 18-502-12025(IMV). We are grateful to professor N. N. Samus for providing access to the card catalogue of SAI, Dr. V.P. Goranskij for permission to use his data prior to publication and to an anonymous referee for important corrections.References
- \articleAvvakumova, E.A., Malkov, O.Y., Kniazev, A.Y.2013\an334860 \articleBonifacio, P., Monai, S., Beers, T.C.2000AJ1202065 \articleFlower, P.J.1996ApJ469355 \articleFriedman, S.D., York, D.G., McCall, B.J., Dahlstrom, J., Sonnentrucker, P., Welty, D.E., Drosback, M.M., Hobbs, L.M., Rachford, B.L., Snow, T.P.2011ApJ72733 \articleGirardi, L., Bressan, A., Bertelli, G., Chiosi, C.2000\aaas141371
- (1) Gray, R.O., Corbally, J., C.: 2009, Stellar Spectral Classification, Princeton University Press \articleGreen, G.M., Schlafly, E.F., Finkbeiner, D.P., Rix, H.-W., Martin, N., Burgett, W., Draper, P.W., Flewelling, H., Hodapp, K., Kaiser, N., Kudritzki, R.P., Magnier, E., Metcalfe, N., Price, P., Tonry, J., Wainscoat, R.2015ApJ81025 \articleHerbig, G. H.1993ApJ407142
- (2) Hubscher, J.: 2014, Inf. Bull. Variable Stars 6118
- (3) Hubscher, J.: 2016, Inf. Bull. Variable Stars 6157
- (4) Hubscher, J.: 2017, Inf. Bull. Variable Stars 6196
- (5) Hubscher, J., Braune, W., Lehmann, P.B.: 2013, Inf. Bull. Variable Stars 6048
- (6) Hubscher, J., Lehmann, P.B.: 2015, Inf. Bull. Variable Stars 6149
- (7) Hubscher, J., Lehmann, P.B., Monninger, G., Steinbach, H.-M., Walter, F.: 2010, Inf. Bull. Variable Stars 5941 \articleIbanoǧlu, C., Soydugan, F., Soydugan, E., Dervişoǧlu, A.2006MNRAS373435
- (8) Kazarovets, E.V., Samus, N.N., Durlevich, O.V.: 2001, Inf. Bull. Variable Stars 5135 \articleLafler, J., Kinman, T.D.1965\apjss11216 \articleLandolt, A.U.1992AJ104340 \articleLandolt, A.U.2009AJ1374186 \articleLuri, X., Brown, A.G.A., Sarro, L.M., Arenou, F., Bailer-Jones, C.A.L., Castro-Ginard, A., de Bruijne, J., Prusti, T., Babusiaux, C., Delgado, H.E.2018A&A616A9
- (9) Lyutyj, V.M.: 1971, Soobshcheniya Gosudarstvennogo Astronomicheskogo Instituta 172, 30 \articleMalkov, O.Y., Oblak, E., Snegireva, E.A., Torra, J.2006\aaa446785
- (10) Mermilliod, J.C.: 1997, VizieR Online Data Catalog, 2168 \articleMoffett, T.J., Barnes, III, T.G.1979AJ84627 \articleOtero, S.A.2008Open European Journal on Variable Stars911 \articlePopper, D.M.1980\ar18115 \articlePrša, A., Zwitter, T.2005ApJ628426 \articleSchlafly, E.F., Finkbeiner, D.P.2011ApJ737103 \articleSchlegel, D.J., Finkbeiner, D.P., Davis, M.1998ApJ500525
- (11) Straižys, V.: 1982, Metal-deficient stars, Mokslas, Vil’nyus
- (12) Straižys, V.: 1992, Multicolor stellar photometry, Tucson : Pachart Pub. House \articlevan Hamme, W.1993AJ1062096 \articleVolkov, I.M., Chochol, D., Grygar, J., Mašek, M., Juryšek, J.2017\caos4729
- (13) Zasche, P., Uhlar, R., Svoboda, P., Kucakova, H., Masek, M., Jurysek, J.: 2017, Inf. Bull. Variable Stars 6204